M A T E R N A L - F E T A L M E D I C I N E
Temporal trends in fetal mortality at and beyond term
and induction of labor in Germany 2005–2012: data from German
routine perinatal monitoring
Christiane Schwarz1,2 •Rainhild Scha¨fers3•Christine Loytved4• Peter Heusser1•Michael Abou-Dakn5•Thomas Ko¨nig6•Bettina Berger1
Received: 22 December 2014 / Accepted: 16 June 2015
ÓThe Author(s) 2015. This article is published with open access at Springerlink.com
Abstract
Purpose While a variety of factors may play a role in fetal and neonatal deaths, postmaturity as a cause of still-birth remains a topic of debate. It still is unclear, whether induction of labor at a particular gestational age may pre-vent fetal deaths.
Methods A multidisciplinary working group was granted access to the most recent set of relevant German routine perinatal data, comprising all 5,291,011 hospital births from 2005 to 2012. We analyzed correlations in rates of induction of labor (IOL), perinatal mortality (in particular stillbirths) at different gestational ages, and fetal morbidity. Correlations were tested with Pearson’s product-moment analysis (a=5 %). All computations were performed with
SPSS version 22.
Results Induction rates rose significantly from 16.5 to 21.9 % (r=0.98; p\0.001). There were no significant
changes in stillbirth rates (0.28–0.35 per 100 births; r=0.045; p =0.806). Stillbirth rates 2009–2012 remained stable in all gestational age groups irrespective of induction. Fetal morbidity (one or more ICD-10 codes) rose significantly during 2005–2012. This was true for both children with (from 33 to 37 %,r=0.784,p\0.001) and
without (from 25 to 31 %, (r=0.920, p\0.001) IOL.
Conclusions An increase in IOL at term is not associated with a decline in perinatal mortality. Perinatal morbidity increased with and without indiction of labor.
Keywords Fetal mortalityPerinatal dataPostmaturity Post-datesInduction of labor
& Christiane Schwarz
[email protected] Rainhild Scha¨fers
[email protected] Christine Loytved
[email protected] Peter Heusser
[email protected] Michael Abou-Dakn [email protected] Thomas Ko¨nig
[email protected] Bettina Berger
1 Gerhard Kienle Lehrstuhl fu¨r Medizintheorie, Integrative und
Anthroposophische Medizin, Institute for Integrative Medicine (IfIM), Universita¨t Witten/Herdecke, Gemeinschaftskrankenhaus, Gerhard-Kienle-Weg 4, 58313 Herdecke, Germany
2
Midwifery Research and Education Unit, Department of Obstetrics, Gynaecology and Reproductive Medicine, Hannover Medical School, Carl-Neuberg-Str. 1, 30625 Hannover, Germany
3
Department of Applied Health Sciences, University of Applied Sciences, Universita¨tsstraße 105, 44789 Bochum, Germany
4 School of Health Professions, Institute of Midwifery, Zurich
University of Applied Sciences, Winterthur, Switzerland
5
Studiengang Hebammenkunde, Evangelische Hochschule Berlin, Teltower Damm 118-122, 14167 Berlin, Germany
6
AQUA-Institut fu¨r angewandte Qualita¨tsfo¨rderung und Forschung im Gesundheitswesen GmbH, Maschmu¨hlenweg 8-10, 37073 Go¨ttingen, Germany
Introduction
While prematurity and congenital anomalies remain the leading cause of perinatal mortality and morbidity, there are also fetal deaths of mature, apparently normally formed babies. There has been a debate about factors causing late stillbirths in this population including postmaturity. Induction of labor (IOL) at a specific gestational age may prevent some of those deaths, with or without influencing the rate of Cesarean sections [1–9]. Current studies suggest a multifactorial explanation for fetal deaths, such as maternal risk factors like primiparity, hypertension and diabetes, advanced age, obesity, or smoking. As far as fetal risks are concerned, fetuses of relatively low and high weight seem to be at higher risk than average-sized babies, pointing to growth retardation as well as diabetic compli-cations in pregnancy as relevant risk factors [10, 11]. As Warland et al. [12] discuss in their recent publication, combinations of any of those risk factors with an acute stressor like venocaval compression may then lead to fetal demise. Also, a cluster of genetic predispositions correlated with ethnicity may influence the risk of stillbirth [13,14]. Infections are another cause of fetal death and severe neonatal morbidity [15]. The role of a previous Cesarean section needs to be further evaluated [16]. Even an envi-ronmental influence of seasonal temperature changes on stillbirth rates has been discussed [17].
With all these approaches aiming to analyze different causes of fetal death, the role of postmaturity as a cause of perinatal mortality is another open question. In fact, there is still debate about the ideal gestational age for delivery and how to statistically measure stillbirth rates [18–24]. The ‘‘fetus-at-risk’’ model calculates the risk of fetal death per ongoing pregnancy rather than per 1000 births in that gestational week [18,19,21,22,25,26]. The incidence of adverse perinatal outcomes due to prematurity drops with advancing gestational age, while the risk of fetal death due to postmaturity seems to rise as pregnancy progresses once term is reached. To reliably determine the risk of perinatal death—in particular, stillbirth—due to postma-turity, or to calculate an individual risk for a particular fetus seems impossible on these grounds. Recent clinical guidelines suggest to advise or offer induction of labor once the gestational age of 41?0 is reached [27–29]. However, the insecurity to exactly determine the gesta-tional age in an individual pregnancy, the variety of fac-tors leading to fetal demise, and the ongoing debate on the correct calculation of fetal risk makes a clear recom-mendation for an individual pregnant woman difficult. Also, there may be harmful impacts on neonatal morbidity with IOL at term that needs to be addressed [30]. In the light of these open questions, it seems reasonable to take a
look at the development of IOL rates and rates of perinatal mortality and morbidity on a population level in recent data to find out whether or not there may be a correlation between rates of labor induction and fetal and neonatal health outcomes.
Method
A multidisciplinary working group based at Universita¨t Witten/Herdecke was granted access to the most recent German routine perinatal data with the Federal Joint Committee, (‘‘Gemeinsamer Bundesausschuss,’’ G-BA) in 2013. According to University of Witten Ethics Committee and German Federal Joint Committee, formal ethical approval was not necessary, as retrospective perinatal data were collected and displayed under German data protection laws. Data collection covered all hospital births (approxi-mately 98.5 % of all births) in Germany. Until 2008, rou-tine perinatal data were processed and published by the National Institute for Quality and Patient Safety (‘‘Institut fu¨r Qualita¨t und Patientensicherheit,’’ BQS); since 2009, the Institute for Applied Quality Improvement and Research in Health Care (AQUA) is responsible for data collection and publication within the nationwide cross-sectoral healthcare quality assurance. The perinatal dataset contains 190 items regarding pregnancy and birth process and outcome indicators. Due to data protection laws, linking of individual datasets from the perinatal and the neonatal registers is not possible. Between 2005 and 2012, perinatal datasets of 5,291,011 births were recorded. Data encompassed
1. IOL frequency and rate, 2. Gestational age of IOL,
3. ‘‘post-term’’ as the reason for induction of labor, 4. Fetal death rate (whole sample and sample[36?6
gestation excluding multiple pregnancies and fetuses with known structural abnormalities) with and without IOL,
5. Fetal death rate at particular gestational ages (whole sample and sample [36?6 gestation excluding multiple pregnancies and fetuses with known structural abnormalities),
6. Neonatal morbidity (all diagnoses and hypoxia/breath-ing irregularities) in relation with gestational age and IOL, and
7. Maternal morbidity in relation to IOL and maternal age.
Results
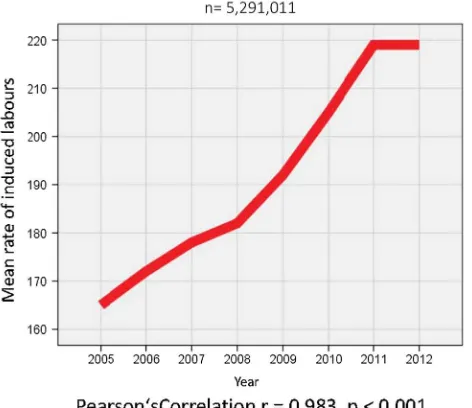
1. The induction of labor (IOL) rates in all 5,291,011 pregnancies changed between 2005 and 2012, showing a steady rise from 16.5 % (n=109,709) in 2005 to 21.9 % (n=145,265) in 2012. This rise was almost perfectly linear and highly significant (r=0.983,
p\0.001) (Fig. 1).
2. The mean gestational age at induction of labor changed significantly between 2005 (41?0 gestation) and 2012 (39?5 gestation) (r=0.920, p\0.001). This
change did not develop evenly over time, but with a steep drop between 2008 and 2009. The re-calculation for 2009–2012 showed no change in mean gestational age.
3. Postmaturity as the given reason for IOL showed a similar pattern as the mean gestational age, with an even rate between 2005 and 2008 (mean 75.5 %), and then again an even rate between 2009 and 2012 on a very different level (mean 54.4 %). Pearson correlation over time is significant (r=0.646, p=0.007). 4. Fetal death rate for all births (n=17,455 versus
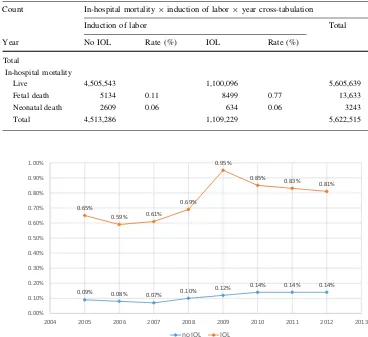
5,291,011 live births) remained stable between 2005 (0.331 %) and 2012 (0.334 %) with no significant changes or even trends (r=0.045,p =0.806). There was a marked decrease in stillbirth rates in the third quarter (July–September: mean 0.3026, SD 0.13) of each year, compared to the months January–June and October–Dec (mean 0.34, SD 0.13), while at the same time birth rates during these months were peaking (Fig.2). T test shows that this difference is highly significant (p\0.001).
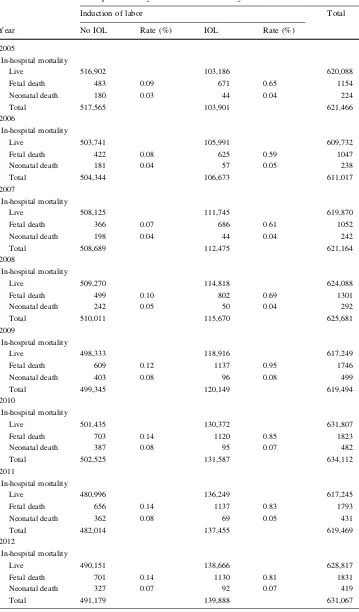
5. When stillbirth rates 2005–2012 were calculated for singleton pregnancies later than [36?0 gestation (n=5,622,515), rates showed an increase from 0.19 % in 2005 to 0.29 % in 2012 (p\0.001). This
was true for both infants with induced (n =5134 stillbirths versus 1,100,096 live births) and non-induced (n=5134 stillbirths versus 4,505,543 live births) labors. Mean fetal death rates for induced labors were 0.77 % versus 0.11 % for non-induced pregnan-cies. Early neonatal death rates showed a similar increase in both groups (Table1; Fig.3).
6. Neonatal morbidity between 2005 and 2012 was defined as every infant diagnosed with ICD10 code during this time interval. Obviously, morbidity rates (ICD-10 codes, without/with IOL) in term neonates differ according to maturity, with the highest rates in early term infants before 38?0 gestation (7.12 %/
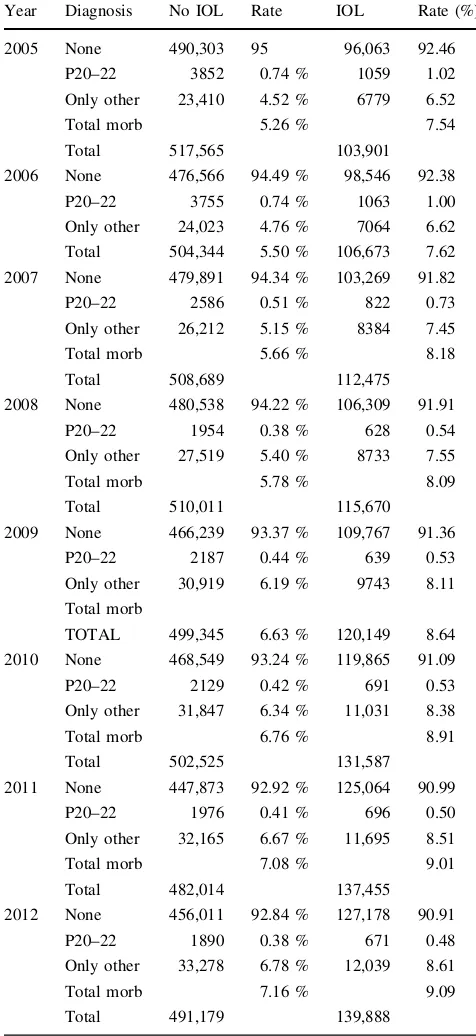
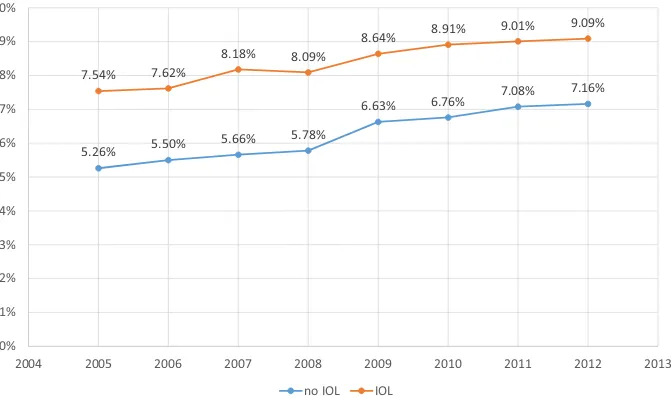
10.33 %) and later than 42 completed weeks (10.97 %/ 12.65 %). The lowest rates are 39?0–39?6 gesta-tion (4.77 %/7.02 %). When we restricted the analysis for term neonates to hypoxia/respiratory distress (ICD-10 P 20–22), rates 2005–2012 decreased for both induced (1.02–0.48 %) and non-induced (0.74–0.38 %) infants, but at the same time other diagnoses increased in both groups, adding up to a net increase for total morbidity in term neonates over the study period (7.54–9.09 % for IOL and 5.26 to 7.16 % without induction, Pearson’s correlation r=0.976 (p\0.01)) (Table 2; Fig.4).
7. Maternal morbidity rates were calculated using any documented maternal complication. These were per-ineal trauma, hemorrhage, peripartum hysterectomy, eclampsia, sepsis, and other. Morbidity rates in relation to gestational age at delivery as well as in relation to Fig. 1 Rate of IOL 2005–2012 per 1000 deliveries
Table 1 Perinatal mortality with and without induction of labor, Germany, 2005–2012
Count In-hospital mortality9induction of labor9year cross-tabulation
Induction of labor Total
Year No IOL Rate (%) IOL Rate (%)
2005
In-hospital mortality
Live 516,902 103,186 620,088
Fetal death 483 0.09 671 0.65 1154
Neonatal death 180 0.03 44 0.04 224
Total 517,565 103,901 621,466
2006
In-hospital mortality
Live 503,741 105,991 609,732
Fetal death 422 0.08 625 0.59 1047
Neonatal death 181 0.04 57 0.05 238
Total 504,344 106,673 611,017
2007
In-hospital mortality
Live 508,125 111,745 619,870
Fetal death 366 0.07 686 0.61 1052
Neonatal death 198 0.04 44 0.04 242
Total 508,689 112,475 621,164
2008
In-hospital mortality
Live 509,270 114,818 624,088
Fetal death 499 0.10 802 0.69 1301
Neonatal death 242 0.05 50 0.04 292
Total 510,011 115,670 625,681
2009
In-hospital mortality
Live 498,333 118,916 617,249
Fetal death 609 0.12 1137 0.95 1746
Neonatal death 403 0.08 96 0.08 499
Total 499,345 120,149 619,494
2010
In-hospital mortality
Live 501,435 130,372 631,807
Fetal death 703 0.14 1120 0.85 1823
Neonatal death 387 0.08 95 0.07 482
Total 502,525 131,587 634,112
2011
In-hospital mortality
Live 480,996 136,249 617,245
Fetal death 656 0.14 1137 0.83 1793
Neonatal death 362 0.08 69 0.05 431
Total 482,014 137,455 619,469
2012
In-hospital mortality
Live 490,151 138,666 628,817
Fetal death 701 0.14 1130 0.81 1831
Neonatal death 327 0.07 92 0.07 419
IOL showed an inexplicable, steep drop between 2007 and 2008. Analysis was then restricted to 2008–2012. For women with no IOL rates remained stable over the period, with approximately half of the study population experiencing no complications. For women who were induced, the rate of complications increased steadily from 51.24 to 55.97 %. This finding was significant (p\0.001). Maternal age was not documented before
2006. Mean maternal age increased during the period 2006–2012 from 29.45 to 30.22 years. This rise correlated with the increase in fetal death rate and neonatal mortality and morbidity (r=0.882, p\0.01) (Table 3; Fig.5).
Discussion
Our results do not show a correlation between fetal death, gestational age and a possible benefit of induction of labor at term. Some patterns of fetal deaths, like seasonal chan-ges in stillbirth rates, remain inexplicable. Within all the post-term discussion, there is still little mention of other causes (like maternal age, infections, growth retardation or
macrosomia, maternal sleeping positions, and other) being responsible for the majority of stillbirths [11,12,14]. Study results on perinatal/fetal mortality informing clinical guidelines are often based on retrospective secondary data that have not been adjusted to those factors. Due to these study designs, it has—in spite of extensive research—to date been impossible to determine definite causal variables for most fetal deaths [10,11,20,31–33]. The rareness of the event of a fetal death adds to the complexity of inter-preting study results—one case more or less makes for a huge difference in death rates. In the absence of robust knowledge on causes for fetal deaths in normal pregnan-cies, many clinical guidelines offer or recommend IOL at or after a certain gestational length, relating to the inter-pretation of secondary statistical data [28,34–36]. On the assumption that stillbirth rates increase after 41?0 ges-tational age, IOL appears to be the solution to prevent those fetal deaths. If that was the case, stillbirth rates should decline when IOL rates at or after that date increase.
We applied for the complete dataset of all 5,291,011 births with no exclusion criteria, because we wanted to be able to check for ‘‘surprises’’ (like the change in defini-tions/diagnostic to determine gestational age). To ensure Table 1 continued
Count In-hospital mortality9induction of labor9year cross-tabulation
Induction of labor Total
Year No IOL Rate (%) IOL Rate (%)
Total
In-hospital mortality
Live 4,505,543 1,100,096 5,605,639
Fetal death 5134 0.11 8499 0.77 13,633
Neonatal death 2609 0.06 634 0.06 3243
Total 4,513,286 1,109,229 5,622,515
0.09% 0.08%
0.07%
0.10% 0.12%
0.14% 0.14% 0.14%
0.65%
0.59% 0.61%
0.69%
0.95%
0.85%
0.83%
0.81%
0.00% 0.10% 0.20% 0.30% 0.40% 0.50% 0.60% 0.70% 0.80% 0.90% 1.00%
2004 2005 2006 2007 2008 2009 2010 2011 2012 2013
no IOL IOL
comparability with other published data, a decision was made not to adjust for known variables related to stillbirths, like socio-economic status, drug consumption, and diag-nosis of gestational diabetes (universal screening for ges-tational diabetes has only become part of routine German antenatal care in 2012). While analyzing the data, some of
the above outcome parameters showed implausibility that could not be explained by experts. There were marked differences between the cluster years 2005–2008 and 2009–2012, which corresponded with the change in both data processing institutes BQS and AQUA in Germany. This sharp drop from one quarter to the other may be caused by a methodological artifact. Due to this finding, the working group consented in re-calculating the data for the years 2009–2012 (n=2,626,997), where appropriate. We calculated sub-samples (singleton term pregnancies), where appropriate. We cannot explain a steep rise in fetal death rate after 2008 due to possible artifacts with data processing by two different institutions. When we looked for an explanation for increasing morbidity rates from 2009 to 2012, we included maternal age and found that we found that mean maternal age increased from 29.45 to 30.22 years. This finding correlates significantly with the increase in neonatal morbidity (r=0.882, p\0.01).
Morbidity in the dataset contains all ICD-10 codes between P00 and P96 (problems originating in the perinatal period) documented by the hospitals. These are mainly infections, respiratory problems, or hypoxia. We decided not to focus on meconium aspiration (as a typical scenario associated with postmaturity) only, as we did not want to miss other potential adverse effects of induction or watchful waiting that may outweigh benefits. Still, we calculated morbidity for infants with and without IOL and for ICD-10 codes P20–22 (hypoxia/respiratory distress). While morbidity in term infants increased in both induced and not induced pregnancies, maternal complications increased in induced women only. Data do not prove a causal relationship between maternal and neonatal morbidity and IOL (was IOL initiated because of maternal complications, followed by neonatal morbidity, or does maternal and neonatal morbidity increase due to IOL). Induction may occasionally have been offered to older women over the study period, although the German guidelines do not suggest a particular maternal age for earlier induction. A causal link between IOL and possible changes in morbidity or mortality for infants or mothers cannot be proven with our study design. The increases in neonatal and maternal morbidity could be attributed to the increase in maternal age. Maternal age increased slightly during this period. Still, other factors cannot be determined, as the diagnosis and definition for complications like gestational diabetes changed during the study period, leading to incomparable results. As more than one indication for IOL can be documented in the data, reasons like ‘‘maternal request’’ are not included in the documentation, and ‘‘postmaturity’’ may be documented for term pregnancies between 40?0 and 41?3 gestational weeks, it is difficult to link indications to outcomes. We argue that the increase in IOL has not been accompanied by a decline in morbidity or mortality for neither women nor Table 2 Morbidity in term neonates, Germany 2005–2012, for
infants with and without induction of labor
Year Diagnosis No IOL Rate IOL Rate (%)
2005 None 490,303 95 96,063 92.46
P20–22 3852 0.74 % 1059 1.02
Only other 23,410 4.52 % 6779 6.52
Total morb 5.26 % 7.54
Total 517,565 103,901
2006 None 476,566 94.49 % 98,546 92.38
P20–22 3755 0.74 % 1063 1.00
Only other 24,023 4.76 % 7064 6.62
Total 504,344 5.50 % 106,673 7.62
2007 None 479,891 94.34 % 103,269 91.82
P20–22 2586 0.51 % 822 0.73
Only other 26,212 5.15 % 8384 7.45
Total morb 5.66 % 8.18
Total 508,689 112,475
2008 None 480,538 94.22 % 106,309 91.91
P20–22 1954 0.38 % 628 0.54
Only other 27,519 5.40 % 8733 7.55
Total morb 5.78 % 8.09
Total 510,011 115,670
2009 None 466,239 93.37 % 109,767 91.36
P20–22 2187 0.44 % 639 0.53
Only other 30,919 6.19 % 9743 8.11
Total morb
TOTAL 499,345 6.63 % 120,149 8.64
2010 None 468,549 93.24 % 119,865 91.09
P20–22 2129 0.42 % 691 0.53
Only other 31,847 6.34 % 11,031 8.38
Total morb 6.76 % 8.91
Total 502,525 131,587
2011 None 447,873 92.92 % 125,064 90.99
P20–22 1976 0.41 % 696 0.50
Only other 32,165 6.67 % 11,695 8.51
Total morb 7.08 % 9.01
Total 482,014 137,455
2012 None 456,011 92.84 % 127,178 90.91
P20–22 1890 0.38 % 671 0.48
Only other 33,278 6.78 % 12,039 8.61
Total morb 7.16 % 9.09
Total 491,179 139,888
Table 3 Maternal morbidity9
all complications9with and without IOL, Germany, 2005–2012
Year No IOL Rate (%) IOL Rate (%) Mean maternal age
2005
No comp 262,141 50.65 50,660 48.76 No data available
Any comp 255,424 49.35 53,241 51.24
Total 517,565 103,901
2006
No comp 254,088 50.38 51,085 47.89 29.45
Any comp 250,256 49.62 55,588 52.11
Total 504,344 106,673
2007
No comp 263,718 51.84 54,648 48.59 29.88
Any comp 244,971 48.16 57,827 51.41
Total 508,689 112,475
2008
No comp 264,954 51.95 55,086 47.62 29.96
Any comp 245,057 48.05 60,584 52.38
Total 510,011 115,670
2009
No comp 259,015 51.87 56,319 46.87 30.05
Any comp 240,330 48.13 63,830 53.13
Total 499,345 120,149
2010
No comp 258,088 51.36 60,582 46.04 30.14
Any comp 244,437 48.64 71,005 53.96
Total 502,525 131,587
2011
No comp 245,318 50.89 61,849 45.00 30.21
Any comp 236,696 49.11 75,606 55.00
Total 482,014 137,455
2,012
No comp 245,727 50.03 61,599 44.03 30.22
Any comp 245,452 49.97 78,289 55.97
Total 491,179 139,888
0.03%
0.04% 0.04%
0.05%
0.08% 0.08% 0.08%
0.04%
0.05%
0.04% 0.04%
0.08%
0.07%
0.05%
0.07%
0.00% 0.01% 0.02% 0.03% 0.04% 0.05% 0.06% 0.07% 0.08% 0.09%
2004 2005 2006 2007 2008 2009 2010 2011 2012 2013
no IOL IOL
babies. So, the recommendation to induce more liberally cannot be supported by our data. Our results do not show a correlation between fetal death, gestational age and induc-tion of labor at term and therefor no benefit regarding the reduction of the fetal death rate.
As the overall incidence of fetal death has been histor-ically low in developed nations over the past decades, the current rates may even reflect the limit of avoidable cases. Very unlikely will there ever be a zero rate for stillbirths. We need to take into consideration possible factors for the significant rise of maternal/fetal morbidity when we inter-vene in a healthy pregnancy hoping to maybe prevent a stillbirth, and we need to counsel women on the grounds of solid evidence.
Conclusions
Our data show that IOL at and shortly beyond term is not correlated with a decline in perinatal mortality, in partic-ular not with fetal deaths. We noticed a rise in both neonatal and maternal morbidity within the time period 2005–2012 or, where appropriate due to data quality, during 2009–2012. Our findings indicate that in the absence of solid understanding of all risk factors for still-birth, an intervention which may lack some proof to be more beneficial to both mothers and children than to ‘‘watch and wait,’’ like routine liberal use of IOL in healthy term women, should be outweighed carefully for potential harm and benefit. Our data analysis does not support early term IOL in healthy women. There is a lack of data on women’s views and their experiences with induction of labor. Evaluation of stillbirth cases for underlying causes and the effectiveness of different pathways for expectant management need to be further explored.
Compliance with ethical standards
Conflict of interest We declare that we have no conflict of interest.
Open Access This article is distributed under the terms of the Creative Commons Attribution 4.0 International License (http:// creativecommons.org/licenses/by/4.0/), which permits unrestricted use, distribution, and reproduction in any medium, provided you give appropriate credit to the original author(s) and the source, provide a link to the Creative Commons license, and indicate if changes were made.
References
1. Gu¨lmezoglu AM, Crowther CA, Middleton P, Heatley E (2012) Induction of labour for improving birth outcomes for women at or beyond term. Cochrane Database Syst Rev 6:CD004945. doi:10. 1002/14651858.CD004945.pub3
2. Stock SJ, Ferguson E, Duffy A, Ford I, Chalmers J, Norman JE (2012) Outcomes of elective induction of labour compared with expectant management: population based study. BMJ 344:e2838 3. Grivell RM, Reilly AJ, Oakey H, Chan A, Dodd JM (2012) Maternal and neonatal outcomes following induction of labor: a cohort study. Acta Obstet Gynecol Scand 91:198–203. doi:10. 1111/j.1600-0412.2011.01298.x
4. Kiesewetter B, Lehner R (2012) Maternal outcome monitoring: induction of labor versus spontaneous onset of labor—a retro-spective data analysis. Arch Gynecol Obstet 286:37–41. doi:10. 1007/s00404-012-2239-0
5. Tam T, Conte M, Schuler H, Malang S, Roque M (2012) Delivery outcomes in women undergoing elective labor induction at term. Arch Gynecol Obstet 287:407–411. doi: 10.1007/s00404-012-2582-1
6. Dunne C, Da Silva O, Schmidt G, Natale R (2009) Outcomes of elective labour induction and elective caesarean section in low-risk pregnancies between 37 and 41 weeks’ gestation. J Obstet Gynaecol Can 31:1124–1130
7. Bodner-Adler B, Bodner K, Pateisky N, Kimberger O, Chalu-binski K, Mayerhofer K, Husslein P (2005) Influence of labor induction on obstetric outcomes in patients with prolonged pregnancy: a comparison between elective labor induction and
5.26% 5.50%
5.66% 5.78%
6.63% 6.76%
7.08% 7.16% 7.54% 7.62%
8.18% 8.09%
8.64% 8.91%
9.01% 9.09%
0% 1% 2% 3% 4% 5% 6% 7% 8% 9% 10%
2004 2005 2006 2007 2008 2009 2010 2011 2012 2013
no IOL IOL Fig. 5 Total morbidity in
spontaneous onset of labor beyond term. Wien Klin Wochenschr 117:287–292
8. Patterson JA, Roberts CL, Ford JB, Morris JM (2011) Trends and outcomes of induction of labour among nullipara at term. Aust N Z J Obstet Gynaecol 51:510–517. doi:10.1111/j.1479-828X.2011. 01339.x
9. Ecker JL, Chen KT, Cohen AP, Riley LE, Lieberman ES (2001) Increased risk of cesarean delivery with advancing maternal age: indications and associated factors in nulliparous women. Am J Obstet Gynecol 185:883–887. doi:10.1067/mob.2001.117364
10. Cnattingius S, Stephansson O (2011) The challenges of reducing risk factors for stillbirths. Lancet 377:1294–1295. doi:10.1016/ S0140-6736(11)60027-5
11. Flenady V, Koopmans L, Middleton P, Frøen JF, Smith GC, Gibbons K, Coory M, Gordon A, Ellwood D, McIntyre HD, Fretts R, Ezzati M (2011) Major risk factors for stillbirth in high-income countries: a systematic review and meta-analysis. Lancet 377:1331–1340. doi:10.1016/S0140-6736(10)62233-7
12. Warland J, Mitchell EA (2014) A triple risk model for unex-plained late stillbirth. BMC Pregnancy Childbirth 14:142. doi:10. 1186/1471-2393-14-142
13. Ravelli ACJ, Schaaf JM, Eskes M, Abu-Hanna A, de Miranda E, Mol BWJ (2013) Ethnic disparities in perinatal mortality at 40 and 41 weeks of gestation. J Perinat Med 41:381–388. doi:10. 1515/jpm-2012-0228
14. Reeske A, Kutschmann M, Razum O, Spallek J (2011) Stillbirth differences according to regions of origin: an analysis of the German perinatal database, 2004–2007. BMC Pregnancy Child-birth 11:63. doi:10.1186/1471-2393-11-63
15. Goldenberg RL, McClure EM, Saleem S, Reddy UM (2010) Infection-related stillbirths. Lancet 375:1482–1490. doi:10.1016/ S0140-6736(09)61712-8
16. Smith GC, Pell JP, Bobbie R (2003) Caesarean section and risk of unexplained stillbirth in subsequent pregnancy. Lancet 362:1779–1784. doi:10.1016/S0140-6736(03)14896-9
17. Strand LB, Barnett AG, Tong S (2011) The influence of season and ambient temperature on birth outcomes: a review of the epidemiological literature. Environ Res 111:451–462. doi:10. 1016/j.envres.2011.01.023
18. Joseph KS (2007) Theory of obstetrics: an epidemiologic framework for justifying medically indicated early delivery. BMC Pregnancy Childbirth 7:4. doi:10.1186/1471-2393-7-4
19. Caughey AB (2007) Measuring perinatal complications: methodologic issues related to gestational age. BMC Pregnancy Childbirth 7:18. doi:10.1186/1471-2393-7-18
20. Ego A, Zeitlin J, Batailler P, Cornec S, Fondeur A, Baran-Marszak M, Jouk P-S, Debillon T, Cans C (2013) Stillbirth classification in population-based data and role of fetal growth restriction: the example of RECODE. BMC Pregnancy Childbirth 13:182. doi:10.1186/1471-2393-13-182
21. Mandujano A, Waters TP, Myers SA (2013) The risk of fetal death: current concepts of best gestational age for delivery. Am J Obstet Gynecol 208(207):e1–e8. doi:10.1016/j.ajog.2012.12.005
22. Weiss E, Krombholz K, Eichner M (2014) Fetal mortality at and beyond term in singleton pregnancies in Baden-Wuerttemberg/ Germany 2004–2009. Arch Gynecol Obstet 289:79–84. doi:10. 1007/s00404-013-2957-y
23. Hedegaard M, Lidegaard Ø, Skovlund C, Mørch L (2015) Peri-natal outcomes following an earlier post-term labour induction policy: a historical cohort study. BJOG. doi:10.1111/1471-0528. 13299
24. Kjeldsen LL, Sindberg M, Maimburg RD (2015) Earlier induc-tion of labour in post term pregnancies—a historical cohort study. Midwifery. doi:10.1016/j.midw.2015.02.003
25. Joseph KS (2008) The fetuses-at-risk approach: clarification of semantic and conceptual misapprehension. BMC Pregnancy Childbirth 8:11. doi:10.1186/1471-2393-8-11
26. Schwarz C, Weiss E, Loytved C, Scha¨fers R, Ko¨nig T, Heusser P, Berger B (2015) Fetale Mortalita¨t bei Einlingen ab Termin–eine Analyse bundesdeutscher Perinataldaten 2004–2013. Z Ge-burtshilfe Neonatol. doi:10.1055/s-0034-1398659
27. ACOG (2014) Obstetric care consensus no. 1: safe prevention of the primary cesarean delivery. Obstet Gynecol 123:693–711. doi:10.1097/01.AOG.0000444441.04111.1d
28. National Collaborating Centre for Women’s and Children’s Health (2008) Induction of labour
29. Deutsche Gesellschaft fu¨r Gyna¨kologie und Geburtshilfe (2010) Terminu¨berschreitung und U¨ bertragung. S1-Leitlinie. Germany.
http://www.awmf.de
30. Allen VM, Stewart A, O’Connell CM, Baskett TF, Vincer M, Allen AC (2012) The influence of changing post-term induction of labour patterns on severe neonatal morbidity. J Obstet Gynaecol Can 34:330–340
31. Helgado´ttir LB, Turowski G, Skjeldestad FE, Jacobsen AF, Sandset PM, Roald B, Jacobsen E-M (2013) Classification of stillbirths and risk factors by cause of death—a case-control study. Acta Obstet Gynecol Scand 92:325–333. doi:10.1111/aogs.12044
32. Spong CY, Reddy UM, Willinger M (2011) Addressing the complexity of disparities in stillbirths. Lancet 377:1635–1636. doi:10.1016/S0140-6736(11)60025-1
33. Stormdal Bring H, Hulthe´n Varli IA, Kublickas M, Papado-giannakis N, Pettersson K (2014) Causes of stillbirth at different gestational ages in singleton pregnancies. Acta Obstet Gynecol Scand 93:86–92. doi:10.1111/aogs.12278
34. Deutsche Gesellschaft fu¨r Gyna¨kologie und Geburtshilfe (DGGG) (2014) S1-Leitlinie: Vorgehen bei Terminu¨berschre-itung und U¨ bertragung