SATELLITE AND UNMANNED AERIAL VEHICLE DATA FOR THE CLASSIFICATION
OF SAND DUNE VEGETATION
M. De Giglio 1,*, F. Goffo 1., N. Greggio 2, N. Merloni 3, M. Dubbini 4 and M. Barbarella 1
1 Civil, Chemical, Environmental and Materials Engineering Department (DICAM), University of Bologna, Viale Risorgimento 2, 40136 Bologna, Italy; {michaela.degiglio; maurizio.barbarella}@unibo.it, [email protected]
2 Interdepartmental Centre for Environmental Science Research (CIRSA), Lab. IGRG, University of Bologna, Via S. Alberto 163, 48100 Ravenna, Italy; [email protected]
3 Piazza A.Costa 15, I-48015 Cervia (Ravenna) Italy; [email protected]
4 DiSCi, Geography Sec., University of Bologna, Piazza San Giovanni in Monte 2, I40124, Bologna, Italy, [email protected]
Commission III
KEY WORDS: WorldView2, Unmanned Aerial Vehicle, coastal vegetation, sand dunes, pixel-based classification, object-based classification
ABSTRACT:
Within coastal systems, sand dunes are the only natural barriers able to counteract erosive processes. Since their equilibrium is often threatened by human activities and high vulnerability of the coastal environment, dunes require increasing attention and specific monitoring. Located between the mainland and the sea, dunes are unique residue habitats for some plant and animal species. In particular, their vegetation is important because it has a consolidation function and promotes the vertical dune accretion. A georeferenced vegetation classification can be useful to define the advancements or erosion stage of the dune, usually based only on the geometric reconstruction.
The proposed study aims to compare the classifications performed with some combinations of two of the last generation sensors and traditional image processing techniques. High spectral resolution satellite image (WorldView-2) and a multispectral orthophoto, obtained from data acquired by an unmanned aerial vehicle, were used. Objects and pixel algorithms were applied and the results were compared by a statistical test. Using the same bands, the findings show that both data are suitable for monitoring the evolutionary dune status. Specifically, the WorldView-2 pixel-based classification and UAV object-based classification provide the same accurate results.
1.INTRODUCTION
The coastal dunes are the dynamic and vital transition zones between the sandy shorelines and the continental environment, characterized by high geological and ecological values. In proportion to their size, their continuity, and to their geomorphological conditions, the dunes play different physical and ecological-naturalistic functions (Martínez et al., 2008): 1) Within the coast’s dynamic equilibrium, the dunes represent
a resilience factor, which gives the system a greater ability to restore balance lost due to disturbances. These sand reserves allow natural sediment exchanges without a pronounced erosion of the coast (Giambastiani et al., 2017).
2) They play an important hydrogeological function, hosting fresh groundwater lenses with piezometric levels above sea level. These lenses limit soil and groundwater salinization due to natural and anthropic causes (Cozzolino et al., 2017). 3) Due to their elevated morphology above the surrounding
territory, dunes are the only natural defense from seawater during storm surges. This effect is more relevant in areas that are highly vulnerable to natural and/or anthropic subsidence. (Roelvink et al., 2009).
4) The dunes protect the inland areas from marine spray and sand from the sea, preventing phenomena of vegetation decay that can affect large areas (Tengberg, 1995).
5) Lastly, coastal dunes represent a unique habitat for specialized plant communities and many animal classes
* Corresponding author
(mammals, reptiles and birds), (Acosta et al., 2009).
However, in spite of their environmental roles, the dune systems, over the last half century, have been reduced or demolished by uncontrolled urbanization and mass tourism. The resorts built on the beach interfere with the morpho-dynamic processes of the dune, preventing their development and causing uncontrolled erosion (Sytnik and Stecchi, 2015).Therefore, an accurate monitoring of dune evolution is needed. Today, there are different tools and techniques available for the environmental monitoring of dune systems: botanic and topographic field surveys (Lu et al., 2012), aerial and satellite image analysis (Hugenholtz et al., 2012), Terrestrial Laser Scanning surveys (Mancini et al., 2013), aerial Laser Scanning acquisition (Stockdon et al., 2009), ground DGPS (Differential Global Positioning System) measurements (Navarro et al., 2011).
Every evolutionary stage of the sand dune is also correlated to its vegetation cover (Provoost, et al., 2011). The vegetation makes dunes less susceptible to erosive processes (Munson et al., 2011). These delicate systems can be classified as mobile or fixed according to the presence of vegetation. Precisely, sand
dunes are classified as “free of vegetation and active”, or as “partly vegetated and active”, and “totally vegetated and fixed”
(Tsoar, 2005). The reciprocal interaction between the dunes and their vegetation influences the geomorphological development of the coast (Miller et al. 2010).
2013), were compared with orthophotos obtained from multispectral frames acquired by an unmanned aerial vehicle (UAV). Several studies report the use of aerial or satellite images and data provided by UAV platforms in order to: compare their elaboration results (Matese et al., 2015), integrate the different information extracted (Solazzo, 2016), combine two kinds of data for a multiscale analysis (Duro et al., 2015) and to classify the natural or agricultural coverage (Gini et al., 2017). Within the proposed work, a WorldView-2 (WV-2) image and a UAV orthophoto, built using several photograms acquired by Tetracam ADC Micro, were elaborated through pixel and object-based algorithms. The main aim is to verify the best combination between data and methodology in order to classify dune vegetation, extending the knowledge about potentiality and limits of these two classification techniques, using different high-resolution data with various costs and availability. Finally, the obtained vegetation maps could be a valid support for the coastal protection plans.
2. STUDY AREA
Figure 1. Casal Borsetti dune (Ravenna, Italy)
The selected study area (Fig. 1) is the coastal dune of Casal Borsetti (Ravenna, Italy). The whole site lies in an area where both natural and anthropic subsidence caused an intensification of all the risks arising from the interaction between coast and marine environment (Giambastiani et al., 2017).
The N-S length of the dune is almost 300 m, while the maximum W-E width is about 60 m. The maximum altitude is 5.5 m a.s.l.
The dune is included in the Natura 2000 Network, and named "Pinewood Casalborsetti, Pineta Staggioni, Duna di Porto Corsini" IT4070005. Moreover, the area falls within the Po Delta Regional Park, classified as SCI (Site of Community Interest) and SPA (Special Protection Area). Artificial rocky barriers parallel to the shore are present in front of the dune and a transverse jetty is located at the south. All of them aim to protect the beach and the dune from marine erosion.
Many authors described the typical vegetation cover for the North-Adriatic coastal dunes (Sburlino et al. 2013; Merloni et al., 2015). Based on the Directive 92/43/EEC "Habitat", moving from the sea inland, the theoretical vegetation belts are: 1210: Annual vegetation of drift lines (following AP, i.e.
annual pioneer species).
2110: Embryonic shifting dunes (following ED, i.e. embryo dune vegetation).
2120: Shifting dunes along the shoreline with Ammophila arenaria (following WD, i.e. white dune), where the dunes become more stable.
2230: Malcomietalia dune grasslands.
2130: Fixed coastal dunes with herbaceous vegetation (following GD, i.e. grey dune).
2250: Coastal dunes with Juniperus spp. (following B, i.e. brush).
2270: Wooded dunes with Pinus pinea and/or Pinus pinaster (following P, i.e. pinewood).
However, the vegetation distribution on the Casal Borsetti dune is more complex and confused compared to the aforementioned description. During the UAV flight, a contemporary botanic survey was carried out for ground truth data collection and reported the following situation:
1) The area colonized by pioneer and embryonic community is systematically swept during the mechanical beach cleaning operations that occurs before and during the tourist season, in order to remove waste carried by storms. The consequence is the drastic reduction of the pioneer and embryonic community distribution and the presence of embryonic plants in areas generally occupied either by Ammophila arenaria or even further inland, confining often directly with the GD.
2) The Ammophila arenaria is generally absent and, where present, is grouped in small clusters without spatial continuity. The GD and ED are often adjacent or mixed, occupying ranges that are not typically associated to these habitats. As a result, the areas identified as a WD are very poor and discontinuous. 3) The Malcolmietalia grassland is widespread in various areas of the dune, from the ED to the GD. This condition is probably due to the scarcity of Ammophila arenaria and due to the footpaths that cause erosion areas without vegetation (Semeoshenkova et al., 2016), in correspondence to the accesses to the beach. In some cases footpaths cause the formation of furrows, called blowouts, where the wind increases sand transportation and dune erosion. Part of the sediment eroded in a blowout is moved inland causing an advancement in the opposite direction (Giambastiani et al., 2017).
4) Considering that there are no typical plant communities of the interdunal lowlands, the grey dune is adjacent to retrodunal woods.
3. METHODS
The description of data used is reported in Table 1.
Data WorldView-2 UAV
Orthophoto
Spatial resolution 2 m
(multispectral) 5 cm
Spectral resolution 8 bands (Visible-NIR)
3 bands (Red-Green-NIR) Time of acquisition 05/29/2011 10/09/2014
Altitude 770 km 80 m
3.1 WorldView-2 data
Concerning the WorldView-2 orthoimage, atmospheric correction and georeferencing were applied before the classification algorithms. ENVI image processing software (version 5.1) was used. The first pre-elaboration reduced the atmospheric interference differences due to dissimilar revisiting geometry and time acquisition (Tab. 1). The radiative transfer model FLAASH (Fast Line-of-sight Atmospheric Analysis of Spectral Hypercubes) was applied. It is an implementation of MODTRAN4.
Since the UAV orthoimage was georeferenced according to the Italian national cartography ETRF2000 UTM-33N, the original WV-2 reference system, WGS84 UTM-33N, was thus converted in the same system to make the classifications results comparable. In addition, the WV-2 data was not well geo-referenced because there were no easily recognizable and stable points within the study area. Therefore, in order to compare the WV-2 image to the UAV orthophoto their co-registration was necessary.
3.2 UAV orthophoto
A total number of 82 frames were acquired by the commercial multispectral camera Tetracam ADC Micro, installed on the hexacopter ESAFLY A2500_WH (SAL engineering, Italy). The GSD (Ground Sample Distance) was set equal to 3 cm and the overlap between images (both axial and lateral) was fixed to 75%. 4 Ground Control Points (GCPs) were placed on the study area and their coordinates were measured by a geodetic-dual frequency GNSS receiver in rapid-static mode. Io order to locate the GCPs in the ETRF2000 system, the EUREF (European Reference) permanent station of Porto Garibaldi (Ferrara, Italy) and the IGS (International GNSS Service) permanent station of Medicina (Bologna, Italy), were used. Thus, the coordinates were projected to UTM 33N.
The ADC Micro has a single sensor Aptina CMOS (6.55 mm × 4.92 mm, pixel size of 3.12 micron) shielded by a Bayern filter. However, since the camera has an optical low-pass filter that stops blue band, it acquires in the green (G), red (R), and NIR bands. Due to the Bayer filter, each pixel corresponds to only one of these bands and the images are initially single matrices of Digital Numbers (DN) stored in RAW format. Therefore, it is necessary to reconstruct the two missing bands for all pixels, interpolating the observed values of the adjacent pixels. The camera software, PixelWrench2 (PW2), was used and, for each frame, a tri-band TIFF file was exported.
In order to take into account the actual condition of exposure, PW2 was calibrated using its Teflon tag, acquired under the same lighting conditions of the frames. Since this procedure does not convert the sensor output to reflectance (Candiago et al., 2015), the subsequent analysis was based on the DN values. The TIFF frames were employed as the input for the photogrammetric pipeline based on a Structure from Motion algorithm (Ullman, 1979), implemented in Agisoft Photoscan. The output was a three-dimensional model of the scene from which orthophoto and DSM were extracted. In the first step, the approximate positions and orientations of the camera were determined for each frame and a sparse point cloud model was created. Subsequently, the model was geo-referenced collimating the GCPs centroid and inserting their coordinates. At this stage, the software operates a 7-parameter similarity transformation and the optimization phase (self-calibrating bundle adjustment) using the GCPs coordinates (Mancini et al., 2013). This step ensures a correct scaling, through the external orientation parameters of the frames, and the geo-location, improving the reliability of the camera interior parameters (focal length, principal point, lens distortion parameters). Then,
a dense point cloud was built and a polygonal mesh was generated. Finally, the Digital Surface Model (DSM) and the orthoimage were extracted with a resolution of 5 cm. The orthoimage preserves the G, R, and NIR bands that were used in the subsequent vegetation analysis.
3.3 Data Analysis
Once the two data were co-registered, the same area including the Casal Borsetti dune was resized over both images using a mask tool.
Subsequently, supervised classification techniques, pixel-based and object-based, were applied using the same bands (G, R, NIR) for both data. Therefore, an outlining of the training site was required. However, the discrimination of the single habitat samples has been very difficult because many species are similar to each other and they are mixed within different habitats. This situation made the allocation of dune portions to a specific class complicated, especially where there are disturbing factors that modify the development of the natural habitat. Based on the study area description, some dune habitats were grouped within classes that continue to represent the evolutionary state and the stability of the dune. In particular, the ED and AP were merged into a single class due to: the lack of vegetation cover, mutual interpenetration and their similar correlation to the dune’s stability.
It was not possible to consider the WD because the Ammophila arenaria, the unique feature able to discriminate the WD from the ED, consists of isolated and small groups and not by a continuous formations. Moreover, the Ammophila arenaria is very similar to Agropyron, which instead identifies the ED. Also, the Malcolmietalia grasslands, although widespread on the dune, were not identified by a different class because they are not easily discoverable, since they are mixed with different habitats.
Instead, the DG, mainly covered by mosses, is a relatively homogeneous and distinguishable formation. Lastly, the other two classes recognizable on the scene are the pine forest and the nude sand.
In order to understand how many classes it was possible to discriminate, the ISODATA and NDVI were applied. Therefore, based on all previous considerations, the classes considered for the next elaboration phases were:
Pinewood and Brush vegetation (PAB) Grey dune vegetation (GD)
Annual Pioneer and Embryo dune vegetation (APED) Sand (SAND)
Concerning the pixel-based method, the Maximum Likelihood algorithm was applied, because it provided the most accurate results among all the tested algorithms. Both WV-2 and UAV Orthophoto were processed by ENVI software.
Instead, the object-based classification was conducted using the software eCognition. For the WV-2 image the segmentation parameters were: equal weight to the spectrum layers (NIR, red, green) and the DSM, no weight for the NDVI layer, Scale parameter equal to 50, Shape equal to 0.4, and Compactness equal to 0.5. For the three-band UAV orthophoto the parameters were: equal weight to the spectrum layers (NIR, red, green) and the DSM, no weight for the NDVI layer, Scale equal to 7, Shape equal to 0.6, and Compactness equal to 0.6. The Nearest Neighbour algorithm was applied in the subsequent classification.
Based on the segmentation obtained, for the WV-2 data different training sites were chosen comparing previous cases, even if they were located within the same zones.
separability, was selected through the “Features space
optimization” tool. The features used were: the mean and the standard deviation, calculated for each input layers; the
“Brightness” and the “Max. Diff.”, which are related to the
intensity of the original spectral layers (G, R, and NIR); the 10th percentile and the median of the NDVI and DSM layers (DSM only for the UAV data); the minimum and the maximum pixel value of the NDVI; the “contrast to neighbour pixel” for the NDVI.
To validate the obtained maps, the typical tools of classification theory were used, i.e. the confusion matrix, global accuracy and K coefficient (Rossiter, 2004). Also the K-Conditional coefficients were calculated to understand the accuracy of each single class.
These accuracy parameters were computed based on the ground truth acquired by an NRTK survey along some transects perpendicular to the coastline, where the variability among the continuous habitats is at a maximum.
Finally, the comparison between the classifications applied on the two remote sensed data was carried out checking which product had the lowest error rate on the map, i.e. through the K values. Thus, once established the null hypothesis that the expected K values of the two statistics (1=Pixel, 2=Object-oriented) were the same and that the K1 e K2 were independent, Z-test was applied (Donner et al., 2004):
In order to calculate the needed variance values ( 1, 2), associated to K and K-Conditional coefficients, a Fortran program was implemented using the formula proposed by Rossiter, 2004.
Considering a significance level α=0.01, and consequently the
confidence limit =2.6, the hypothesis was accepted when |z| ≤ .
2. RESULTS AND DISCUSSION
2.1 Pixel-based classification
The WV-2 pixel classification (Fig. 2a) shows that the four considered vegetation classes are distributed along strips parallel to the coastline. From a qualitative point of view, the PAB class, were assigned to APED class, specifically along its east boundary. In fact, this slim strip corresponds to a footpath caused by continuous human passage.
73% of the GD pixels are correctly classified while the 23% of its omitted pixels are assigned to APED. The APED class shows an agreement of 83% compared to the ground truth and most of its omitted pixels are assigned to SAND. Simultaneously, 13% of SAND pixels are associated to APED, even if the entire class is successfully classified (87%). This confusion, caused by the relative similarity between the reference spectral signatures, is also connected to the widespread presence of beach umbrellas close to the sea. They are large enough to influence the spectral signature of the pixels.
The classification errors are more distributed along the boundaries between the various classes. For the SAND class, some noise is present near the APED class limit, probably due to the aforementioned beach umbrellas.
Concerning the UAV orthophoto pixel classification (Fig. 2b), the trend of the bands relating to four classes has been generally identified by the classifier, but it is quite evident that the classification is less uniform compared the WV-2 pixel-based results.
The APED and GD are more confused than SAND and PAB classes. The APED pattern is not always recognizable. These findings are consistent with the greater intrinsic heterogeneity and lower mutual separability of the APED and GD classes. In order to better understand the results, the analysis of the relationship between the orthophoto pixel size and the various components of the individual classes is needed. Different elements are included within the chosen covers, especially APED and GD. At the same time, the ground pixel size is so small that often it includes a single species of a vegetation class and its spectral signature cannot take into account the other components of the same category. In addition, single element of a vegetation class can belong to different classes. For example, a significant part of the APED class, formed by the union of two habitats with little vegetation cover, is constituted by sand, but the sand is the main element of the SAND category. It is clear that an APED pixel, which corresponds to only sand on the ground, is probably assigned to the SAND class.
Summarizing, given that the observation scale to define the classes is larger than the pixel scale, the pixels may not be representative of the entire class, especially when it is heterogeneous. On the contrary, a larger pixel size that can include different elements, such as the WV-2 cells, allows for a classification that is less influenced by the individual objects that belong to various heterogeneous classes. In fact, for the orthophoto pixel-based classification, the overall accuracy and the k coefficient decrease to 70% and to 0.60 respectively (Tab. 2b). The PAB is almost perfectly classified and the few pixels not assigned are mainly attributed to the GD.
In turn, the GD is mostly confused with the PAB class, to which it loses 30% of its pixels. The reason is that both classes are the only ones totally covered by vegetation. Moreover, although the GD vegetation is completely different from the forest, the GD class also includes some small shrubs with a spectral behavior similar to the PAB vegetation. The remaining GD omitted pixels are almost all assigned to APED (14%). The absence of vegetation within the SAND class compared to GD cover explains the excellent separability of spectral responses. The APED class recognition is less accurate compared to other classes, probably because it is the most heterogeneous category, since it includes both sand and vegetation. Its omitted pixels are mainly assigned to GD (20%), while about 8% to PAB and another 28% to SAND. The confusion between APED and PAB is due to some types of plant species, present on the APED class, having a spectral signature similar to that of the forest behind the dunes.
A similar reason generates the errors detected between APED and GD, which also include some common plant species. Instead, the SAND class is almost totally recognized (90%) and the remaining pixels, incorrectly assigned to APED, correspond to particularly low and sparse vegetation cover.
Considering the overall accuracies, the K coefficient values and the K-Conditional coefficients (Tab. 3), the results obtained from the WV-2 are more reliable for the pixel-based classification.
Figure 2. Pixel-based classification of Casal Borsetti dune vegetation: Worldview-2 data (a) and UAV Orthophoto (b).
Table 2. Confusion matrix concerning the pixel-based classification: Worldview-2 data (a) and UAV Orthophoto (b).
highest concentration of wrongly classified pixels is located along class boundaries.
The comparison between the K coefficients of the WV-2 and orthophoto pixel-based classifications, conducted by the Z-test, suggests that the equality hypothesis between two results is rejected.
In fact, the |Z| value (10.1) exceeded the limit =2.6 corresponding to the significance level of α=0.01 conservatively assumed for the test (Tab. 3). This difference is primarily due to the different spatial resolution of the two original data. The spatial overlap between the two classification maps highlights that the mismatch is more widespread on the APED zone. As shown by K-Conditional coefficients (Tab. 3), this class is less recognized on the UAV
Table 3. Pixel: K-Conditional coefficients and Z-test results
data, but discreetly classified in the WV-2 data. Only the PAB and SAND classes can be considered as equally classified by the two algorithms.
a) Confusion Matrix WV-2 (Pixel Classification) Ground Truth (Pixels) Class PAB GD APED SAND Total
Unclass. 0 0 0 0 0
PAB 244 9 0 0 253
GD 4 215 12 0 231
APED 20 68 233 31 352
SAND 0 1 34 208 243
Total 268 293 279 239 1079
Overall Accuracy=83.41%; K Coefficient=0.78
b) Confusion Matrix UAV Ortho (Pixel Classification) Ground Truth (Pixels)
Class PAB GD APED SAND Total
Unclass. 127 7 0 362 496
PAB 384363 136542 35152 82 556139
GD 28293 248334 85158 7 361792
APED 3072 63862 197397 35716 300047 SAND 18 1161 120703 352922 474804 Total 415873 449906 438410 389089 1693278
Overall Accuracy=69.86%; Kappa Coefficient=0.60
K-Conditional coefficient (Pixel-based Classification)
Class WV-2 UAV Ortho Z Value (τ= 2.6)
PAB 0.88 0.89 -0.2
GD 0.66 0.43 7.7
APED 0.76 0.33 13.5
SAND 0.83 0.87 -1.5
K-coefficient 0.78 0.60 -10.1
2.2 Object-based classification
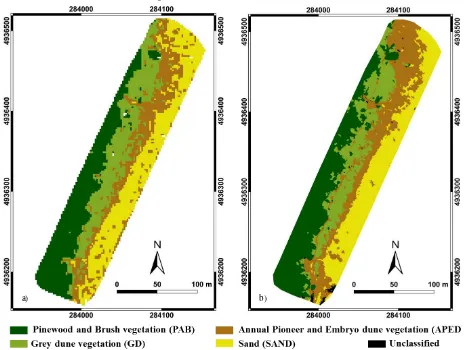
Compared to the pixel-based classification, the main difference with the WV-2 object-based classification (Fig. 3a) concerns the APED class. Several pixels are assigned to GD and SAND classes. Moreover, the previous APED pixel line located along the PAB boundary disappears.
The overall accuracy is equal to 81% and the k coefficient is almost 0.75 (Tab. 4a). The PAB is still the best ranked category, with an almost total agreement (94%) between pixels attributed to the class and those included in the sample. The GD has an accuracy of 84%, with the remaining pixels which are divided similarly between PAB and APED classes. Concerning the APED class only 60% of the total pixels are recognized correctly, while 28% are assigned to SAND, and the remaining 11% are mistakenly assigned to GD. The APED category is mainly affected by omission errors.
Finally, SAND accuracy is equal to 85% and the majority of the omission errors are assigned to the APED class. As already reported for the WV-2 pixel-based classification, this disorder is due to the presence of beach umbrellas.
The distribution of classification errors is very similar to that obtained for WV-2 pixel-based classification. The reason is that the objects created by the segmentation do not include enough pixels and the results do not appreciably change compared to the pixel-based classification. Instead, for the UAV orthophoto, the segmented objects include numerous high spatial resolution pixels, improving the results of the classification (Fig. 3b). Compared to the UAV pixel classification, the classes are much more uniform and the errors are referred to objects and not to a
widespread multitude of misclassified pixels. In addition, in this case, the trend of the four categories is clearer, with the greater confusion zones located along the transition areas from one class to another.
The northern part of the dune, assigned to the APED class, largely belongs to SAND cover. Here, the activity of some blowouts moved sand inland close to forest. This error is probably from an orthophoto reconstruction problem in that zone. In fact, the same area also appears particularly confused with the pixel method.
In general, the quality of the orthophoto classification is improved compared to the pixel approach, as confirmed by the overall accuracy that is increased by 21% and by the k coefficient of almost 32% (Tab. 4b). The PAB remains the best discriminated class with an accuracy of 96%, as confirmed by table 5. 72% of the total GD pixels are correctly recognized and the other pixels are confused especially with PAB (9%) and APED (19%). These last omission errors are partly linked to the eroded zones within the GD, located along the footpaths and the accesses to the beach.
Concerning the APED class, the agreement between the classification and the ground truth transect map is 77%. The fraction of incorrectly classified pixels is mainly attributed to the SAND class, due to the presence of areas with extremely reduced plant cover. The SAND category is almost totally classified correctly (94%), giving a few pixels to APED class only.
However, the erroneous attribution from APED to SAND is more accentuated than the opposite.
Figure 3. Object-based classification of Casal Borsetti dune vegetation: Worldview-2 data (a) and UAV Orthophoto (b).
b) Confusion Matrix UAV Ortho (Object Classification) Ground Truth (Pixels)
Class PAB GD APED SAND Total
Unclass. 127 7 0 362 496
PAB 397764 42779 3741 0 444284
GD 16259 321273 36468 0 374000
APED 1723 84536 338114 21326 445699
SAND 0 0 58710 367356 426066
Total 415873 448595 437033 389044 1690545
Overall Accuracy=84.26%; Kappa Coefficient=0.79
Table 4. Confusion matrix concerning the object-based classification: Worldview-2 data (a) and UAV Orthophoto (b).
From the spatial error distribution point of view, the zones affected by error are modest compared to the overall study area and to the pixel classification of UAV orthophoto. As already mentioned above, the errors focus for the vast majority on the boundaries between the classes.
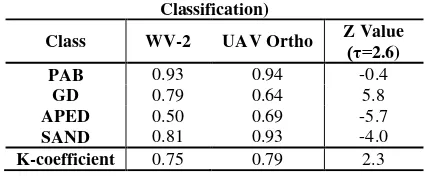
The comparison between the K coefficients of the WV-2 and orthophoto object-based classifications, conducted by the Z-test, suggests that the equality hypothesis is accepted (Tab. 5). In fact, the Z value, equal to 2.3, does not exceed the limit corresponding to the assumed significance level. However, the analysis of K-Conditional coefficients (Tab. 5) shows that only PAB class was classified the same way by two algorithms, while the other Z test results are slightly higher than the limit. The differences between the GD and APED classifications are mainly due to the discrimination of footpaths in the UAV Orthophoto only, where they are associated to APED cover. Instead, within the WV-2 map, the GD class is more homogeneous and compact because these elements were not recognized.
Considering the overall accuracies, the K coefficients and the K-Conditional coefficients, the results obtained from the UAV orthophoto are more reliable for the object-based classification.
Table 5. Object: K-Conditional coefficients and Z-test results
Finally, the similarity between UAV orthophoto object-based classification and the WV-2 pixel-based classification is rather remarkable.The most evident differences are:
(i) the northern beach area mistakenly not assigned to SAND in the orthophoto, is well recognized in the WV-2.
(ii) the most confusion in the SAND class found in the WV-2 pixel classification, partially due to the presence of umbrellas. The comparison, conducted by the Z-test, between the K coefficients and the K-Conditional coefficients object-based classifications, excludes the SAND class, confirms the equality hypothesis among the two classification (Tab. 6).
CONCLUSIONS
The main aim of this study was to find the best combination between remote sensing data and classification techniques to
Table 6. K-Comparison between the WV-2 pixel classification and the UAV orthophoto object classifications
automatically classify the dune vegetation. The results obtained by applying pixel and object-based methods to the WorldView-2 image and the orthophoto generated by UAV frames, showed that both data are potentially usable to classify dune vegetation at the selected levels.
Concerning the UAV orthophoto, the object-oriented approach provided a better classification compared to the pixel classification. The last result was not entirely reliable due to the fact that a single pixel may not fully represent the class heterogeneity. The WV-2 image did not have this problem since its pixel size can include all the elements of the single classes. Indeed, the pixel-based classification is very good and comparable to object based method results.
The statistical comparison between the two best approaches, i.e. the UAV orthophoto object-oriented classification and the WV-2 pixel-based classification, showed that they are equivalent. Thus, they can be integrated and used to develop conservation strategies for the dunes, the last natural defence systems that protects inland areas from increasingly frequent swings due to climate change. If the remote sensing surveys are repeated in time, the obtained vegetation maps can also represent a valid support to analyse the evolutionary state of coastal dunes. The methods, tested on the Casal Borsetti dune, are exportable in similar coastal environments and it is repeatable over time. The present study is the first step of a project that aims to monitor the coastal dune system through three-dimensional vegetation maps. Currently, our research also involves the use of other advantages of two data, namely the 8 bands available for WV-2 image and the Digital Surface Model provided by UAV frame elaboration.
REFERENCES
Acosta, A., Carranza, M. L., & Izzi, C. F. 2009. Are there habitats that contribute best to plant species diversity in coastal dunes? Biodiversity and Conservation, 18(4), 1087.
Candiago, S., Remondino, F., De Giglio, M., Dubbini, M., & Gattelli, M. 2015. Evaluating multispectral images and a) Confusion Matrix WV-2 (Object Classification)
Ground Truth (Pixels) Class PAB GD APED SAND Total
Unclass. 3 0 0 3 6
PAB 253 18 0 0 271
GD 13 249 32 0 294
APED 0 26 170 34 230
SAND 0 0 77 205 282
Total 269 293 279 242 1083
Overall Accuracy=80.98%; K Coefficient=0.75
K-Conditional coefficient (Object-based Classification)
Class WV-2 UAV Ortho Z Value (τ= 2.6)
PAB 0.93 0.94 -0.4
GD 0.79 0.64 5.8
APED 0.50 0.69 -5.7
SAND 0.81 0.93 -4.0
K-coefficient 0.75 0.79 2.3
K-Conditional coefficient (Object-based Classification)
Class WV-2 UAV Ortho Z Value (τ= 2.6)
PAB 0.93 0.94 -0.4
GD 0.79 0.64 5.8
APED 0.50 0.69 -5.7
SAND 0.81 0.93 -4.0
vegetation indices for precision farming applications from UAV images. Remote Sensing 7(4), 4026-4047
Cozzolino D., Greggio N., Antonellini M., & Giambastiani B.M.S.. 2017 Natural and anthropogenic factors affecting freshwater lenses in coastal dunes of the Adriatic Coast. Journal of Hydrology.
Donner, A., Shoukri, M. M., Klar, N., & Bartfay, E. 2000. Testing the equality of two dependent kappa statistics. Statistics in Medicine, 19(3), 373-387.
Durán, O., & Moore, L. J. 2013. Vegetation controls on the maximum size of coastal dunes. Proceedings of the National Academy of Sciences, 110(43), 17217-17222.
Duro, N., Martins, R., Gonçalves, G., & da Silva, A. A. 2015. Collaborative and flexible processing infrastructure for Coastal Monitoring. In Experiment@ International Conference (exp. at'15), 2015 3rd (pp. 47-51). IEEE.
Giambastiani, B., Colombani, N., Greggio, N., Antonellini, M., & Mastrocicco, M. 2017. Coastal aquifer response to extreme storm events in Emilia‐Romagna, Italy. Hydrological Processes. DOI: 10.1002/hyp.11130
Gini, R., Passoni, D., Pinto, L., & Sona, G. 2014. Use of Unmanned Aerial Systems for multispectral survey and tree classification: a test in a park area of northern Italy. European Journal of Remote Sensing, 47(1), 251-269.
Hugenholtz, C. H., Levin, N., Barchyn, T. E., & Baddock, M. C. 2012. Remote sensing and spatial analysis of aeolian sand dunes: A review and outlook. Earth-Science Reviews, 111(3), 319-334.
Lu, H., Zhou, Y., Liu, W., & Mason, J. 2012. Organic stable carbon isotopic composition reveals late Quaternary vegetation changes in the dune fields of northern China. Quaternary Research, 77(3), 433-444.
Mancini, F., Dubbini, M., Gattelli, M., Stecchi, F., Fabbri, S., & Gabbianelli, G. 2013. Using unmanned aerial vehicles (UAV) for high-resolution reconstruction of topography: the structure from motion approach on coastal environments. Remote Sensing, 5(12), 6880-6898.
Martínez, M. L., Psuty, N. P., & Lubke, R. A. 2008. A perspective on coastal dunes. In Coastal Dunes, Springer Berlin Heidelberg, pp. 3-10.
Matese, A., Toscano, P., Di Gennaro, S. F., Genesio, L., Vaccari, F. P., Primicerio, J., ... & Gioli, B. 2015. Intercomparison of UAV, aircraft and satellite remote sensing platforms for precision viticulture. Remote Sensing, 7(3), 2971-2990.
Merloni N., Rigoni P., Zanni F., 2015 - La vegetazione delle dune litoranee nella Riserva Naturale di Foce Bevano. In: Nobili G. (ed.), 2015. Spiagge e dune dell’Alto Adriatico. Corpo Forestale dello Stato - Ufficio territoriale per la Biodiversità, Punta Marina Terme - Ravenna. 79-98.
Miller, T. E., Gornish, E. S., & Buckley, H. L. 2010. Climate and coastal dune vegetation: disturbance, recovery, and succession. Plant ecology, 206(1): 97-104.
Munson, S. M., Belnap, J., & Okin, G. S. 2011. Responses of wind erosion to climate-induced vegetation changes on the Colorado Plateau. Proceedings of the National Academy of Sciences, 108(10), 3854-3859.
Navarro, M., Muñoz-Pérez, J. J., Román-Sierra, J., Tsoar, H., Rodríguez, I., & Gómez-Pina, G. 2011. Assessment of highly active dune mobility in the medium, short and very short term. Geomorphology, 129(1), 14-28.
Provoost, S., Jones, M. L. M., & Edmondson, S. E. 2011. Changes in landscape and vegetation of coastal dunes in northwest Europe: a review. Journal of Coastal Conservation, 15(1), 207-226.
Roelvink, D., Reniers, A., Van Dongeren, A. P., de Vries, J. V. T., McCall, R., & Lescinski, J. 2009. Modelling storm impacts on beaches, dunes and barrier islands. Coastal engineering, 56(11), 1133-1152.
Rossiter, D. G. 2004. Technical Note: Statistical methods for accuracy assesment of classified thematic maps. Enschede (NL): International Institute for Geo-information Science & Earth Observation (ITC) URL http://www. itc. nl/personal/rossiter/teach/R/R_ac. pdf, 25(92), 107.
Sburlino G., Buffa G., Filesi L., Gamper U., Ghirelli L. 2013. Phytocoenotic diversity of the N-Adriatic coastal sand dunes - The herbaceous communities of the fixed dunes and the vegetation of the interdunal wetlands. Plant Sociology 50 (2): 57-77.
Semeoshenkova, V., Newton, A., Contin, A., & Greggio, N. 2016. Development and application of an Integrated Beach Quality Index (BQI). Ocean & Coastal Management.
Solazzo, D. 2016. Mapping and measuring sand dunes on the Paria Plateau, Arizona with unmanned aerial vehicles and high to moderate resolution satellite images (Doctoral dissertation, Northern Arizona University).
Stockdon, H. F., Doran, K. S., & Sallenger Jr, A. H. 2009. Extraction of lidar-based dune-crest elevations for use in examining the vulnerability of beaches to inundation during hurricanes. Journal of Coastal Research, 59-65.
Sytnik, O., & Stecchi, F. 2015. Disappearing coastal dunes: tourism development and future challenges, a case-study from Ravenna, Italy. Journal of coastal conservation, 19(5), 715-727.
Tengberg, A. 1995. Nebkha dunes as indicators of wind erosion and land degradation in the Sahel zone of Burkina Faso. Journal of Arid Environments, 30(3), 265-282.
Tsoar, H. 2005. Sand dunes mobility and stability in relation to climate. Physica A: Statistical Mechanics and its Applications, 357(1), 50-56.