56
ANALYSIS OF THE EXPORT-BASE COMMODITY SUPPLY ON THE
ECONOMIC GROWTH IN ACEH, INDONESIA
Yahya* , Abubakar Hamzah1 , Mohd Nur Syechalad1 dan Sofyan Syahnur1 * Ph.D Scholar, Graduate School, Syiah Kuala University, Banda Aceh-Indonesia 1 Lecturer, Faculty of Economics, Syiah Kuala University, Darussalam, Banda Aceh-Indonesia
Abstract: The study aims to identify export base sectors and to analyse its impact to the economic growth based on the Cobb Douglas production function. Some relevant theories to support our arguments among others are base sector, export base and economic growth theory. Data of central government capital spending (CGB), local government capital spending (LGB), export average price (Pavg), provincial minimum wage (W) and linear multiple regression model is employed. The results show that the agriculture is the only basis sector in Aceh. The role of local government capital spending in the export based commodity supply contradicts the theory, provided indication that the local government capital spending has not been able to pull the economic growth. The role of central government capital spending, export average price and minimum wage have been in accordance with the available theoretical background. All independent variables are found to be statistically significant both partially and simultaneously, indicating that those variables are economically important to develop export base sectors in Aceh, however the impact on economic growth is relatively small.
Keywords: export base sector, supply for export, economic growth, Aceh
Introduction
The purpose of economic development is the realization of people's welfare through economic growth. Economic growth occurs from the activities of consumption, investment, government spending and exports-imports (net exports). This study identifies the sector's export base and analyzes the role of the sector supply for economic growth in Aceh. Mercantilism thoughts (1760) stated economies will be going forward if export exists. Export activity occurs when the economies have excess production of net domestic consumption and traded. Excess production is achieved from the optimal use of production factors through absolute and competitive advantage. Specifically, it is achieved through optimizing the potential economic sectors into export base sector generating cash inflows /exchange (Bendavid-Val, 2000). In 2015, there is a momentum of economic openness within the ASEAN, namely the implementation of the ASEAN Economic Community (AEC). Indonesia and Aceh province should be able to seize the opportunity by obtaining foreign exchanges from export activities, particularly competitive non-oil commodities. The theory of economic base sectors (economic base theory) states that the rate of economic growth of a region is determined by exports. Economic activity includes base and non-base sector and the base sector is the only mean to encourage economic growth through trade activities exogenously (see Armstrong and Taylor, 2000; Bennerje and Harris, 2001; Diewert, 2013; Ludwig and Brautzsch, 2013). The more transactions generated from export-base sector, the higher the incoming foreign exchanges yet the higher economic growth (Krikelas, 1992, Harris, 1998; Wang et al, 2014). Therefore, it is necessary to analyze the factors that affect the supply export-base sector. While the non sector-base is the service activities to meet the needs of local consumption, the supply is determined not to exceed the public revenue and economic growth in the region (McNulty, 1977; Cook, 1979).
57
Another opinion is called the modern theory of Eli Hecksher and Bertil Ohlin (1933) on The Proportional Factor Theory. The difference in ownership of the factors of production in both quantity and quality between countries led to differences in production costs. The difference leads a country to trade with other countries.
Salvatore (2004), in regional economic growth model, proposed model of government spending and investment including exogenous variables such as exports, by manipulating the Keynesian national income equation, income of a region can be written as:
Yi = Ci + Ii + Gi + Xi - Mi ; where: Yi = regional income, Ci = regional consumption, Ii = regional investment, Gi = regional government expenditure, Xi = regional exports, and Mi = import. Moreover, growth pole theory views the two sides of the functional and geographic aspects. Functionally, growth pole comes from concentration of business with identical elements of dynamics and such concentration is able to push the economy in and outward all the way to the hinterland. Geographically, the pole is the location that has many economic infrastructures and such richness become a centre of attraction. Growth centre has four characteristics, namely: internal relations, multiplier effects, geographical concentration and encouraging growth outside the pole. The theory is important and many researchers have analyzed it in several countries.
Mahendhiran Nair et al. (2006) analyzed the Chinese economy in terms of exports of manufacturing industry. China's economy is supported by human resources and innovation in industry. This strategy is an opportunity to stimulate the economy in ASEAN countries through trade cooperation. The data was the indicator of the type of goods exports with qualifications up to 3 digits. Spearman's rank correlation coefficient was utilized and the results of the analysis showed that manufacturing sector exports boost economic growth.
Likewise, the role of exports to economic growth is also analyzed in the Balkans (Goran Nikolic, 2013). The structure of exports in 2000-2012 in Balkans which had developed with the changing technology and export into a modern production methods. Exports increased by more than two digits and changed the structure of the economy.
Export role in promoting economic growth is mostly inspired by the classical view prevailing in developed countries and developing countries. In developing countries, the role of exports to economic growth were observed by Heizer and Nowak-Lehman (2006) who conducted a study in Chile, that the horizontal export diversification contributed to the economic growth through a positive externality, a benefit for foreign buyers and creating a competitive market.
While the vertical export diversification, namely exported raw materials industry played a major role in promoting economic growth. Export diversification closely linked with economic growth. Model analysis is the Cobb-Douglas production function, namely: Yf = Ft (Kft, Lft, Wt). Where Yf: economic sector output. Kf and Lf is the capital and labour, Wt is the education index. The time series data from 1962-2001 which analysed by using the cointegration based on the Johansen trace test, multivariate error-correction and OLS. The results of the analysis showed that the horizontal and vertical diversification of exports significantly affected economic growth in Chile.
Indonesia is relatively similar to developed countries and developing countries. The country orients to the classical view on the role of export on the economic growth. In Indonesian, the contribution of exports to economic growth has been studied by Syarif et.al (2011). They analyzed the causal relationship between the fisheries sub-sector exports and economic growth using the Cointegration and error correction model with time series data for the period 1969-2005. The results of the analysis that there was a close relationship between fisheries sub-sector export and economic growth.
58
Government of Aceh, while labour approximated by the average export price (Pavg) and the Minimum Wages of Aceh Province (W). The model Ordinary Least Square (OLS) is adopted in this study.
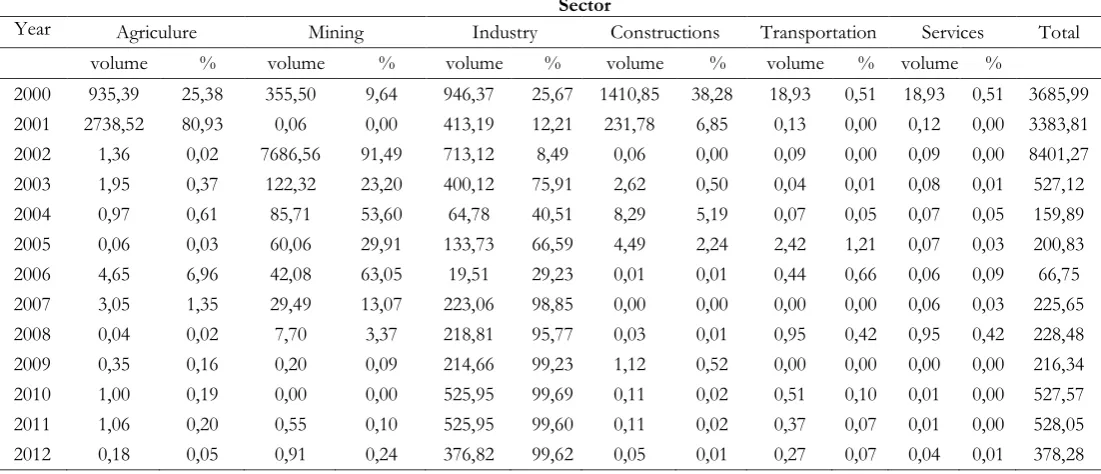
Central Statistics Agency (BPS) of Aceh published data realization of per-sector export volume of non-oil commodities and their contributions (%) in the province of Aceh in 2000-2012 as shown in Table-1. The exports tend to decline for all sectors but industrial sectors. The agricultural sector export volume in 2000 to 2001 increased by 55.55%, but since 2001 the volume of exports experienced a substantial decline for 2002, it decreased by 80.91%. During the period 2002-2012, an increase was occurred only in 2006 by in the amount of 6.93%, but the increase is slightly lower than the average of 8.9%. The same export behavior also occurs in the mining sector during the period of 2000-2006 But after years of 2006-2012 the volume of exports decreased quite large and since the year 2007-2012 and the export volume is always below the average value is 22.36%.
Table 1. Non-oil and gas export volume per sector and its contribution in Aceh Province 2000-2012 (in thousand tons)
Sector
Year Agriculure Mining Industry Constructions Transportation Services Total volume % volume % volume % volume % volume % volume %
2000 935,39 25,38 355,50 9,64 946,37 25,67 1410,85 38,28 18,93 0,51 18,93 0,51 3685,99 2001 2738,52 80,93 0,06 0,00 413,19 12,21 231,78 6,85 0,13 0,00 0,12 0,00 3383,81 2002 1,36 0,02 7686,56 91,49 713,12 8,49 0,06 0,00 0,09 0,00 0,09 0,00 8401,27 2003 1,95 0,37 122,32 23,20 400,12 75,91 2,62 0,50 0,04 0,01 0,08 0,01 527,12 2004 0,97 0,61 85,71 53,60 64,78 40,51 8,29 5,19 0,07 0,05 0,07 0,05 159,89 2005 0,06 0,03 60,06 29,91 133,73 66,59 4,49 2,24 2,42 1,21 0,07 0,03 200,83 2006 4,65 6,96 42,08 63,05 19,51 29,23 0,01 0,01 0,44 0,66 0,06 0,09 66,75 2007 3,05 1,35 29,49 13,07 223,06 98,85 0,00 0,00 0,00 0,00 0,06 0,03 225,65 2008 0,04 0,02 7,70 3,37 218,81 95,77 0,03 0,01 0,95 0,42 0,95 0,42 228,48 2009 0,35 0,16 0,20 0,09 214,66 99,23 1,12 0,52 0,00 0,00 0,00 0,00 216,34 2010 1,00 0,19 0,00 0,00 525,95 99,69 0,11 0,02 0,51 0,10 0,01 0,00 527,57 2011 1,06 0,20 0,55 0,10 525,95 99,60 0,11 0,02 0,37 0,07 0,01 0,00 528,05 2012 0,18 0,05 0,91 0,24 376,82 99,62 0,05 0,01 0,27 0,07 0,04 0,01 378,28 Source: Export-Import Statistics, BPS Aceh (2001-2013)
59
Overall, the decline is due to the non-optimal uses of factors of production, the impact of political and security crisis, the impact of the earthquake and tsunami 2004 as well as the financial crisis in destination countries. From the data, volume of non-oil commodity exports and its per sector contribution seen that the industrial sector contributes a relatively large to Aceh's economy, followed by the mining sector, agriculture, building, transportation and service sectors. Overall, the volume of non-oil commodity per sector exports (in thousands of tons) and contributions (%) in the province of Aceh Year 2000-2012 (in thousands of tons) can be seen in Table 1.
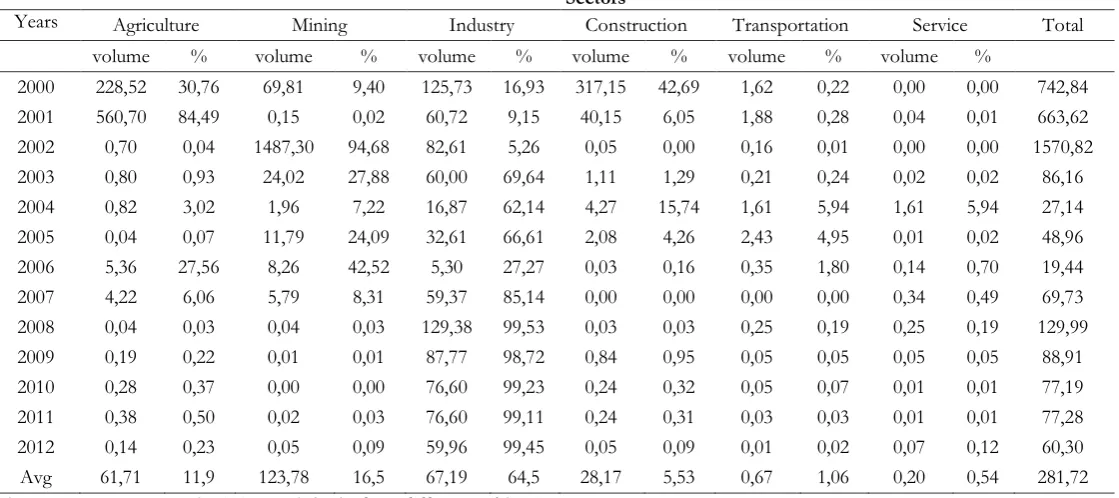
The amount of export volume greatly affected the value of exports. The total value of exports of non-oil commodities (in millions of US$) and their contributions (%) in the province of Aceh in 2000-2012 has decreased, as shown in Table 2. The decrease occurred in agriculture, mining, construction, transportation and services, while the industrial sector experienced a trend increase.
Table 2. Total export value of non oil and gas commodities and its contributions in Aceh in 2000-2012 (Millions US$)
Sectors
Years Agriculture Mining Industry Construction Transportation Service Total volume % volume % volume % volume % volume % volume %
2000 228,52 30,76 69,81 9,40 125,73 16,93 317,15 42,69 1,62 0,22 0,00 0,00 742,84 2001 560,70 84,49 0,15 0,02 60,72 9,15 40,15 6,05 1,88 0,28 0,04 0,01 663,62 2002 0,70 0,04 1487,30 94,68 82,61 5,26 0,05 0,00 0,16 0,01 0,00 0,00 1570,82 2003 0,80 0,93 24,02 27,88 60,00 69,64 1,11 1,29 0,21 0,24 0,02 0,02 86,16 2004 0,82 3,02 1,96 7,22 16,87 62,14 4,27 15,74 1,61 5,94 1,61 5,94 27,14 2005 0,04 0,07 11,79 24,09 32,61 66,61 2,08 4,26 2,43 4,95 0,01 0,02 48,96 2006 5,36 27,56 8,26 42,52 5,30 27,27 0,03 0,16 0,35 1,80 0,14 0,70 19,44 2007 4,22 6,06 5,79 8,31 59,37 85,14 0,00 0,00 0,00 0,00 0,34 0,49 69,73 2008 0,04 0,03 0,04 0,03 129,38 99,53 0,03 0,03 0,25 0,19 0,25 0,19 129,99 2009 0,19 0,22 0,01 0,01 87,77 98,72 0,84 0,95 0,05 0,05 0,05 0,05 88,91 2010 0,28 0,37 0,00 0,00 76,60 99,23 0,24 0,32 0,05 0,07 0,01 0,01 77,19 2011 0,38 0,50 0,02 0,03 76,60 99,11 0,24 0,31 0,03 0,03 0,01 0,01 77,28 2012 0,14 0,23 0,05 0,09 59,96 99,45 0,05 0,09 0,01 0,02 0,07 0,12 60,30 Avg 61,71 11,9 123,78 16,5 67,19 64,5 28,17 5,53 0,67 1,06 0,20 0,54 281,72 Source: Export-Import Statistics, BPS Aceh (from different publications)
The value of exports of agricultural sector increased from 2001 to 2002 i.e. from US$ 228.52 million to US$ 560.70 million, after 2002, during the period from 2002 to 2012 and continued to decline in the value of exports was below average, namely US$ 61, 71 million. The export value of the mining sector since the 2000-2002 fluctuated from US$ 69.81 million 2000 to US $ 1487.30 million in 20002. However, after 2002 has decreased and the value is below the average value amounting to US$ 123.78. There was a shock in the value of the mining sector exports in 2002 which was recorded relatively high, mainly because a lot of production and export demand and also an increase of economic condition in destination countries. In total, the largest export value was in 2002 (US$ 1570.82 million) contributed by the largest mining sector. The value of exports fluctuated in the industrial sector with a lowest value was recorded in 2006 US$ 5.30 million, this was due to the impact of the earthquake and tsunami in Aceh province in 2004.
60
the sectors are stagnant in the political conflict and instability, also contributed by the impact of the earthquake and tsunami and financial crisis in the export destinations countries.
In addition, a decrease in the value of exports was also due to the limited production and low prices. The average of all sectors was larger in the mining sector export value reaching US$ 123.78 million, while the industrial sector only reached US$ 67.19 million. The agricultural sector reached US$ 61.71 million the construction sector amounted to US$ 28.17 million and the transportation sector amounted to US$ 0.67 million and the least average value of exports is the only service sector amounted to US$ 0.20 million.
As explained earlier, that the export performance of both volume and value decreased. The decline in the total value of exports of the province of Aceh affected the rate of economic growth. Based on the BPS data, Aceh’s GDP from 2000 to 2012 was quite volatile. The oil and gas sector was the most volatile, and non-oil sector was relatively stable and growing. Oil GDP growth rate by the year 2000 was - 8.25% increased to 5.20% in 2012, while non-oil was only 0.52% in 2000 and increased to 6.06% in 2012. In line with the above explanation there are some problems regarding the export base of the sector, namely: Which sector is export base and what are the factors that affect the supply sector for export base commodities ? Furthermore, how much influence does the export base sector of the supply side have on the economic growth in Aceh? Thus the purposes of this study are to identify the sector's export base Aceh, the determinants of the sector of export base supply and their effects on economic growth in Aceh.
The of this study is organized as follows section 2 provides an overview of the economy of Aceh. Section 3 highlights the research methods, while the results and discussion are provided in section 4. Finally the conclusions and suggestions are presented in section 5.
General Overview of Aceh Economy
Economic situation in Aceh province by spending is explained by exports (X), household consumption (C) and government consumption (G), while the non-profit private consumption and gross fixed capital formation (I) are relatively small. In 2000-2008, oil commodity exports played dominant role, but after that its role decreased on average of 2.69%. Similarly, non-oil commodity exports in 2000-2002 were quite significant, but after that its role decreased on average of 3.39%. The role of household consumption both with oil and non-oil from years 2000-2012 on average increased by 7.04%, as well as government consumption on average increased by 54.22%. While the changes are relatively small investment, especially during the political instabilities and security, for private companies to reduce investments, thus affecting economic growth.
Thus, there are three components that role significantly to economic growth in Aceh, namely exports, household consumption and government consumption. Among the three components was a great role to economic growth is export, this is in line with the sector's export base theory that only export serve as the only component that is capable of fostering economic growth, while others are non-basis activities. Community and government consumption can harm the community's economy by causing inflation, on the other hand it is useful when coupled with an increase in the productivity of the community and is able to cope with the increase in the money supply. Thus consumption activities can encourage economic growth through multiplier effect.
Aceh's economy lies in the potential of the agricultural sector, particularly crops plantation, such as palm oil, rubber, cocoa, nutmeg and cloves. Aceh province is also rich in oil, gas and mining resources. Aceh's economic performance has not been able to prosper the people who still are on the poverty line, due to a prolonged conflict and tsunami 2004 that led to declining economic performance. Usually, the declining economy can be seen on several economic indicators, such as income per capita, the production of agricultural products of society, export and import.
61
manufacturing, construction and energy sectors (electricity and water). Meanwhile the tertiary sector, namely: trade, hotels and restaurants, transport and communications; finance, leasing, business services and other services sectors.
In the years 2000-2009, the primary sector provided the largest contribution to GDP (47.74%) , however since the year 2010 decreased to 39%. There was a shift in economic structure from the primary to tertiary, while the secondary sector role was relatively small and declining, which means that the industrial sector is underdeveloped. In 2000-2012 the secondary sector performance, with relatively stable, contributed 22.2% to economic growth. In 2000-2012, tertiary sector contributed to an average of 42.33%.
Aceh's economy growth rates in 2003-2009 were showing a period of recession, but it has improved in 2010-2012. At the beginning of the 2000, Aceh's economy contracted due to the instable security and natural disasters. Since 2010-2012, the economy grew significantly, namely 5.2% as a result of the rehabilitation and reconstruction program. GDP with oil and gas in 2011 totalled 34.78 trillion increased from the year 2010 amounted to 2.56 trillion due to increased oil and gas exports. Meanwhile the non-oil GDP in 2011 has increased to 30.80 trillion compared to the year 2010 amounted to 29.1 trillion. The trend of rate of economic growth continued to increase in 2011 is 5.09% and 2012 of 5.20%.
The rate of economic growth in non-oil Aceh in 2000-2009 is almost the same as the oil and gas, but the exception was in 2005-2007, where the economic growth was recorded by 7.7% resulted from post-disaster rehabilitation and reconstruction. During the period, economic activities in the construction sector, trade, restaurant and hotel have increased significantly.
Research Methods
The focus of this research is to identify the export based sectors in Aceh Province and to analyze the factors of production from the supply side as well as their impact to the economic growth in Aceh estimated based on a production function Q = F (K, L), like proposed by Geoffrey (2005). The data covers the supply side: The export volume, export value, the average price of exports, capital expenditure Government of Aceh, capital expenditure of the Central Government, the number of workers in Aceh and Indonesia and the Aceh’s province minimum wage. The data published by the Central Statistics Agency (BPS) Aceh for the period 2000-2012 were used. To identify the sector's export base, the study used the Location Quotien (LQ) workforce based (McCan, 2001), the formulation was as follows:
LQ=
V VI
v vi
/ /
, ………. 3.1
where :
vi = number of workers of a sector at the provincial level, v = number of workers across sectors at the provincial level, VI = Total employment of a sector at the national level and V = Total labour across sectors at the national level. LQ value greater than 1 is a sector basis, LQ less than 1 sector non-basic and LQ is equal to 1 means specialization between provincial and national level is the same.
To analyze the factors that affect the supply sector export base, the study uses the Cobb-Douglas production function, namely:
Q = ∝ �... 3.2
where :
62
Q = A . � ∝ . � ∝ . � ... 3.3
Where:
Q = Sector export base, A = Productivity technology, CGB = Central Government budged, LGB = Local Government Budget, L = Total labour, ∝ and ∝ = share of capital expenditure of the Central Government and the Government of Aceh, = share of labour. The Equation 3.3 above can then be formulated into a linear form are, as follows:
ln = ln� + � lnCGB +� lnLGB+ � ln L + � ………. 3.4
Where:
ln = , ln� = � , lnCGB= CGB, lnLGB= LGB, ln L = L, sector export base of the supply-side (supply side) equation is the following steps:
L = � + � � - � W + � ... 3.5 where:
� = � �� ��
The Equation (3.4) can further be transformed to:
� = � + � + � � + � � + � � − � + � + � ... 3.6
Equation (3.6) can be rewritten in reduced form:
� = ��+ � � + � � + � � − � + ��... 3.7
Where:
QS = Total export sector export base, CGB = Central Government capital expenditure, capital expenditure LGB = GoA, Pavg = price of exports, W = Minimum wage of the Aceh province.
Regression result will be expressed with ̂��, and ̂��, while the economic growth (gs) can be expressed with:
� = + � ̂�� + ��……….. 3.8
Results and Discussions Export Based Sector
63
Table 3. Location Quotient (LQ) Calculation to identify Non-basic sectors in Aceh 2000-2012
No Non-basis sectors Years Results
2000 2004 2008 2012
1 Agriculture 1,265 1,374 1,205 1,287 Basic 2 Mining 0,500 0,540 0,500 0,570 Non-basic 3 Industry 0,300 0,290 0,450 0,320 Non-basic 4 Constructions 0,710 0,850 1,210 1,350 Non-basic 5 Transportations 0,830 0,670 0,920 0,870 Non-basic 6 Services 0,150 0,250 0,430 1,280 Non-basic
Unit Root Test
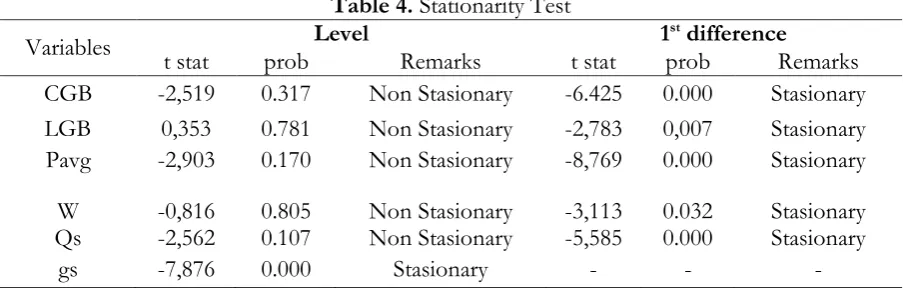
Testing the unit root for time series data is very important because if the observed time series data is non-stationary, the estimation will produce high R-square values and lower Durbin Watson (DW) value or so-called spurious regression. The study conducted t-test based on the Augmented Dickey Fuller (ADF) test as proposed in 1979 (see Jin , 2002). The results are shown in Table 4. The economic growth variable (gs) was found to be stationary at level, while the other variables were stationary at the first different.
Table 4. Stationarity Test
Variables Level 1
st difference
t stat prob Remarks t stat prob Remarks
CGB -2,519 0.317 Non Stasionary -6.425 0.000 Stasionary
LGB 0,353 0.781 Non Stasionary -2,783 0,007 Stasionary
Pavg -2,903 0.170 Non Stasionary -8,769 0.000 Stasionary
W -0,816 0.805 Non Stasionary -3,113 0.032 Stasionary
Qs -2,562 0.107 Non Stasionary -5,585 0.000 Stasionary
gs -7,876 0.000 Stasionary - - -
Furthermore, to meet the interests of the export base sector analysis on economic growth in the province of Aceh, there are several factors that support the export sector basis and can be seen in several indicators of the descriptive statistics, as follows:
Descriptive Statistics
64
Table 5. Descriptive Statistics
Statistics Gs LGB CGB Pavg W QS
Mean 4,760 21.876 19.483 0,160 833.077 15.426.757
Median 1.510 14.950 4.213 0,140 820.000 194.376
Maximum 7,000 121.666 121.666 0,370 1.550.000 171.000.000
Minimum -3.900 4.772 278.000 0,050 320.000 -52.328.498
Std. Dev 1.710 23.692 33.953 0,090 402.022 41.437.027
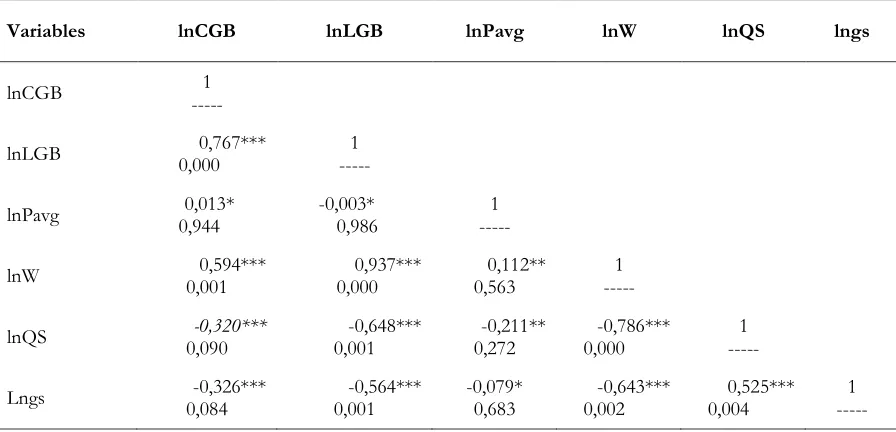
Correlation Coefficients
There is a significant correlation between one variable with another. The relationship between LGB, CGB, Pavg, W and QS with gs is less closely, meaning that all the independent variables are correlated with the dependent variable. This implies that these variables contribute to economic growth in Aceh. The correlation coefficients are reported in Table 6.
Table 6. Coefficient Correlations
In Aceh province, the agricultural sector is the main export commodities as a source of income. This sector contributed the largest to non-oil GDP amounted to 33.69% , Comparing to other economic sectors. The agricultural sector in the province of Aceh is relatively similar to other regions in Indonesia, with having similar characteristics of population who are dominantly working and are depending on the agricultural sector. The estimation results for the supply-side (QS). Table 7 provides commodity export sector basis of Aceh Province, Indonesia.
Table 7. Estimation Results for Supply Equations (QS)
Variables Coefficients T-stats Remarks
Constant 176,057*** 6,498 F=29,441 Sig=0,000
65
Referring to Table 7, there is one variable that is contrary to the theory pertaining to the Aceh’s Government capital expenditure (LGB). Meanwhile, the central government capital expenditure (CGB), the average export price (Pavg), Aceh’s province minimum wage (W) were in line with the previous studies. All variables were statistically significant, either partially or simultaneously. The estimated coefficient of Central Government capital expenditure (CGB) of 2,928 indicating that, if capital expenditure budget increased by 1%, it will lead to an increase in supply by 2,928%. Such magnitude shows the importance of capital expenditure on the economy of Aceh, due to an increase in exports. Elasticity of the central government capital expenditure variable is relatively elastic, showing meaningful role of the supply sector commodity export base of Aceh. This is in line with the results of the studies by Armstrong and Taylor, 2000; Bennerje and Harris, 2001; Diewert, 2013; and Ludwig and Brautzsch, 2013.
Local government capital expenditure variable (LGB) is estimated -1.453 and the coefficient is statistically significant. This implies that, if the local government increases its capital spending by 1%, the supply will decrease by 1.453%. It provides an indication that the Government of Aceh's capital expenditures are not able to create efficiencies in the production process, increased production costs and the price will be expensive as a result of the importers reducing demand and declining foreign exchange earnings. The average export price is estimated 1,443 and statistically significant. This indicates that a 1% increase in the average price, then the supply will go up by 1,443%. This variable is also elastic, meaning that a small price change causes the supply to change more dramatically. In addition, the estimate minimum wage variable (W) of -12.614, indicating that, if there is an increase of 1% in average wage, it leads to a decrease in supply by 12.614%. This implies that there is a tendency to shift labour from agriculture to industry. It should be noted that the attention of the Government of Aceh should carefully focus on determining the Provincial Minimum Wage (W) in order to avoid labour trade off from the agricultural sector to the industrial sector. An increase in minimum wage in Aceh Province (W) will shift the labour force from agriculture to industry. Elasticity of the Provincial Minimum Wage (W) is elastic and affects the commodity sector offers export base. The impact of the increase in the supply of commodities export base sector affects the economic growth. This could be due to the ability to produce and improve the sector's export base and the excess production of export destination countries are trafficked to and bring in foreign exchange (money inflow). The results of the estimation of economic growth in Aceh from the supply-side commodity export base Aceh sector are reported in Table 8.
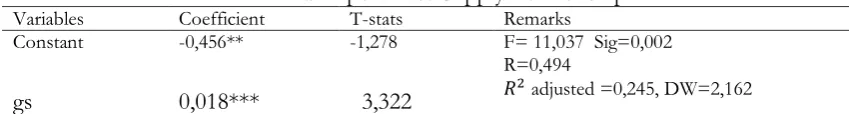
Table 8. Estimation Results for The Economic Growth and Export Base Supply Relationship
Variables Coefficient T-stats Remarks
Constant -0,456** -1,278 F= 11,037 Sig=0,002 R=0,494
2 adjusted =0,245, DW=2,162
gs 0,018*** 3,322
Note: *** and ** indicate significance at the 1% and 5% levels
66
study by Heizer and Nowak-Lehan (2006) in Chilli, different production functions, namely on labour. Research Dierk Heizer and Felicitas Nowak-enter the labour Lehan, whereas in this study conducted a proxy for labour through the average export price (Pavg) and minimum wage Aceh Province (W). Likewise, there are two capital variable capital expenditure of the Central Government (CGB) and capital expenditures Government of Aceh (LGB). The result of the analysis is the same as the previous research sector export base role in encouraging the growth of the economy of an area / region.
Conclusions and Recommendations
The agricultural sector is the only export base sector in the province of Aceh. The government capital expenditures have not been able to encourage the increase in the supply of commodities export sector basis, but all variables are found to be significance either partially or simultaneously. The role of supply-side commodity export base sector to economic growth in Aceh is still relatively small. To overcome the lack of economic growth in Aceh, it is recommended for the government to use the capital expenditure optimally, and coupled with the proper use of natural resources.
Limitations of this study is the capital expenditure of the Central Government and the Government of Aceh in the form of flow budget, preferably in the form of a capital stock as suggested in the research of Soo Jung and J. Kim (2010).
References
Armstrong, Harvey and Jim Taylor, 2000, Regional Economics And Policy, third edition, Blackwell Publishing, USA.
Bendavid, Avrom Val, 1991, Regional and Local Economic Analysis for Practitioners, fourth edition, Praeger Publishers, New York.
Benerjee, Swagata Ban dan Thomas R. Haris, 2001, A Disaggregated Time-Series Analysis of
Export-Base Models: A Case Study on Elko County of Nevada, Journal American Agricultural Economics
Assosiation Annual Meeting 2001 at Chicago, Illionis
Blair, John P, 1995, Local Economic Development: Analysis and Practice, Thousand Oaks, London, New Delhi, Sage Publications, Inc
Cardoso, Catarina dan Elias Soukiazis, 2008, Explaining The Uneven Economic Performance Of The EU
Cohesion Countries: An Export-Led Growth Approach, The Internasional Trade Journal, Volume
XXII, No.2, April-June 2008
Cook, Thomas, 1979, An Application of the Transfer Function to an Economic-Base Model, Annals of Regional Science
Dierk Heizer and Felicitas Nowak-lehman (2006). Export diversification, Externalities and Growth.D, journal Ibero America Institute for Economic Research. No. 099.
Diewert, Erwin W, 2013, US TFP Growth and The Contribution of Change in Export and Import Prices to
Real Income Growth, Jounal Prod Anal (2014) 41: 19-39
Engelmann, Sabine, 2013, International Trade, technological Change and Wage Inequality in the UK
Economy, Journal, Empirica (2014) 41: 223-246.
Geoffrey, Jehle A dan Philip J. Reny, 2005, Advanced Microeconomic Theory, Addison-wesley Longman, Inc.
Goran Nikolic,Is there a structural improvement in the merchandise export of the Balkan countries in the period 2000-2012. Journal Economic Annals, Volume (year) 58 (2013) P. 99-132
Harris, Thomas R, George E. Ebai and J. Scott Shonkwiler, 1998, A Multidimensional Estimation Of
Export Base, Journal, JRAP 28.1 : 3-17
Higtger,.B, 2001, The Scope Of Government and Its Impact On Economics Growth in OECD Countries, Kiel
Institute Of Worl Economics Working Paper No. 10
67
International Research Institute University of Japan, Economics and Management series, EMS-2011-16, Juni 2011
Krikelas, Andrew W, 1992, Why Regional Grow: A Review of Research on the Economic Base Model,
Economic Review: Atlanta Federal Reserve Bank (1992),pp 16-28
Krugman, P.R, M. Obstfeld, 2009, Internasional Economics: Theory and Policy. Eight Edition, Boston, Pearson Education, INc
Ludwig, Udo dan Hans-Ulrich Brautzsch, 2013, The Skill Balance in Germany’s Import Intensity of
Export: An Input-Output Analysis, Jounal, ZRB-Leibniz Information Center For Economics, Germany
Mah, Jai S, 2007, Economic Growth, Export and Export Composition in China, Applied Economics Letter Journal 1350-4851
Mahendhiran Nair, Deviga Vegendasalam, Karunagaran Madhavan dan V.G.R. Chandran Govindaraju, (2006), The rise of China’s manufacturing sector: Challenges and opportunities for Asean-5, The Philippine Review of economics Vol. XLIII No.1 June 2006 P. 167-203
McCann, Philip, 2001, Urban and Regional Economics, Oxford University Press, New York
McNulty, Vijay K and Harvey S. Rosen, Regional Employment Multiflier: A New Approach, Land Economics 50: 93-96
Naude, Wim, Maarten Bosker dan Marianne Matthee, (2010), Exspor Specialisation And Local
Economic Growth, The World Economiy Journal
Richardson, Harry W. 1969, Regional Economics. location theory, urban structure and regional change,
Weidenfield and Nicolson
Salvatore, Dominick, 2004, International Economics, Wiley International. Eight Edition, New Jersey, John Wiley & Sons, Inc
Takeda, Shiro, Hanae Temechica, Toshi H. Arimura, Carolyn Fischer, Alan K. Fox, 2013,
Tiebout, Charles M, 1962, The Community Economic Base Study, Supplementary Paper 16 New York: Committee For Economic Development
Wang, Jue,Yingqi Wei, Chengang Wang, Hua Lin dan Xiaming Liu, 2014, Simultaneous Impact of the