OPTIMIZATION OF LAND USE SUITABILITY FOR AGRICULTURE USING
INTEGRATED GEOSPATIAL MODEL AND GENETIC ALGORITHMS
Shattri B Mansor, Saied Pormanafi
*,
Ahmad Rodzi B Mahmud and Saied PirastehFaculty of Engineering, University Putra Malaysia (UPM), 43400 Serdang, Selangor Darul Ehsan, Malaysia
[email protected] [email protected]
Commission II, WG II/7
Keywords: Land Suitability Evaluation, Geospatial, Remote Sensing, Genetic Algorithms
ABSTRACT:
In this study, a geospatial model for land use allocation was developed from the view of simulating the biological autonomous adaptability to environment and the infrastructural preference. The model was developed based on multi-agent genetic algorithm. The model was customized to accommodate the constraint set for the study area, namely the resource saving and environmental-friendly. The model was then applied to solve the practical multi-objective spatial optimization allocation problems of land use in the core region of Menderjan Basin in Iran. The first task was to study the dominant crops and economic suitability evaluation of land. Second task was to determine the fitness function for the genetic algorithms. The third objective was to optimize the land use map using economical benefits. The results has indicated that the proposed model has much better performance for solving complex multi-objective spatial optimization allocation problems and it is a promising method for generating land use alternatives for further consideration in spatial decision-making.
1. INTRODUCTION
With the increase in population, as well as human activities, pressure on land has been intensified (Bandyopadhyay S et al. 2009). Geo-computation is an innovative research area within the field of GIS and geospatial analysis. For this reason, it is strongly influenced by recent developments in programming, data processing and interface design. Nowhere is this more obvious than in the concern for modelling of dynamic process (Smith et al., 2006). According to Malczewski (2004), there are three main groups of methods for the GIS land-use suitability analysis: 1- computer-aided overlay maps, 2- multi-criteria assessment and; 3- Artificial Intelligence (AI) (soft computing or Geo-computation) methods (Malczewski, 2004). Recent developments in spatial analysis showed that AI offers new opportunities to land use suitability analysis and planning (Openshaw, Fischer et al., 2000) includes modern techniques of calculation that may help the modeling and description of complex systems for inference and decision making (Malczewski, 2004).
The main purpose of this research is; optimizing the developed FAO‘s Evaluation Model (1976) and land use/ land cover in Menderjan Watershed using GIS, RS and GA; These Objectives are mentioned as follow:
1- To determine Land Suitability Evaluation for three main crops (wheat, potato and Almond) based on defined Scenarios.
2- To determine Fitness Function by Presenting Water Erosion Geospatial Pattern of the study area and estimating amount of cost/benefit crops.
3- Optimizing land use/ land cover of agricultural area and determining the best current benefit of the region based on three scenario using GAs programming.
Koomen et al., (2007) affirmed spatial optimization is a prevailing method to explore the potentials of a given area to progress the spatial coherence of land use functions. One of
the methods for optimization is spatial optimisation: a method designed to minimise or maximise the objectives in spatially explicit studies, given the limited area, finite resources, and spatial relationships between different functions. Spatial optimisation is an authoritative method to explore the potentials of a given area to improve the spatial coherence of land-use functions. Other applications include agricultural sustainability and resource allocation (Aerts, 2002; Koomen et al., 2007).
1.1 Genetic Algorithms (GAs)
The Genetic Algorithm (GA) proposed and developed by John Holland (1975) and discovered by Charles Darwin in “The Origin of Species (Penev and Ruzhekov, 2011), is an optimization and search technique based on the principles of genetics and natural selection (Malczewski, 2004; Schwefel et al., 1995; Koomen et al., 2007). Figure 1.1 shows divided into Artificial Intelligence vs. Computational Intelligence (Openshaw, Fischer et al., 2000). Koomen et al., 2007 defined that “fitness function is used to evaluate the suitability of the individuals. The fitness function takes a single individual as input and returns a quantitative measure of the ‘goodness’ of the solution represented by that individual.” Correa et al., (2004) believe that GAs are a heuristic method used to find approximate solutions to complicated problems through application of the principles of evolutionary biology.
1.1.1 Elements of Genetic Algorithm
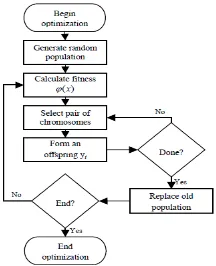
Figure 1: Flowchart of genetic algorithm ( Source: Paulinas, Ušinskas 2007)
GA Operators, The simplest form of genetic algorithm involves three types of operators: selection, crossover and mutation.
1.2 Linking GIS and GAs
Parka, (2006) argued that a GIS was used in conjunction with the GA for the helpful analysis of information collected from a Watershed. By representing each geographic element as a “layer” through a systematic arrangement, GIS software was used to perform various types of spatial analyses on huge quantities of geographic data. The constructed database was then linked to the GA as input data. Li and Yeh (2005) integrated GAs with GIS technology to study optimal location selection.
As Datta et al., (2006), beforehand, land-use management problem was undertaken using linear programming (LP) approaches, they proposed another GA to study future land-use configuration under two objectives of maximization of carbon sequestration and minimization of soil loss.
GAs have been applied to spatial optimisation problems (Aerts, 2002; Matthews, 2001). By representing each geographical feature as a "layer" with a systematic, used GIS software to perform various types of spatial analysis of large volumes of geographic data. The database has been built then linked to the GA as input (Park and Choi et al., 2006). Malczewski, (2004) affirmed that the applications of GA to GIS-based land-use suitability analysis have gained popularity in recent years. Matthews et al. (1999) suggested, “A GA can be a key component of the land-use planning and management support system.
Bennett et al. (1996) emphasized that a land-use suitability problem should be analyzed both in the criterion space (land attribute space) and geographical space (location of land attributes) and suggested that a GA-based approach is an effective way of constructing a link between the two spaces.”
2. MATERIAL AND METHODS
Regarding to the aim of research, important and strategic crops are investigated. Land evaluation in this current study includes “Land-Crop Suitability Evaluation”, in both rainfed and irrigated land type use, and crop type, which have capability to implant, regarding environmental and ecologic land potential. Reviewing related literatures reveal that, in the most aspect of them, only evaluation of land use or sort of crops was being considered.
In this study, the experts and residents attitudes were considered using the FAO framework in field of land suitability evaluation for implanting each kinds of rainfed and irrigated crops. Therefore, it is hopeful to achieved and
considered goals in conservation of the soil and other ecological potential of the region and leads them to an economical benefit to all residents. The principle function at this research is objective function that includes land uses which are from classification of the satellite image of IRIS P6 from that region of statistical data benefits of wheat, potato and almond. This layer is construction of the interview that statistical data region is related to economical activity and all those related to three cultivation which mention during this research and costs of the soil erosion of the study area in the amount of the annual soil erosion from EPM method which is obtained. And amount of soil waste from agriculture administration through watershed section were asked. The obtain above costs and pixel size 25 25 m according to other data layers were calculated. Finally, the amount of total costs is including the erosion costs and the activity costs. The economical cost of each product is calculated, therefore, three above crops is obtained. In the case of the economical benefits layers of three studied cultivation crop, it should be mentioned that the results of the land evaluation for three crops, the regions that have the best land fitness, all means that the least limitation for the cultivation were selected. In addition, in this study other function had defined and named; the “chang.cost.” in this function the costs of changing three crop together and other applications were calculated in a 38 matrix.
Continuously, Erosion model is ended the erosion costs in the region. Within current costs in the farms, the data layers are obtained which yield data layer. The layer of economical benefits was obtained with calculation of selling amount of yields and decreasing the related costs for each yield. It is required to mention that the related data, price of each hectare soil and selling the yields by farmers were asked from the Agriculture Ministration. Based on the various reports related organizations whit the soil erosion (water erosion), economically, the damage that originates from it, annually in Iran, is an amount of 14% Gross National Product (GDP) income. Other costs were asked from farmers and residents of the residents and existing data from Agricultural Ministration of Isfahan Province. In fact, the erosion model and beneficial economic of the yields and 3 8 matrix have been considered as objectives function in Genetic Algorithm model in this research. Considering a function seperatly, the inputs of that function must be defined and as a matrix that the conditions of each input be applied, then be writen in input of the function. Finally, it is writen in the Matlab software. It is not important that the name be same as above mentoned. It is important that the properties and the sizes are applied respectively. To solve any problems with Genetic algorithm, each of these variables is considered as genes in the natural genetic. Get together all of the variables of a problem (genes), a chromosome is made.
2.1 Study Area
winter is about 332mm. The rainy season starts in October and ends in March.
Figure 2: Location of study area
2.2 Data Analysis and Processing
After data preparation and supplying the geospatial database, different analysis must be informed including geo-processing, 3D analysis, spatial data modelling, digital elevation model, soil data preparing, geo-statistical analysis and climatic data Analysis.
2.2.1 Remote Sensing Data Analysis
Satellite images are utilized in this study to prepare some parts of the data layers. In various pervious investigations in land evaluation, RS were used in preparing the current land use land cover of the region. An IRS-p6 LISS-III scene acquired on 3 July 2008.
A Nearest Neighbourhood algorithm resampling was executed as it preserves the spectral integrity of the image pixels (Lillisand et al., 2004). Accuracy assessment is a significant element of image classification. It can be determined by the error matrix. After the error matrix is generated, overall accuracy, producer’s and user’s accuracies, omission and commission errors, and Kappa statistics can be developed (Campbell, 2002; Lillesand, 2004; Jensen, 2005; Lu et al., 2007). It is required to check the accuracy of the land-cover classification with ground truth data before it can be used in scientific investigations and decision making policies (Jensen, 2005).
2.2.2 Land Suitability Evaluation
In this research the FAO framework for land suitability evaluation of the selected crops has been developed, as base of optimization by advanced methods of GIS. This study attempts to evaluate the land/crop suitability with consideration to socioeconomic issues of the study area. A database was formulated to examine the criteria. The land quality was selected only if it was very important or moderately important, while land quality with less important was omitted from land suitability assessment. A set of required land qualities and their associated land characteristics have been selected. After data collection, it is required to prepare them for analysis. It includes digital maps, which must be converted to the same format and geo-references. The gaps and defects of these layers can be filled from digital topographic maps or other resources. To assessment of socioeconomic condition of study area, the residents are interviewed about demography, agriculture and their income. Local agronomic experiments are the best guide in this process.
Another task in data preparing is providing the ecological demands of the region's crops and preparing the appropriate satellite images of the region.
In addition, these data should be stored as database in GIS and called “geospatial database”.
The definition of objectives is a critical step in the evaluation procedure. In this study, objectives of the land evaluation of Menderjan watershed are evaluation of irrigated and rainfed agriculture to improve land use and to reduce environmental and economic damages to the region.
The new technology that is available for land evaluation mainly consists of remote sensing and computers application.
2.3 EPM Model as Fitness Function
The EPM method was designed to provide the appropriate category that has been investigated by an authority, and to permit other specialists with minimal training to compute the sediment production rate (Wsp) in m³/km² according to the formula (Gavrilovic, 1988). The sedimentation yield in the Menderjan watershed was classified in four eroded categories (low, medium, high and very high) using EPM model.
The volume of soil erosion is calculated by the following equation in this method:
Wsp = T * H *π*Z1..5 (Nasri et al., 2009; Solaimani, et al., 2009; Tangestani, 2006).
Where, WSP is the volume of soil erosion (m3/ km2. yr), T is
temperature coefficient, H = the mean annual amount of precipitation in mm/y, Z is the coefficient of erosion which was calculated: (Solaimani, et al., 2009; Tangestani, 2006). Z= Y. Xa ( Ψ + I 0.5)
Y: The coefficient of rock and soil erosion, ranging from 0.25- 2; Xa: The land use coefficient, ranging from 0.05- 1; Ψ: The coefficient for present erosion type, ranging from 0.1- 1 and; I: Average- land slope in percentage.
2.4 Genetic Algorithms methodology
In this research, the real genetic algorithm is used to introduce the population, operation implemented, fitness function and the programming. Data layers which kept as the population in mating pool are transformed from GIS environment with double format from programming environment (Matlab Software). The definition of the amounts of the genetic algorithm: one of the basic requirements of this initiative genetic algorithm definition is appropriateness’ implementation of the detail of the algorithm. In the genetic algorithm, determining the types of the operations such as crossover and mutation, selection and the replacement are essential to use the algorithm.
Whereas, the initiative algorithm has dynamic origin, therefore it required to control the parameters of the algorithm dynamically during implementing the algorithm. In a genetic algorithm, Firstly, algorithm requires having high rate of the mutation and gradually the rate of the mutation decreased. The reason of this suggestion is that algorithm required high rate of the exploration that it could make sample different points of the research space. Finally must have high exploration to explore the optimized solutions around appropriate solutions. Then, genetic algorithm with dynamic parameters is more effective than genetic algorithm with static parameters. Mutation operation resulted in little changes in the solutions.
2.4.1Programming in the Real Genetic Algorithms
The regarded language is presented GAs section, current section and the methodology. The programming was done in MATLAB software. This program uses different functions that after principle function are being separated. To solve the other problems it is required to the amounts of the related parameters in problem in algorithm, control and related fitness function will be defined.
Main.m: The Name of the principle program
Per= 0.2-0.5; (Crossover rate) Pm= 0.1- 0.3; (Mutation rate)
Number_of_turn= 100; (the Number of frequencies)
2.4.2 Rating Value the Parameters
In this research, for determining the rate of the operators, and other parameters, regarding the literature review, there are standards, which have been done respectively:
Determine the account members of the Population, Crossover Rate, Mutation Rate, The number of the Variable, Chromosome length, Determination of each variable and research domain and How to terminate algorithm.
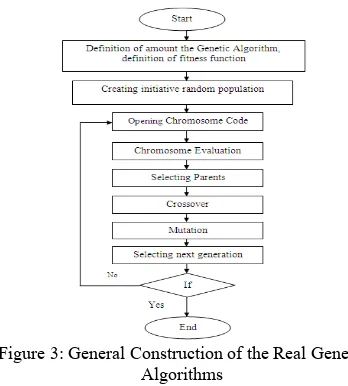
Figure 3. shows the pattern of the Chromosome Display in the real genetic algorithm
Figure 3: General Construction of the Real Genetic Algorithms
2.4.3Evaluation fitness of the genetic algorithm
Evaluation fitness of the genetic algorithm or any other algorithm, is studied from the convergence analysis and time of obtaining to an optimized answer. Design method is used for seeing the status of progressing the algorithm and monitoring above criteria. In this research, using mutation operation prevents facing the problem to before-ahead convenience. Naturally, being dynamic of the mutation is case study, which has been considered in the research. After producing a new generation, a stage of the operation algorithm is ended. In end of each stage of the algorithm operation, the stop clause is considered. For obtaining the number of frequency is used as stop clause and the final answer is called “The Best Solution” which is obtained from a N N matrix according to used layers.
3. RESULTS AND DISCUSSION
3.1 Scenarios of Land Use
One of the steps in the land use planning within the FAO’s framework is, preparing the plans with specific goals. In this regard, land use scenarios based on land suitability evaluation were presented.The current land use map was considered as zero scenario. In this regard, the remote sensing was used that was mentioned in chapter of method and materials. The mean of the ideal scenario is to suggest land uses that have the most suitable classes. In the second scenario the most suitable class related to irrigated agriculture land use were overlapped together. In the third scenario, the aim is to add the most suitable classes of rain-fed almond to places that irrigated agriculture land use has been approved in the second scenario.
Figure 4: Results Map related to Scenarios of the Land Use
3.2 Cost and benefit economical results
For the EPM model, the economic value per hectare of soil eroded was asked from the relevant organizations; this amount was calculated for per 25 meterspixel respectively. In addition, regarding to agricultural fees for each product which were asked from the residents and organizations; cost of agricultural products are indicated as tables already, and cost scenarios are shown in Figure 5. Also including sales, the profit was calculated after subtracting production costs from erosion costs and cultivation. Figure 6. shows Benefit of Crop for Scenarios.
Figure 5: the map cost for the crops in the three scenarios
Figure 6: Benefit of Crop for Scenarios
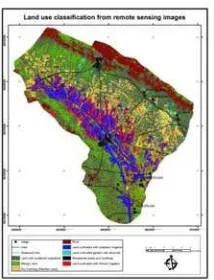
3.3 Classification results of the image processing
Figure 7: Land use/Land cover classification from remote sensing images
In this research, the general kappa of the classification is 87.4% and the general accuracy is 89.6%. The results of the land-cover layer as one of the GA inputs is considered in this research.
3.4 Genetic Algorithms Result
Regarding to one of the major objectives of the research, which is the usage of Genetic Algorithm capabilities in optimization; as it was mentioned in the methodology; some layers were considered as population and fitness function model. In fact, the outputs of the other objectives were applied as input of the GA. The required changes according to the needed parameter of the GA were implemented on the layers. Then, the appropriate conceptual model were recognized and determined for operating GA. Further, the programming were implemented based on population layers and fitness function. Finally, the model was run to obtain the appropriate results. Matlab Software was selected to programming because it has robust ability in operating this part of the research. In fact, the parents or population are the layers which are obtained from the results of the GIS analysis in LSA, LE parts and crop layers considering erosion and agriculture costs. The yields of the three crops including wheat and potato the appropriate lands for planting these three crops using FAO method, considering the water demand, soil parameters, climatology and topography were described in three scenarios; whereas the most suitable class has been considered (S).
3.4.1 Evaluation fitness of the genetic algorithm results
Appropriate frequency of GAs, which was considered as stop condition is terminated when reached to a defined condition. The matrix of the “best solution” was considered as the best answer. This matrix, the same as layers, has the same number of the row and column. In fact, this matrix is the optimized matrix of the land use of the region that has obeyed the fitness function. It means that the highest possible economical yield exists in this land use and nevertheless has the least erosion and agricultural costs and the least changing land uses costs. In order to evaluate the GA and matrix of the rent of the s., as it was mentioned in the methodology, the graph of the average of frequency with the “best of solution” was drawn. Figure 8. shows this graph.
Figure 8: Evaluation of the averages of frequency with the best solution
The general procedure of graph shows that the model goes to the optimization and goes from the least yields to the most yields to be static. Figure 9. Shows converting the matrix of the best answer.
In the layers which were obtained from GIS, the land evaluation classes and planting the crop are not diverse. In addition, the land use of the region has eight classes. Although the numerical values of the economical yield are diverse, however the goal is optimization of region land uses, the graph does not fluctuate. While focusing on the general schema of the matrix of the best solution, it is concluded that among three crops, the suitable regions of planting the almonds has the highest economical benefits, it means, the lowest costs of erosion and all agricultural activities. The results of the GAs showed that integration of GA, GIS and RS contributes to suitable ability in economical evaluation.
Figure 9: Converting the matrix of the best Solution to the Histogram
4. CONCLUSION
In addition, the ability of GA as an artificial intelligent method in presenting the model to integrate the layers with assigning the conditions of operators on it is considerable. Therefore, in this research, after changing parameters, using minimum parameters, and increasing the parameters gradually; the GA compares the results together and when they reached to statics conditions or inconsiderable changing, they were utilized as final parameters.
and maps. The main objective of the research was optimization of the land use map using economical benefits and cost of their change in GA environment. The matrix of the best solution was obtained as GA result. One of the results of this research is Graph of the best answer in iterations of average frequency for evaluation of the GA. By representing each geographic element as a “layer” through a systematic arrangement, GIS software was used to perform various types of spatial analyses on huge quantities of geographic data. Finally, the results of this research indicate that the GAs is one of the heuristic searches based on the AI that has ability to preserve the dynamic condition of the model in cases which the layers do not have numerical diversity, however, they present appropriate results.
5. REFERENCES
- Bandyopadhyay, S., R. K. Jaiswal, et al. 2009. Assessment of land suitability potentials for agriculture using a remote sensing and GIS based approach. International Journal of Remote Sensing 30(4): 879-895.
- Aerts, J. C. J. H. and G. B. M. Heuvelink. 2002. Using simulated annealing for resource allocation. International Journal of Geographical Information Science 16(6): 571-587.
- Campbell, J.B. 2002. Introduction to Remote Sensing- third edition. Taylor and Francis, London, p: 546.
- Correa, E. S., M. T. A. Steiner, et al. 2004. A genetic algorithm for solving a capacitated p-median problem. Numerical Algorithms 35(2): 373-388.
- Datta, D., K. Deb, et al. 2007. Multi-objective evolutionary algorithm for land-use management problem. International Journal of Computational Intelligence Research 3(4): 371-384.
- FAO. 1976. A framework for land evaluation. FAO Soils Bulletin 32.
- Gavrilovic, Z. 1988. Use of an Empirical Method(Erosion Potential Method) for Calculating Sediment Production and Transportation in Unstudied or Torrential Streams.
- Holland, J. 1975. Adaptation In Natural and Artificial Systems. University of Michigan Press, Ann Arbor.
- Jensen, J.R. 2005. Introductory digital image processing: a remote sensing prospective. 3rd Edn. Prentice-Hall, sries in geographic information science, pp: 163-164.
- Koomen, E., J. Stillwell, et al. 2007. "Modelling land-use change." Geojournal library 90: 1.
- Lillesand, T. M., R. W. Kiefer, et al. 2004. Remote sensing and image interpretation, John Wiley & Sons Ltd.
- Li, X. and A. G. O. Yeh. 2005. Integration of genetic algorithms and GIS for optimal location search. International Journal of Geographical Information Science 19(5): 581-601. - Lu, D. and Q. Weng. 2007. A survey of image classification methods and techniques for improving classification performance. International Journal of Remote Sensing 28(5): 823-870.
- Malczewski, J. 2004. GIS-based land-use suitability analysis: a critical overview. Progress in Planning 62(1): 3-65.
- Matthews K.B. 2001. Applying Genetic Algorithms to Multi-objective Land-Use Planning. Dissertation, Robert Gordon University.
- Melanie, M. 1999. An introduction to genetic algorithms. A Bradford Book The MIT Press Cambridge, Massachusetts London, England, Fifth printing.
- Nasri. M, Sadat Feiznia, Mohammad Jafari, Hasan Ahmadi, Using Field Indices of Rill and Gully in order to Erosion Estimating and Sediment Analysis (Case Study: Menderjan Watershed in Isfahan Province, Iran), International Journal of Humanities and Social Sciences 3:3 2009, 230 236
- Openshaw S, Fischer M. M et al. 2000. Geo-computation research agendas and futures In: Openshaw S, Abrahart, R.J (ed) Geo-computation.: Taylor & Francis, London and New York, 428.
- Paulinas, M., Ušinskas. A. 2007. A Survet of Genetic Algorithms Applications for Image Enhancement and Segmentation. Information Technology and Control, Vol.36, No.3 , p 278-284.
- Park, S. Y., J. H. Choi, et al. 2006. Design of a water quality monitoring network in a large river system using the genetic algorithm. Ecological modelling 199(3): 289-297. - Penev, K. and A. Ruzhekov. 2011. Adaptive intelligence applied to numerical optimisation. Numerical Methods and Applications: 280-288.
- Schwefel, H. P. and G. Rudolph. 1995. Contemporary evolution strategies. Advances in artificial life: 891-907.
- Smith, M. J., M. F. Goodchild, et al. 2007. Geospatial analysis: a comprehensive guide to principles, techniques and software tools, Troubador Publishing.
- Solaimani, K., S. Modallaldoust, et al. 2009. Investigation of land use changes on soil erosion process using geographical information system. International Journal of Environmental Science and Technology 6(3): 415-424.