Process Selection
From design to manufacture
Second edition
K. G. Swift
Department of Engineering, University of Hull, UK
and
J. D. Booker
Department of Mechanical Engineering, University of Bristol, UK
OXFORD AMSTERDAM BOSTON LONDON NEW YORK PARIS
An imprint of Elsevier
Linacre House, Jordan Hill, Oxford OX2 8DP 200 Wheeler Road, Burlington MA 01803
First published in 1997 by Edward Arnold Second edition 2003
Copyright#2003, K. G. Swift and J. D. Booker. All rights reserved The right of K. G. Swift and J. D. Booker to be identified as the authors of this work has been asserted in accordance with the Copyright, Designs and Patents Act 1988
No part of this publication may be reproduced in any material form (including photocopying or storing in any medium by electronic means and whether or not transiently or incidentally to some other use of this publication) without the written permission of the copyright holder except in accordance with the provisions of the Copyright, Designs and Patents Act 1988 or under the terms of a licence issued by the Copyright Licensing Agency Ltd, 90 Tottenham Court Road, London, England W1T 4LP. Applications for the copyright holder’s written permission to reproduce any part of this publication should be addressed to the publisher
Permissions may be sought directly from Elsevier’s Science and Technology Rights Department in Oxford, UK: phone: (þ44) (0) 1865 853333; e-mail: [email protected]. You may also complete your request on-only via the Elsevier Science homegage (http://www.elsevier.com), by selecting ‘Customer Support’ and then ‘Obtaining Permissions’
British Library Cataloguing in Publication Data
A catalogue record for this book is available from the British Library
Library of Congress Cataloguing in Publication Data
A catalogue record for this book is available from the Library of Congress
ISBN 0 7506 5437 6
For information on all Butterworth-Heinemann publications visit our website at www.bh.com
Typeset by Integra Software Services Pvt. Ltd, Pondicherry 605 005, India www.integra-india.com
Contents
Preface to second edition ix
Preface to first edition xi
Notation used xiii
Part I A strategic view 1
1.1 Problems 1
1.2 Manufacturing information for design 2
1.3 Competitive product introduction processes 4
1.4 Techniques in design for manufacture and assembly 5
1.5 Process selection strategy 13
Part II Selecting candidate processes 19
2.1 Introduction 19
2.2 PRIMAs (Process Information Maps) 19
2.3 PRIMA selection strategies 20
2.3.1 Manufacturing process selection 21
2.3.2 Assembly system selection 24
2.3.3 Joining process selection 27
2.4 PRIMA categories 34
1 Casting processes 35
1.1 Sand casting 36
1.2 Shell molding 39
1.3 Gravity die casting 42
1.4 Pressure die casting 45
1.5 Centrifugal casting 48
1.6 Investment casting 51
1.7 Ceramic mold casting 54
1.8 Plaster mold casting 57
1.9 Squeeze casting 60
2 Plastic and composite processing 63
2.1 Injection molding 64
2.3 Compression molding 69
2.4 Transfer molding 72
2.5 Vacuum forming 74
2.6 Blow molding 77
2.7 Rotational molding 80
2.8 Contact molding 83
2.9 Continuous extrusion (plastics) 86
3 Forming processes 89
3.1 Forging 90
3.2 Rolling 94
3.3 Drawing 99
3.4 Cold forming 102
3.5 Cold heading 106
3.6 Swaging 109
3.7 Superplastic forming 112
3.8 Sheet-metal shearing 114
3.9 Sheet-metal forming 117
3.10 Spinning 121
3.11 Powder metallurgy 124
3.12 Continuous extrusion (metals) 128
4 Machining processes 131
4.1 Automatic and manual turning and boring 132
4.2 Milling 136
4.3 Planing and shaping 139
4.4 Drilling 142
4.5 Broaching 145
4.6 Reaming 148
4.7 Grinding 151
4.8 Honing 154
4.9 Lapping 157
5 Non-Traditional Machining (NTM) processes 161
5.1 Electrical Discharge Machining (EDM) 162
5.2 Electrochemical Machining (ECM) 165
5.3 Electron Beam Machining (EBM) 167
5.4 Laser Beam Machining (LBM) 169
5.5 Chemical Machining (CM) 171
5.6 Ultrasonic Machining (USM) 174
5.7 Abrasive Jet Machining (AJM) 176
6 Assembly systems 179
6.1 Manual assembly 180
6.2 Flexible assembly 183
6.3 Dedicated assembly 186
7 Joining processes 189
7.1 Tungsten Inert-Gas Welding (TIG) 190
7.2 Metal Inert-Gas Welding (MIG) 193
7.3 Manual Metal Arc Welding (MMA) 196
7.4 Submerged Arc Welding (SAW) 199
7.5 Electron Beam Welding (EBW) 202
7.6 Laser Beam Welding (LBW) 205
7.7 Plasma Arc Welding (PAW) 208
7.8 Resistance welding 211
7.9 Solid state welding 215
7.10 Thermit Welding (TW) 218
7.11 Gas Welding (GW) 220
7.12 Brazing 223
7.13 Soldering 226
7.14 Thermoplastic welding 229
7.15 Adhesive bonding 231
7.16 Mechanical fastening 235
2.5 Combining the use of the selection strategies and PRIMAs 240
2.5.1 Manufacturing processes 240
2.5.2 Assembly systems 241
2.5.3 Joining processes 244
Part III Costing designs 249
3.1 Introduction 249
3.2 Component costing 250
3.2.1 Development of the model 250
3.2.2 Basic processing cost (Pc) 251
3.2.3 Relative cost coefficient (Rc) 253
3.2.4 Material cost (Mc) 272
3.2.5 Model validation 273
3.2.6 Component costing case studies 275
3.2.7 Bespoke costing development 282
3.3 Manual assembly costing 285
3.3.1 Assembly costing model 285
3.3.2 Assembly structure diagram 291
3.3.3 Manual assembly costing case studies 291
3.4 Concluding remarks 293
Sample questions for students 301
Appendices 304
References 309
Index 313
Preface to second edition
Recent experiences from carrying out Design for Assembly (DFA) and Design for Manufac-ture (DFM) product studies in industry have reinforced the authors’ belief that consideration of manufacturing problems at the design stage is the major means available for improving product quality, reducing manufacturing costs and increasing productivity. In the second edition, as well as providing further information to help select processes for components and the joining of components, we have included data on assembly process selection and costing. This can all be used to support DFA/DFM projects and associated activities.
The inclusion of assembly is very conscious, in that assembly issues are often neglected in product engineering. Through consideration of assembly, many strategically important issues can be addressed. For example, DFA impacts much more than assembly itself. In addition to reducing component assembly and handling costs, DFA encourages part-count optimization, variety reduction and standardization.
The authors wish to acknowledge the further support of individuals at CSC and Richard Batchelor of TRW. Special thanks are given to Bob Swain for help in the preparation of the figures and to Nathan Brown for research into joining process selection, both at the University of Hull. Thanks are also due to EPSRC for continued support of research under the Designers’ Sandpit Project (GR/M53103 and GR/M55145).
Preface to first edition
In order to facilitate the achievement of the required quality and cost objectives for the manufacture of a component design solution it is necessary to carry out the interrelated activities of selecting candidate processes and tuning a design to get the best out of a chosen manufacturing route. These are difficult decision-making tasks that few experts do well, particularly in the situation of new product introduction.
Failure to get this right often results in late engineering change, with its associated problems of high cost and lead time protraction, or having to live with components that are of poor quality and/or expensive to make.
There is a need for specialist knowledge across a range of manufacturing technologies to enable the correct design decisions to be made from the breadth of possibilities. The difficul-ties faced by businesses in this area are frequently due to a lack of the necessary detailed knowledge and the absence of process selection methods.
The main motivation behind the text is the provision of technological and economic data on a range of important manufacturing processes. Manufacturing PRocess Information
MAps (PRIMAs) provide detailed data on the characteristics and capabilities of each process in a standard format under headings including: material suitability, design considerations, quality issues, general economics and process fundamentals and variations. A distinctive feature is the inclusion of process tolerance capability charts for processing key material types.
Another distinctive feature of the book is the inclusion of a method for estimating compo-nent costs, based on both design characteristics and manufacturing process routes. The cost associated with processing a design is based on the notion of a design independent basic processing cost and a set of relative cost coefficients for taking account of the design applica-tion including geometry, tolerances, etc. The overall component cost is logically based on the sum of the material processing and material purchase cost elements. While the method was primarily designed for use with company specific data, approximate data on a sample of common manufacturing processes and material groups is included to illustrate the design costing process and quantify the effect of design choices and alternative process routes on manufacturing cost.
The book is primarily intended to be useful to engineering businesses as an aid to the problem of selecting processes and costing design alternatives in the context of concurrent engineering. The work will also be useful as an introduction to manufacturing processes and their selection for all students of design, technology and management.
The authors are very grateful to Liz Davidson of CMB Ltd for her efforts in collecting data on many of the processes included, and to Robert Braund of T&N Ltd for his contribution to extending the data sheets and particularly for his work on the effects of component section thickness and size on process selection and costing. The authors are also greatly indebted to Adrian Allen for his valuable contribution to the research concerned with methodologies for manufacturing process selection and costing.
Thanks are also due to Phil Baker, Graham Hird, Duncan Law and Brian Miles of CSC Manufacturing Ltd (formerly Lucas Engineering & Systems Ltd) for their encouragement and enthusiastic support, and to Bob Swain of the University of Hull for help with manuscript preparation.
The Engineering and Physical Sciences Research Council (EPSRC) of the UK is gratefully acknowledged for support (under research grant number GR/J97922) for research concerned with process capability and design costing.
Notation used
List of terms
A ¼total average cost of setting up and operating a specific process, including plant, labor, supervision and overheads, per second in the chosen country
B ¼average annual cost of tooling for processing an ideal component, including mainte-nance
Ah ¼basic handling index for an ideal design using a given handling process Af ¼basic fitting index for an ideal design using a given assembly process
Cc ¼relative cost associated with producing components of different geometrical complexity Cf ¼relative cost associated with obtaining a specified surface finish
Cft ¼value ofCtorCf(whichever is greatest) Cl ¼labor rate
Cma¼total cost of manual assembly
Cmp¼relative cost associated with material-process suitability Cmt¼cost of the material per unit volume in the required form
Cs ¼relative cost associated with size considerations and achieving component section reductions/thickness
Ct ¼relative cost associated with obtaining a specified tolerance F ¼component fitting index
H ¼component handling index Mc ¼material cost
Mi ¼manufacturing cost (pence)
n ¼number of operations required to achieve the finished component N ¼total production quantity per annum
Pa ¼penalty for additional assembly processes on parts in place
Pc ¼basic processing cost for an ideal design of component by a specific process Pf ¼insertion penalty for the component design
Pg ¼general handling property penalty
Po ¼orientation penalty for the component design Ra ¼roughness average (surface finish)
Rc ¼relative cost coefficient assigned to a component design
T ¼process time in seconds for processing an ideal design of component by a specific process
V ¼volume of material required in order to produce the component Vf ¼finished volume of the component
a ¼cost of setting up and operating a specific process, including plant, labor, supervision and overheads, per second
b ¼process specific total tooling cost for an ideal design
Units
m ¼meter
mm ¼micron/micrometer mm¼millimeter
t ¼ton (metric) kg ¼kilogram
g ¼gram
h ¼hour min¼minute s ¼second
rpm¼revolutions per minute
Acronyms – general
CA Conformability Analysis
CAD Computer-aided Design
DFA Design for Assembly DFM Design for Manufacture DOE Design of Experiments
FMEA Failure Mode and Effects Analysis PDS Product Design Specification PIM Product Introduction Management PRIMA Process Information Map
QFD Quality Function Deployment
Acronyms – manufacturing processes
AJM Abrasive Jet Machining
ATB Automated Torch Brazing
ATS Automated Torch Soldering
CM Chemical Machining
CNC Computer Numerical Control
CW Cold Welding
DB Dip Brazing
DS Dip Soldering
DFW Diffusion bonding (Welding) DFB Diffusion Brazing
EBM Electron Beam Machining
EBW Electron Beam Welding
ECG Electrochemical Grinding ECM Electrochemical Machining EDG Electrical Discharge Grinding
EDM Electrical Discharge Machining
EGW Electrogas Welding
ESW Electroslag Welding
EXW Explosive Welding
FB Furnace Brazing
FS Furnace Soldering
FCAW Flux Cored Arc Welding
FRW Friction Welding
FW Flash Welding
GW Gas Welding
IB Induction Brazing
INS Iron Soldering
IRB Infrared Brazing
IRS Infrared Soldering
IS Induction Soldering
LBM Laser Beam Machining
LBW Laser Beam Welding
MIG Metal Inert-gas Welding MMA Manual Metal Arc Welding NDT Non-Destructive Testing NTM Non-Traditional Machining
PAW Plasma Arc Welding
RB Resistance Brazing
RPW Resistance Projection Welding RS Resistance Soldering
RSEW Resistance Seam Welding RSW Resistance Spot Welding
SAW Submerged Arc Welding
SW Stud Arc Welding
TB manual Torch Brazing
TIG Tungsten Inert-gas Welding
TS Manual Torch Soldering
TW Thermit Welding
USM Ultrasonic Machining
USW Ultrasonic Welding
USEW Ultrasonic Seam Welding
WS Wave Soldering
Manufacturing process key (for Part III)
AM Automatic Machining
CCEM Cold Continuous Extrusion (Metals)
CDF Closed Die Forging
CEP Continuous Extrusion (Plastics)
CF Cold Forming
CH Cold Heading
CM2.5 Chemical Milling (2.5 mm depth)
CM5 Chemical Milling (5 mm depth)
CMC Ceramic Mold Casting
CNC Computer Numerical Controlled Machining
CPM Compression Molding
GDC Gravity Die Casting
HCEM Hot Continuous Extrusion (Metals)
IC Investment Casting
IM Injection Molding
MM Manual Machining
OEM Original Equipment Manufacturing PDC Pressure Die Casting
PM Powder Metallurgy
SM Shell Molding
SC Sand Casting
SMW Sheet-Metal Work
VF Vacuum Forming
Materials key (for plastics processing)
ABS Acrylonitrile Butadiene Styrene
CA Cellulose Acetate
CP Cellulose Propionate
PF Phenolic
PA Polyamide
PBTP Polybutylene Terephthalate
PC Polycarbonate
PCTFE Polychlorotrifluoroethylene
PE Polyethylene
PESU Polyethersulfone
PETP Polyethyleneterephthalate PMMA Polymethylmethacrylate
POM Polyoxymethylene
PPS Polyphenylene Sulphide
PP Polypropylene
PS Polystyrene
PSU Polysulfone
PVC-U Polyvinylchloride – Unplasticized SAN Styrene Acrylonitrile
UP Polyester
SMC Sheet Molding Compounds
BMC Bulk Molding Compounds
Part I
A strategic view
Some background to the problem and placing process selection and costing into the context of modern product introduction and the application of techniques in design for manufacture
and assembly.
1.1
Problems
In today’s environment, manufacturing businesses are facing fierce competition and operating in changing markets. Customer demands for higher quality products at lower costs and shorter product lifecycles are putting extra pressure on the product introduction process. Cost and quality are essentially designed into products in the early stages of this process. The designer has the great responsibility of ensuring that the product will conform to customer requirements, comply with specification, and ensuring quality in every aspect of the product, including its manufacture and assembly, all within compressed time-scales. The company that waits until the product is at the end of the line to measure its conformity, performance and cost will not be competitive. The need to understand and quantify the consequences of design decisions on product manufacture and quality has never been greater.
There is extensive evidence to show that products are being designed with far too many parts and with many complex assembly and manufacturing requirements. It has been found that more than 30 per cent of product development effort can be wasted on rework (1.1)* and it is not uncommon for manufacturing operations to have a ‘cost of quality’ equal to 25 per cent of total sales revenues (1.2). Even Fortune 500 quality leaders face intimidating quality losses (1.3). Why do businesses continually face such difficulties? The costs ‘fixed’ at the planning and design stages in product development are between 60 and 85 per cent, while the costs actually incurred at that stage range from only 5 to 7 per cent. Therefore, the more the problems prevented early on, through careful design, the fewer the problems that have to be corrected later when they are difficult and expensive to change. However, to achieve this, it is necessary to reduce the ‘knowledge gap’ between design and manufacture as shown in Figure 1.1.
Some designers have practical experience of production, and understand the limitations and capabilities they must work within. Unfortunately, there are many who do not. Furthermore, the effects of assigning tolerances and specifying geometry and materials in design have far reaching implications on manufacturing operations and service life, and the associated risks are not properly understood. Understanding the effects of variability and the severity/cost of failure is crucial to risk assessment and its management.
Fig. 1.1 Commitment and incursion of costs during product development (or the ‘knowledge gap’principle) (after (1.4)).
1.2
Manufacturing information for design
The need to provide the design activity with information regarding manufacturing process capabilities and costs has been recognized for many years, and some of the work that has been done to address this problem will be touched on. However, there is relatively little published work in this area. The texts on design rarely include relevant data and while a few of the volumes on manufacturing processes do provide some aid in terms of process selection and costs (1.5–1.10), the information is seldom sufficiently detailed and systematically presented to do more than indicate the apparent enormity of the problem. Typically, the facts tend to be process specific and described in different formats in each case, making the engineer’s task more difficult. There is a considerable amount of data available but precious little knowledge of how it can be applied to the problem of manufacturing process selection. The available information tends to be inconsistent; some processes are described in great detail, whilst others are perhaps neglected. This may give a disproportionate impression of the processes and their availability.
Information in manufacturing texts can also be found displayed in a tabulated and com-parative form on the basis of specific process criteria. While useful, the design related data tends to be somewhat limited in scope and detail. Such forms may be adequate if the designer has expertise in the respective processes, but otherwise gaps in the detail leave room for misconceptions and may be a poor foundation for decision-making. Manufacturing cata-logues and information can be helpful, however, they tend to be sales orientated and again, data is presented in different formats and at various levels of detail. Suppliers rarely provide much on design considerations or information on process capability. In addition, there are often differences in language between the process experts and the users.
In recent years, a number of research groups have concentrated specifically on the design/ manufacture interface. Processes and systems for cost estimation have been under develop-ment in areas such as machining, powder metallurgy, die casting and plastic molding and on broader techniques with the goal of providing Design for Manufacture (DFM) and cost related information for the designer (1.11–1.20). A review of cost estimation techniques for the early stages of design and a method for relating product cost to material cost, total batch size and level of underlying technology can be found in References 1.21–1.24.
Companies recognizing the importance of design for manufacture have also searched for many years for a solution to this problem with most opting for some kind of product ‘team’ approach, involving a multitude of persons supposedly providing the necessary breadth of experience in order to obtain ‘production friendly products’. While sometimes obtaining reasonable results, this approach often faces a number of obstacles, such as: assembling the persons with the relevant experience; lack of formal structure (typically such meetings tend to be unstructured and oftenad hoc attacks on various ‘pet’ themes); and the location of the persons required in the team (not only can designers and production engineers be found in different functional departments, but they can frequently be on different sites and are in the case of sub-contractors in different companies). In addition, the chances are that the expertise in the team will only cover the primary activities of the business, and hence opportunity to exploit any benefits from alternative processes may be lost.
The greatest opportunity in design for manufacture occurs at the initial design stage, for while there are also possibilities for a product in production to be modified, there are many additional constraints. This is also illustrated in Figure 1.1. On top of the problems of tooling and equipment, it is not uncommon to find that the ‘ownership’ of a design changes many times. Consequently, the logic behind a design can become clouded, with the result that subsequent ‘owners’ tend to assume that existing features must be for good reason and resist change, even though in fact there may be great opportunities for cost reductions. Some companies do have a structured and formal approach to design ownership and alteration. However, these are not always sufficiently annotated. The problems associated with the traditional, functionally organ-ized product introduction process are summarorgan-ized in Figure 1.2 (1.25).
Fig. 1.2 Problems with the traditional approach to product introduction.
1.3
Competitive product introduction processes
Faced with the above issues, some companies are currently making dramatic changes to the way in which new products are brought to market. The traditional engineering function led sequential product introduction process is being replaced by a faster and far more effective team based simultaneous engineering approach (1.25). For example, the need for change has been recognized in TRW (formerly Lucas Varity) and has led to the development of a Product Introduction Management (PIM) process (1.26, 1.27) for use in all TRW operating businesses with the declared targets of reducing:
. Time to market by 30 per cent . Product cost by 20 per cent . Project cost by 30 per cent.
The generic process is characterized by five phases and nine reviews as indicated in Fig-ure 1.3. Each review has a relevant set of commercial, technical and project criteria for sign off and hand over to the next stage. (The TRW PIM process effectively replaces the more con-ventional design methodology and provides a more business process orientated approach to product development.)
The process defines what the enterprise has to deliver. The phases, the review points, and the technical and commercial deliverables are clearly defined, and the process aims to take account of market, product design, and manufacturing and financial aspects during each process stage. The skill requirements are defined, together with the necessary supporting tools and techniques. The process runs across the functional structure and includes customer and supplier representation. The PIM process is owned by a senior manager and each product introduction project is also owned by a senior member of staff.
Fig. 1.3 TheTRW PIM process.
In essence the product introduction process requires the collaborative use of:
. Teamwork– Product development undertaken by a full time co-located team with
repre-sentation from Marketing, Product Development Engineering, Manufacturing Systems Engineering, Manufacturing, Suppliers and Customers formed at the requirements defini-tion stage and selected for team-working and technical skills.
. Simultaneous Engineering– The simultaneous design of product, its method of manufacture
and, the manufacturing system, against clear customer requirements at equal levels of product and process definition.
. Project Management– The professional management of every product introduction project
against clearly defined and agreed cost, quality and delivery targets specified to achieve complete customer satisfaction and business profitability.
. Tools and Techniques – The routine use of concurrent engineering tools to structure the
team’s activity, thereby improving the productivity of the team and quality of their output. The linkage between the above elements is represented diagrammatically in Figure 1.4. Design for Assembly (DFA) is one of the main tools and techniques prescribed by the PIM process. Other main tools and techniques currently specified include: Quality Function Deployment (QFD) (1.29), Failure Mode and Effects Analysis (FMEA) (1.30), Design of Experiments (DOE) (1.31) and Conformability Analysis (CA) (1.32).
1.4
Techniques in design for manufacture and assembly
The application of tools and techniques that quantify manufacturing and assembly problems and identify opportunities for redesign is the major means available for bridging the knowl-edge gap. It has been found that DFM/DFA analysis leads to innovative design solutions where considerable benefits accrue, including functional performance and large savings in manufacturing and assembly cost. DFA is particularly powerful in this connection and is one of the most valuable product introduction techniques. Although the use of design for manu-facture and assembly techniques requires additional up-front effort when compared with the more conventional design activity, overall the effect is to reduce the time-to-market quite considerably. This is primarily due to fewer engineering changes, fewer parts to detail,
Fig. 1.4 Key elements of successful PIM (after 1.28).
document and plan, and a less complex product with good assembly and manufacturing characteristics. An illustration of the business benefits of reducing time-to-market is given in Figure 1.5 (1.33).
Very substantial reductions in part-count and component manufacture and assembly costs have resulted from using DFA techniques in product development teams. Figures 1.6 and 1.7 give examples of what can be achieved in terms of product rationalization. The contractor assembly DFA study shown in Figure 1.6 resulted in a 66% reduction in part-count. Figure 1.7 shows the overall results of a study on an assembly test machine and a redesign of part of the system, a pump stand, where 14 parts were replaced by a single casting.
The results of 60 documented applications, carried out recently in a wide variety of industries, show that the average part-count reduction was almost 48 per cent and the assembly cost saving was 45 per cent (see Figure 1.8). It is interesting to note that there proved to be little difference, in terms of means and standard deviations, across the aerospace/defence, auto-motive and industrial equipment business sectors. This indicates that the applicability of the methods is not particularly sensitive to product demand levels or technology. Indeed the largest single benefit achieved resulted from the redesign of a range of assembly and test machines.
Fig. 1.5 Benefits of reducing time-to-market (after 1.33).
Fig. 1.6 Contactor assembly.
Similar savings have been reported by others involved with the application of techniques in design for manufacture and assembly (1.34). It is also worth commenting that the designs coming out of the process tend to be more reliable and easier to manufacture.
As can be seen from the above results, DFA techniques (1.35–1.38) when used in industry are highly effective in realizing part-count reduction and taking costs out of manufacture and assembly. The analysis metrics associated with part-count and potential costs are inputs to concept design and development. As part of the DFA process, the product development team needs to generate improved product design solutions, with better DFA metrics, by simplifying the product structure, reducing part-count and simplifying component assembly operations. DFA is particularly interesting in the context of this book, since its main benefits result from systematically reviewing functional requirements, and replacing component clusters by single integrated pieces and selecting alternative joining processes (1.34)(1.38). Invariably the pro-posed design solutions rely heavily on the viability of adopting different processes and/or materials as shown in two part-count reduction examples in Figure 1.9. A number of guide-lines for assembly-orientated design are provided in Appendix A for the reader.
DFM further involves the simultaneous consideration of design goals and manufacturing constraints in order to identify and alleviate manufacturing problems while the product is being designed, thereby reducing the lead time and improving product quality. This includes an understanding of the technical capabilities and limitations of the manufacturing processes chosen by invoking a series of guidelines, principles and recommendations, commonly termed ‘producibility’ guidelines, to modify component designs for subsequent manufacture. The use
Fig. 1.7 Pump assembly and test machine overall assembly results.
Fig. 1.8 Results from 60 product studies.
of techniques to assist costing of component designs also aids the process of cost optimization. Since few formal DFM methods exist, unlike DFA, implementing a strategy is not straight-forward, and companies tend to develop DFM guidelines in-house. This takes the focus away from quality to a large extent because of the difficulties in establishing the methods to verify it in the first place.
Fig. 1.9 Examples of part-count reduction (after 1.34,1.38).
A number of general rules have been developed to aid designers when thinking about the manufacture of the product:
. Holes in machined, cast, molded, or stamped parts should be spaced such that they can be
made in one operation without tooling weakness. This means that there is a limit on how close holes may be spaced due to strength in the thin section between holes.
. Generalized statements on drawings should be avoided, like ‘polish this surface’ or
‘tool-marks not permitted’, which are difficult for manufacturing personnel to interpret. Notes on engineering drawings must be specific and unambiguous.
. Dimensions should be made from specific surfaces or points on the part, not from points in
space. This greatly facilitates the making of gauges and fixtures.
. Dimensions should all be from a single datum line rather than from a variety of points to
avoid overlap of tolerances.
. The design should aim for minimum weight consistent with strength and stiffness
require-ments. While material costs are minimized by this criterion, there also will usually be a reduction in labor and tooling costs.
. Wherever possible, design to use general-purpose tooling rather than special dies, form cutters,
etc. An exception is high-volume production, where special tooling may be more cost-effective.
. Generous fillets and radii on castings, molded, formed, and machined parts should be used. . Parts should be designed so that as many operations as possible can be performed without
requiring repositioning. This promotes accuracy and minimizes handling.
Figure 1.10 provides a number of specific design rules and objectives associated with effective DFM. As mentioned previously, selecting the right manufacturing process is not always simple and obvious. In most cases, there are several processes that can be used for a component, and selection depends on a large number of factors. Some of the main process selection drivers are shown in Figure 1.11. The intention is not to infer that these are necessarily of equal importance or occur in this fixed sequence.
The problem is compounded by the range of manufacturing processes and wide variety of material types commonly in use. Figures 1.12–1.16 provide a general classification and guide to the range of materials and processes (component manufacturing, assembly, joining and, bulk and surface engineering, respectively) that are widely available. (All, except the latter, of
Fig. 1.10 DFM rules and objectives.
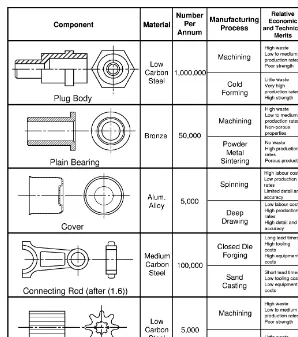
these processes are discussed in detail in Part II of the book.) To be competitive, the identification of technologically and economically feasible process and material combinations is crucial. The benefits of picking the right process can be enormous, as shown in Figure 1.17 for a number of components and processing routes.
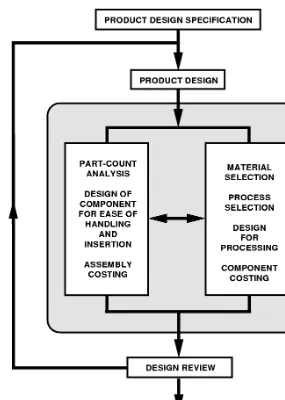
The placing in the product design cycle of process selection in the context of engineering for manufacture and assembly is illustrated in Figure 1.18. The selection of an appropriate set of processes for a product is very difficult to perform effectively without a sound Product Design Specification (PDS). A well-constructed PDS lists all the needs of the customers, end users and the business to be satisfied. It should be written and used by the Product Team and provide a reference point for any emerging design or prototype. Any conflict between customer needs and product functionality should be referred back to the PDS.
The first step in the process is to analyze the design or prototype with the aim of simplifying the product structure and optimizing part-count. As shown earlier, without proper analysis design solutions invariably tend to have too many parts. Therefore, it is important to identify components that are candidates for elimination or integration with mating parts. (Every component part must be there for a reason and the reason must be in the PDS.) This must be done with due regard for the feasibility of material process combinations and joining technology. A number of useful approaches are available for material selection in engineering design. For more information see references (1.10), (1.39) and (1.40).
The next steps give consideration to the problems of component handling and fitting processes, the selection of appropriate manufacturing processes and ensuring that components are tuned to the manufacturing technology selected. Estimation of component manufacture and assembly costs during the design process is important for both assessing a design against target costs and in trade-off analysis. Overall, the left-hand side of Figure 1.18 is closely related to DFA, while the right-hand side is essentially material/process selection and com-ponent design for processing, or consideration in DFM. A reader interested in more back-ground information on DFA/DFM and materials and process selection in product development is directed to references (1.40–1.45).
Fig. 1.11 Key process selection drivers.
Fig. 1.12 General classification of materials.
Fig. 1.13 General classification of manufacturing processes.
1.5
Process selection strategy
In considering alternative design solutions for cost and quality, it is necessary to explore candidate materials, geometries and tolerances, etc., against possible manufacturing routes. This requires some means of selecting appropriate processes and estimating the costs of manufacture early on in product development, across a whole range of options. In addition, the costs of non-conformance (1.46) need to be understood, that is appraisal (inspection and testing) and failure, both internal (rework, scrap, design changes) and external (warranty claims, liability claims and product recall). Therefore, we also need a way of exploring conformance levels before a process is selected. For more information on this important aspect of design, the reader is directed to Reference 1.32.
The primary objective of the text is to provide support for manufacturing process selection in terms of technological feasibility, quality of conformance and manufacturing cost. The satisfaction of this objective is through:
. The provision of data on the characteristics and capabilities of a range of important
manufacturing, joining and assembly processes. The intention is to promote the generation of design ideas and facilitate the matching and tuning of a design to a process, and
. The provision of methods and data to enable the exploration of design solutions for
component manufacturing and assembly costs in the early stages of the design and devel-opment process.
[image:30.561.48.440.67.285.2]To provide for the first point, a set of so-called manufacturingPRocessInformationMAps (PRIMAs) have been developed. In a standard format for each process, the PRIMAs present knowledge and data on areas including material suitability, design considerations, quality issues, economics and process fundamentals and process variants. The information includes
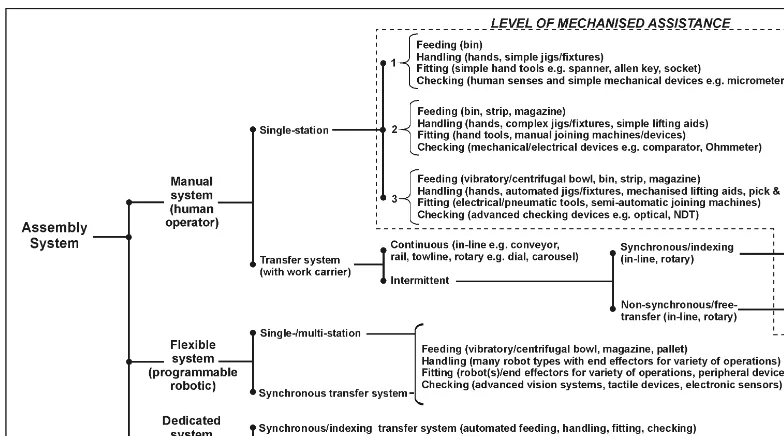
Fig. 1.14 General classification of assembly systems.
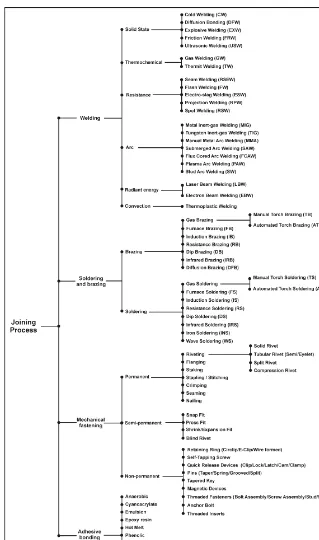
Fig. 1.15 General classification of joining processes.
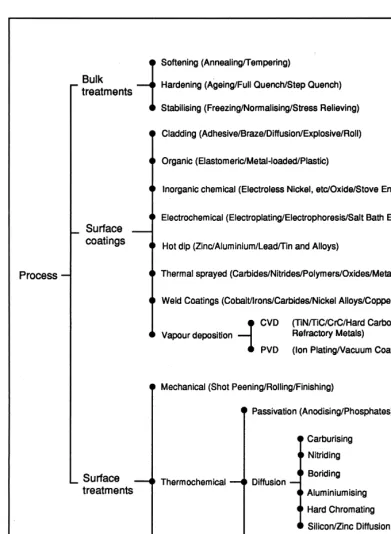
Fig. 1.16 General classification of bulk and surface engineering processes.
not only design considerations relevant to the respective processes, but quite purposefully, an overview of the functional characteristics of each process, so that a greater overall under-standing may be achieved. Within the standard format, a similar level of detail is provided on each of the processes included. The format is very deliberate. Firstly, an outline of the process itself – how it works and under what conditions it functions best. Secondly, a summary of what it can do – limitations and opportunities it presents – and finally an overview of quality considerations including process capability charts for relating tolerances to characteristic dimensions.
[image:33.561.99.397.64.401.2]To provide for the second point, techniques are put forward that can be used to estimate the costs of component manufacture and assembly for concept designs. It enables the effects of product structure, design geometry and materials to be explored against various manufactur-ing and assembly routes. A sample data set is included, which enables the techniques to be used to predict component manufacturing and assembly costs for a range of processes and materials. The process of cost estimation is illustrated through a number of case studies, and the scope for and importance of application with company specific data is discussed.
Fig. 1.17 Contrast in component cost for different processing routes.
Part II begins with the strategies employed for PRIMA selection, where attention is focused on identification of candidate processes based on strategic criteria such as material, process technology and production quantity. Having identified the possible targets, the data in the PRIMAs are used to do the main work of selection. The PRIMAs include the main five manufacturing process groups: casting, plastic and composite processing methods, forming, machining and non-traditional processes. In addition, the main assembly technologies and the majority of commercially available joining processes are covered. In all, sixty-five PRIMAs are presented, giving reference to over one hundred manufacturing, assembly and joining processes.
Fig. 1.18 Outline process for design for manufacture and assembly.
Part III of the text concentrates on the cost estimation methodologies for components and assemblies, their background, theoretical development and industrial application. In practice, Part II of the work can be used to help select the candidate processes for a design from the whole range of possibilities. Part III is concerned with getting a feel for the manufacturing and assembly costs of the alternatives. The book finishes with a statement of conclusions and a list of areas where future work might be usefully directed.
Part II
Selecting candidate
processes
Strategies and data relevant to selecting candidate processes for design solutions.
2.1
Introduction
Selecting the right process and optimizing the design to suit the process selected involves a series of decisions which exert considerable influence on the quality and cost of components and assemblies. Such decisions can significantly effect the success of a product in the market place. As mentioned previously, in selecting processes and tuning designs for processing many factors need to be taken into consideration. The manufacturing PRIMAs presented in this part of the book attempt to provide the knowledge and data required to underpin this decision making process provided by the various process selection strategies. However, it is the PRIMAs that provide the means of making more detailed assessments regarding the techno-logical and economic feasibility of a process.
Design considerations are provided to enable the designer to understand more about the technical feasibility of the design decisions made. The process quality considerations give valuable information on process conformance, including data on process tolerance capability associated with characteristic dimensions. A good proportion of the PRIMAs is taken up with quality considerations. No excuse is made for this. Non-conformance often represents a large quality cost in a business. As touched on earlier, such losses result from rework, order exchange, warranty claims, legal actions and recall. In many businesses, these losses account for more than 10 per cent of turnover (2.1). The goal is to provide data which enables the selection of processes that have the capability to satisfy the engineering needs of the applica-tion, including those associated with conformance to quality requirements.
2.2
PRIMAs (Process Information Maps)
Each PRIMA is divided into seven categories, as listed and defined below, covering the characteristics and capabilities of the process:
. Process description: an explanation of the fundamentals of the process together with a diagrammatic representation of its operation and a finished part.
. Process variations: a description of any variations of the basic process and any special points related to those variations.
. Economic considerations: a list of several important points including production rate, mini-mum production quantity, tooling costs, labor costs, lead times, and any other points which may be of specific relevance to the process.
. Typical applications: a list of components or assemblies that have been successfully manu-factured or fabricated using the process.
. Design aspects: any points, opportunities or limitations that are relevant to the design of the part as well as standard information on minimum section, size range and general configuration.
. Quality issues: standard information includes a process capability chart (where relevant), typical surface roughness and detail, as well as any information on common process faults.
A key feature of the PRIMAs is the inclusion of process capability charts for the majority of the manufacturing processes. Tolerances tend to be dependent on the overall dimension of the component characteristic, and the relationship is specific and largely non-linear. The charts have been developed to provide a simple means of understanding the influence of dimension on tolerance capability. The regions of the charts are divided by two contours. The region bounded by these two contours represents a spectrum of tolerance-dimension combinations where Cpk1.33* is achievable. Below this region, tolerance-dimension combinations are likely to require special control or secondary processing if Cpk¼1.33 is to be realized.
In the preparation of the process capability charts it has been assumed that the geometry is well suited to the process and that all operational requirements are satisfied. Where the material under consideration is not mentioned on the charts, care should be taken. Any adverse effects due to this or geometrically driven component variation should be taken into consideration. For more information the reader is referred to reference (1.32). The data used in the charts has been compiled from contacts in industry and from published work. Although attempts have been made to standardize the data as far as possible, difficulties were faced in this connection, since it was not always easy to obtain a consensus view. Consequently, as many as twenty different data sources have been used in the compilation of the individual process capability charts to provide an understanding of the general tolerance capability range offered by each manufacturing process.
2.3
PRIMA selection strategies
Different manufacturing technologies such as primary shape generating processes, joining techniques, assembly systems and surface engineering processes require that selection takes place based on the factors relevant to that particular technology. For example, the selection of a joining technique may be heavily reliant on the ability of the process to join dissimilar
*Cpk– process capability index. If the process characteristic is a normal distribution, Cpkcan be related to a
parts-per-million (ppm) defect rate.Cpk¼1.33 equates to a defect rate of 30 ppm at the nearest limit. AtCpk¼1,
materials and materials of different thickness. This is a particular requirement not neces-sarily defined by the PDS, but one that has been arrived at through previous design decisions, perhaps based on spatial or functional requirements. Whereas assembly system selection may simply be dictated by a low labor rate in the country of manufacture and therefore manual assembly becomes viable for even relatively large production volumes.
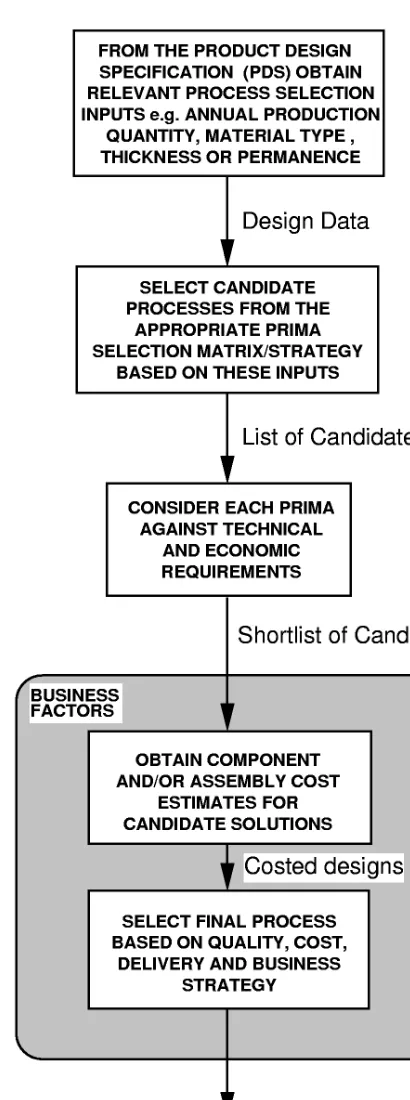
Although there may be many important selection drivers with respect to each process technology, a simple and effective strategy for selection must be sought for the general situation and for usability. Selection strategies can be developed by concentrating on several key economic and technical factors which are easily interpreted from the PDS or other requirements. Put in a wider context, the selection strategies, together with the information provided in the PRIMAs, must complement business strategy and the costing of designs, in order to provide a procedure that fully justifies the final selection. A flowchart is shown in Figure 2.1, relating all the factors relevant to the process selection strategies discussed in detail.
2.3.1 Manufacturing process selection
Manufacturing processes represent the main shape generating methods such as casting, molding, forming and material removal processes. The individual processes specific to this section are classified in Figure 1.13. The purpose of this section is to provide a guide for the selection of the manufacturing processes that may be suitable candidates for a component.
The manufacturing process selection strategy is given below, but points 4, 5 and 6 apply to all selection strategies:
1 Obtain an estimate of the annual production quantity. 2 Choose a material type to satisfy the PDS.
3 Refer to Figure 2.2 to select candidate PRIMAs.
4 Consider each PRIMA against the engineering and economic requirements such as:
. Understand the process and its variations
. Consider the material compatibility
. Assess conformance of component concept with design rules
. Compare tolerance and surface finish requirements with process capability data.
5 Consider the economic positioning of the process and obtain component cost estimates for alternatives.
6 Review the selected manufacturing process against business requirements.
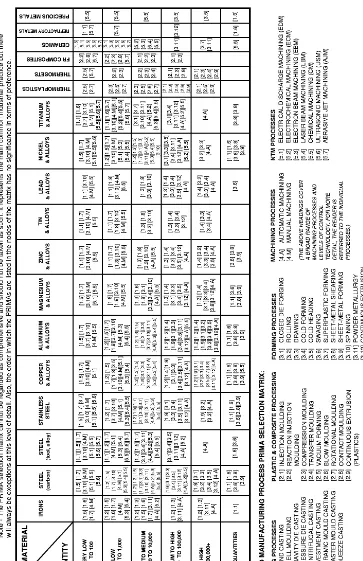
The principal intention is that the candidate processes are selected before the component design is finalized, so that any specific constraints and/or opportunities may be borne in mind. To this end, the manufacturing process PRIMA selection matrix (see Figure 2.2) has been devised based on two basic variables:
. Material type– Accounts for the compatibility of the parent material with the manufactur-ing process, and is therefore a key technical selection factor. A large proportion of the materials used in engineering manufacture have been included in the selection methodology, from ferrous alloys to precious metals, as classified in Figure 1.12.
Fig.
2.2
M
an
uf
ac
tu
ri
n
g
p
roce
ss
PR
IM
A
sel
ec
ti
o
n
m
at
rix.
[image:40.765.58.421.65.626.2]. Production quantity per annum– The number of components to be produced to account for the economic feasibility of the manufacturing process. The quantities specified for selection purposes are in the ranges:
Very low volume ¼1–100
Low volume ¼100–1000
Medium volume ¼1000–10 000
Medium to high volume¼10 000–100 000
High volume ¼100 000þ
All quantities.
Due to page size constraints and the number of processes involved, each manufac-turing process has been assigned an identification code rather than using process names, as shown at the bottom of Figure 2.2. There may be just one or a dozen processes at each node in the selection matrix representing the possible candidates for final selection.
As seen in Figure 1.11, there are many cost drivers in manufacturing process selection, not least component size, geometry, tolerances, surface finish, capital equipment and labor costs. The justification for basing the matrix on material and production quantity is that it combines technological and economic issues of prime importance. Many manufacturing processes are only viable for low-volume production due to the time and labor involved. On the other hand, some processes require expensive equipment and are, therefore, unsuitable for low production volumes. By considering production quantities in the early stages, the process that will prove to be the most economical later in the development process can be identified and selected. The boundaries of economic production, however, can be vague when so many factors are relevant, therefore the matrix concentrates rather more on the use of materials. By limiting itself in this way, the matrix cannot be regarded as comprehensive and should not be taken as such. It represents the main common industrial practice, but there will always be exceptions at this level of detail. It is not intended to represent a process selection methodology in itself. It is essentially a first-level filter. The matrix is aimed at focusing attention on those PRIMAs that are most appro-priate based on the important consideration of material and production quantity. It is the PRIMAs that do the task of guiding final manufacturing process selection.
Note that conventional and Non-Traditional Machining (NTM) processes are often con-sidered as secondary rather than primary manufacturing processes, although they can be applicable to both situations. The user should be aware of this when using the PRIMA selection matrix. Also, the conventional machining processes are grouped under just two headings in the matrix, manual and automatic machining. Reference should be made to the individual processes for more detail.
2.3.2 Assembly system selection
customer, in a cost-effective way for the producer, being technically appropriate for the components manipulated and composed, and ultimately satisfying the functional require-ments dictated by the specification.
The assembly phase represents a significant proportion of the total production cost of a product and can outweigh manufacturing costs in some industries (2.3). Through the identi-fication of the most effective manufacturing and assembly technologies early in the development process, downstream activity, inefficiency and costs can be reduced. Significantly, assembly is a major source of late engineering change, rework and production variability in product development (2.4). The cost of recovering from these problems during assembly is high and is estimated to be in the range of 5–10 per cent of the final cost (2.5). In part, this is due to the fact that assembly is governed by much less controllable and less tangible issues than manu-facturing, such as assembly actions and fixture design (2.6).
In practice, assembly selection is a very difficult task. It does not mean, however, that we cannot make a sound decision about the most appropriate assembly technology to use for a given set of conditions or requirements. A number of researchers have proposed strategies for assembly system selection. The reader interested in this topic can find more information in References (2.7–2.9).
Prior to the selection of an assembly technology, a number of activities should be under-taken and factors considered, some of which also help drive the final quality of the assembly:
. Business level– Identification and availability of assembly technologies/expertise in-house, integration into business practices/strategy, geographical location and future competitive issues, such as investment in equipment.
. Product level– Anticipated lead times, product life, investment return time-scale, product families/variants and product volumes required.
. Supplier level– Component quality (process capability, gross defects) and timely supply of bought-in and in-house manufactured parts.
The final point is of particular importance. A substantial proportion of a finished product, typically, two-thirds, consists of components or sub-assemblies produced by suppliers (2.10). The original equipment manufacturer is fast becoming purely an assembler of these bought-in parts, and therefore it is important to realize the key role suppliers have in developing products that are also ‘assembly friendly’. Consideration must be given to the tolerances and process variability associated with component parts from a very early stage, especially when using automated assembly technologies, because production variability is detrimental to an assembly process.
From the above, a number of drivers for assembly technology selection can be highlighted:
. Availability of labor
. Operating costs
. Production quantity
. Capital cost of assembly equipment
. Production rate required
. Number of components in the assembly
. Number of product variants
. Handling characteristics (safety, environmental hazards, supply logistics)
. Complexity of components and assembly operations
. Size and weight of components to be assembled.
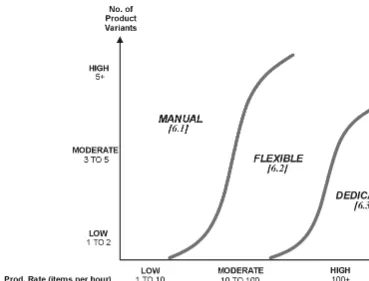
Figure 2.3 maps several of the important selection drivers with assembly technology. It is a general guide for the selection of the most appropriate assembly system based on:
. Number of product variants (flexibility), and
. Production rate, or
. Production quantityper annum, or
. Capital cost of the assembly equipment (although this is more of an outcome than a requirement).
Three basic assembly systems can be identified and are classified in Figure 1.14 and with their respective PRIMA number below:
. Manual(with or without mechanized assistance) [6.1]
. Flexible(programmable, robots) [6.2]
. Dedicated(special purpose) [6.3].
[image:43.561.63.432.66.347.2]Upon candidate selection, further reference is made to the individual PRIMAs for each assembly system type in order to fully understand the technical and economic implications of the final decision and explore system variants available. This is particularly advantageous when Figure 2.3 shows that a set of requirements is on the boundary of two assembly system types.
2.3.3 Joining process selection
There is extensive evidence to suggest that many industrial products are designed with far too many parts. DFA case studies indicate that in many designs large proportions of excess components are only used for fastening (2.11). These non-value added components increase part-count and production costs without contributing to the product’s functionality. In many cases, incorrect joining processes are used due to a lack of knowledge of such factors as availability, cost and functional performance of alternatives. As with primary and secondary manufacturing processes, selecting the most suitable joining process greatly influences the manufacturability of a design, but the selection of the joining technology to be used can also greatly influence the assemblability of a design. The method chosen can also have a significant influence on the product architecture and assembly sequence and it is well known that complicated joining processes lead to incorrect, incomplete and faulty assemblies (2.12).
Selecting the most appropriate joining technique requires consideration of many factors relating to joint design, material properties and service conditions. During the selection procedure the designer is required to scrutinize large quantities of data relating to many different technologies. Several selection methods exist for the selection of the process variants within individual joining technologies. However, selecting the most appropriate technology itself remains a design-orientated task that often does not get the attention it deserves. It can be concluded that a selection methodology that incorporates joining processes and tech-nologies that can be applied at an early stage in the design process is a useful tool to support designing and particularly DFA. Considering joining processes prior to the development of detailed geometry enables components to be tailored to the selected process rather than limiting the number of suitable processes. Addressing such issues during the early stages of product development actively encourages designers to employ good DFA practice and reduces the need for costly redesign work.
As mentioned above, a number of other selection methods exist for different joining technologies, and the reader interested in further information is referred to:
. Adhesive bonding (2.13)(2.14)
. Welding, soldering and brazing (1.6)(1.7)(2.15)
. All joining technologies (1.10)(2.16).
Currently, available selection techniques tend to focus on particular joining technologies or do not offer the designer a wide range of suitable joining processes or in enough detail to support the selection process. The aim of the joining process selection methodology pre-sented here is to provide a means of identifying feasible methods of joining regardless of their fundamental technology. The methodology is not intended to select a specific joining method, for example, torch brazing or tubular rivet, but to highlight candidate processes that are capable of joining under the given conditions. The final selection can be made after considering process specific data and detailed data against design requirements from the PRIMAs.
Joining process classification
highlighted 73 major joining techniques, as shown in Figure 1.15. In order to classify them, a common factor is used, based on technology and process. Technology class refers to the collective group that a process belongs to, for example, welding or adhesive bonding. The process class refers to the specific joining technique, for example, Metal Inert-gas Welding (MIG) or anaerobic adhesive. Each process is derived from a particular fundamental technology providing a means for classification. From this, the joining processes have been divided into five main categories: welding, brazing, soldering, mechanical fastening and adhesive bonding.
Technical classes can be separated into sub-categories based on distinct differences in underlying technology. Although the basic premise of all welding processes is the same, specific techniques differ considerably due to the particular processes involved in generating heat and/or enabling the fusion process. This can be used as a means of classifying sub-sets. Both brazing and soldering have a number of different processes, hence they have been split into two sub-sets. Mechanical fasteners can be divided in two ways, by group technologies and degree of permanence. The latter has been chosen as it relates to the functionality of the fastener in service and therefore product requirements. Due to the large number of specific adhesives, which in many cases are exclusive to the producer, adhesive bonding has been viewed from a generic level, therefore, only the adhesive group can be selected.
Joining process selection criteria
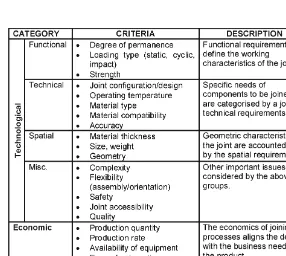
In order to select the most appropriate joining process, it is necessary to consider all processes available within the methodology. As technology specific selection criteria tend to be non-transportable between domains, evaluating the merits of joining processes that are based on fundamentally dissimilar technologies requires a different approach. Differentiating between technology classes and process classes requires the comparison of specifically selected parameters. In order to evaluate a joint, consideration must be given to its functional, technical, spatial and economic requirements. A review of important joining requirements has identified a number of possible selection criteria, as shown in Figure 2.4 and discussed below.
. Functional – Functional requirements define the working characteristics of the joint. The functional considerations for a joint are degree of permanence, load type and strength. Degree of permanence identifies whether a joint needs to be dismantled or not. In most cases the permanence of a joining process is independent of its technology class. Degree of permanence provides a suitable high-level selection criterion that is not reliant on detailed geometry. Load type and strength are often mutually dependent and can be influenced by the geometric characteristics of the joint interface. As joint design is dissimilar for different technology classes, it is difficult to use load type or strength as a universal selection criteria. However, these considerations must be taken into account when evaluating suitable joining processes for final selection when appropriate.
product’s operating environment such as corrosion resistance. The material type is relevant to all joining technologies because they need to be compatible. Joint design is often defined by the geometry. However, if joining is considered prior to detailed geometry, the selected process can influence the design. Due to the fundamental differences in joint configurations, it is not suitable as a selection criterion for non-technology specific selection. Operating temperature influences the performance of most joining processes, although it should be considered during material selection. While an important aspect, its effect varies for differ-ent joining technologies. Therefore, consideration of operating temperature is more appro-priate during final selection.
. Spatial – Geometric characteristics of the joint are accounted for by the spatial require-ments. The spatial requirements identified are size, weight, geometry and material thickness. The size and weight of components to be joined is considered and determined when their material is selected. As the selection methodology is intended for use prior to the develop-ment of detailed geometry, using geometry as a selection criterion would be contradictory. Material thickness has already proven to be a successful criterion in other selection methodologies, and the suitability of joining processes is easily classified for different thicknesses of material.
[image:46.561.101.387.334.590.2]. Economic – The economics of joining processes aligns the design with the business needs of the product. Economic considerations can be split into two sections: tooling and
Fig. 2.4 Classification of joint requirements.
product. Tooling refers to the ease of automation, availability of equipment, skill required, tooling requirements and cost. Product economics relate to production rates and quantity. These business considerations are driven by the product economics as they determine the need for tooling and its complexity, levels of automation and labor requirements. Production rate and quantity are very closely linked. They can both be used to determine the assembly speed and the need for and feasibility of automation. However, as the selection methodology is to be used in the early stages of product development it is more likely that quantity will be known from customer requirements or market demand.
In order for the selection methodology to be effective in the early stages of design appraisal, the chosen parameters must apply to all joining processes. Also, it is essential that the parameters relate to knowledge that is readily available and appropriate to the level of selection. Having reviewed the requirement against the joining processes, four selection parameters have been chosen for initial stages of the methodology:
. Material type – Accounts for the compatibility of the parent material with the joining process. A large proportion of the materials used in engineering manufacture have been included in the selection methodology, from ferrous alloys to precious metals. In situa-tions involving multiple material types the selection methodology must be applied for each.
. Material thickness– Divided into three ranges: thin3 mm, medium from 3 mm to 19 mm and thick19 mm. When selecting the material type and thickness, the designer considers many other factors that can be attributed to the joint requirements, such as corrosion resistance, operating temperature and strength. Consequently, the requirements should be known and can be compared to joining process design data for making the final choice at a later stage.
. Degree of permanence – This is a significant factor in determining appropriate joining processes, as it relates to the in-service behavior of the joint and considers the need for a joint to be dismantled. This selection criterion is divided into three types:
1 Permanent joint – Can only be separated by causing irreparable damage to the base material, functional element or characteristic of the components joined, for example, surface integrity. A permanent joint is intended for a situation where it is unlikely that a joint will be dismantled under any servicing situation.
2 Semi-permanent joint – Can be dismantled on a limited number of occasions, but may result in loss or damage to the fastening system and/or base material. Separation may require an additional process, for example, re-heating a soldered joint or plastic deforma-tion. A semi-permanent joint can be used when disassembly is not performed as part of regular servicing, but for some other need.
. Quantity – Production quantity per annum, and consequently the number of joints to be produced, accounts for the economic feasibility of the joining process. The quantities speci-fied for selection purposes are the same as for the manufacturing process selection strategy.
Joining process selection matrix
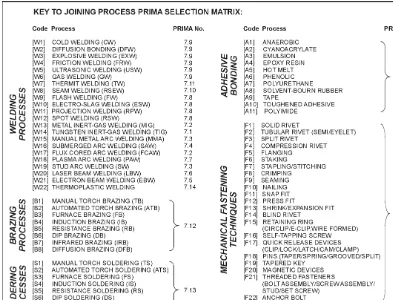
The joining process selection methodology is based on the same matrix approach used for manufacturing process selection. Again, due to page size constraints and the number of processes to be detailed, each process has been assigned an identification code rather than using process names. The key to the joining processes used in the matrix is shown in Figure 2.5 together with the relevant PRIMA number, where information can be found regarding that individual process or joining technology. Due to size constraints, the joining process selection matrix is divided into two parts; Figures 2.6(a) and (b) together show the complete matrix.
[image:48.561.49.442.70.370.2]The matrix representation of the selection technique provides an intuitive way of navigating a large quantity of data. This makes the selection process simple and quick to use. Supporting the selection matrix with design advice through the use of the PRIMAs completes the
Fig. 2.5 Key to joining process PRIMA selection matrix.
IRONS THIN £3mm STEEL (carbon) STEEL (tool, alloy) STAINLESS STEEL COPPER & ALLOYS ALUMINIUM & ALLOYS MAGNESIUM & ALLOYS ZINC & ALLOYS TIN & ALLOYS [W6][W13] [W15][B1] [W6][W13] [W15][B1] [F19][F20]
[F23] [F19][F20][F23] [W3][W6] [W8][W9] [W11][W13] [W14][W15] [B1] [W3][W6] [W9] [W11] [W13][W14] [W15] [B1] [W6][W7] [W9][W10] [W13][W15] [F20] [W2][W3] [W6][W8] [W9][W11] [W13][W14] [W15][B1] [W2][W3] [W9][W11] [W13][W14] [W15][B1] [W3][W7] [W9][W10] [W13][W15] [F20] [F19][F20] [F19][F20]
[W2][W3] [W6][W8] [W9][W11] [W13][W14] [W15][B1] [W2][W3] [W9][W11] [W13][W14] [W15][W17] [B1] [W9][W10] [W13][W15] [W17] [F20] [F19][F20] [F19][F20]
[W1] [W1] [S1][S8] [W1][W2] [W3][W9] [W13][W14] [B1] [W1][W2] [W3][W9]