MAPPING DEFORESTATION AND LAND COVER CONVERSION
AT THE RAINFOREST MARGIN IN CENTRAL SULAWESI, INDONESIA
Stefan Erasmi1, André Twele1, Muhammad Ardiansyah2, Adam Malik3 and Martin Kappas1
1. University of Goettingen, Institute of Geography, Cartography GIS & Remote Sensing Section, Goettingen, Germany; serasmi(at)uni-goettingen.de
2. Bogor Agricultural University (IPB), Institute of Soil Sciences, Bogor, Indonesia; ardysaja(at)yahoo.com
3. Universitas Tadulako, Faculty of Agriculture, Palu, Indonesia; adammalik(at)telkom.net
ABSTRACT
The tropical rain forests in Indonesia are affected by socio-economic and ecological factors and processes that result in an increasing destabilisation of the rainforest margins. Optical satellite data have been explored to document changes in land cover throughout the past 30 years and to monitor the current status and dynamics of land cover and land cover conversion for an investiga-tion area of 7,500 km2 in Central Sulawesi. The purpose of the study is to evaluate available satel-lite data sets and to establish a transparent work flow for the monitoring of past and future land cover dynamics at a regional scale based on medium resolution satellite data. This includes rigor-ous radiometric calibration as well as advanced classification techniques. A time series of Landsat data (Landsat/MSS; Landsat/ETM+) have been radiometrically processed including sensor calibra-tion, atmospheric correction (COST-model) as well as the correction of solar and topographic illu-mination effects. Land cover mapping has been performed using a comprehensive, context-based approach including image segmentation, fuzzy logic based class definitions (rule sets) and classi-fication. Results of the change analysis show that forest degradation and deforestation within the study area in Central Sulawesi is occurring but at a significantly lower rate (-0.6%/year) than for the rest of the Indonesian Archipelago (-1.2%/year). Nevertheless, deforestation in Central Su-lawesi has dramatically increased during the past few years, mostly due to illegal clear-cut logging which shows severe impacts on the environment (i.e. floods, landslides).
Keywords: Sulawesi, land cover conversion, classification, change detection.
INTRODUCTION
forest land to non-forest land. Considering this definition, remote sensing data provide spatial in-formation about land cover which can be used in scenarios to predict and explain changes in land cover and land use.
Within this paper, the problems and opportunities of remote sensing based land cover mapping in the tropics will be discussed based on a data set of optical satellite data for the investigation area in Central Sulawesi. The Landsat system provides a temporal coverage of medium resolution sat-ellite data with a nearly global coverage for land surfaces and still is indispensable for the majority of scientific and commercial projects and applications dealing with land use and land cover change. Within the current project, all available satellite data have been radiometrically calibrated taking into account top-of-atmosphere (TOA) reflectance, path radiance and solar as well as to-pographic effects. The projected and calibrated data yielded the input for the computational analy-sis and classification of the image data.
The goal of the research was to provide a transparent and reproducible processing and analysis work flow for the land cover categorization in a tropical environment based on a multi-temporal Landsat data set (Landsat/MSS; Landsat/ETM+).
STUDY AREA
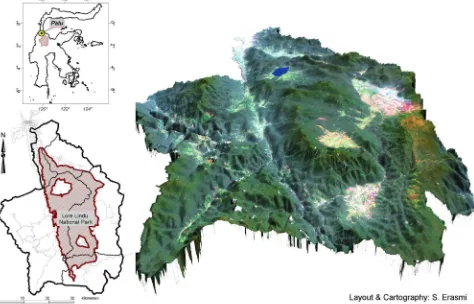
The study area is located in Central Sulawesi, Indonesia and consists of the Lore Lindu National Park (LLNP) and five surrounding districts within the province of Central Sulawesi (Sulawesi Ten-gah). The province capital (Palu) is located at the northern border of the study area (Figure 1). The total investigation area covers approximately 7,500 sq. kilometres (0°50’S – 2°04’S and 119°40’E – 120°30’E) where 2,200 sq. kilometres constitute the LLNP, a natural forest reserve that is facing remarkable forest conversion activities along the forest and park boundaries. The Lore Lindu re-gion is topographically diverse with mountain ranges reaching up to 2,600 m a.s.l. interspersed with narrow and outstretched valleys at different elevations and expositions.
The research area is characterized by a humid tropical climate with mean annual temperatures between 25 and 26°C at sea level, high humidity (85-95%) and a mean annual precipitation >2,500 mm that is subject to a high variability due to the diverse topography (7). The annual precipitation distribution permits year-round agriculture. The land use is dominated by paddy rice cultivation in the valley bottom and coffee and cacao cultivation on sloping land. Maize, various legumes and fruits are cultivated on recently cleared areas and around people's houses. Furthermore, there is cultivation of coconut palms, cassava, peanuts and others.
DATA AND METHODS
Landsat data have been acquired over the study area for the time frame of 1972 to 2002. The data set that has been used for analysis within this investigation consists of four Landsat scenes: a Landsat/MSS scene of 28 October 1972 (WRS-1, Path 122 / Row 61) and three Landsat/ETM+ scenes of 20 September 1999, 24 August 2001 and 28 September 2002 (WRS-2, Path 114 / Row 61). The data have been received in level 1G-format (UTM 51M). The Landsat/MSS scene was geometrically adjusted using a 2nd order polynomial transformation with an average root mean square error (RMSE) of 0.3 pixel units. The Landsat/ETM+ scenes were geometrically processed using a parametric satellite orbital model (RMSE = 0.5) which compensates for distortions due to sensor geometry, satellite orbit and attitude variations, earth shape, rotation and topography (8). Overall, 65 ground control points (GCP’s) were used to derive the model with Geo-matica/OrthoEngineV9.1.
normal of the smallest observed ground unit (pixel) and the direct solar irradiance. The cosine of the local solar incidence angle can be computed from the DEM as follows (9):
cos i = cosθp·cosθz + sinθp·sinθz·cos(φa-φ0) , (1) where θz and φa are the solar zenith and azimuth angles and θp and φ0 are the surface slope and aspect angles.
Figure 1: Overview of the study area surrounding the Lore Lindu National Park (LLNP) in the prov-ince of Central Sulawesi (right: Landsat/ETM+ color composite draped over digital terrain model)
The solar inclination map has shown to be of advantage for the detection of appropriate ground control points (GCP’s) especially in rugged terrain compared to other GCP's taken from topo-graphic maps. Subsequently, the geometrically congruent data set is converted to apparent at-satellite radiance using gain and offset coefficients provided by the data supplier.
Since atmospheric influences are particularly significant in tropical areas and vary both spatially and temporally, there is a need to account for these effects especially within multi-temporal studies of land cover change. Although physically-based models which require atmospheric data coinci-dent with remote sensing observations are known to be most accurate (10), their overall applicabil-ity has been limited so far since these parameters are commonly not available for historical satel-lite data. Several image-based techniques have been developed in order to compensate for this shortcoming. We selected the improved dark object subtraction method (DOS) proposed by (11) which is also referred to as the COST model (cosine of the solar zenith angle “COS(ThetaZ)”) to account for the contradicting effects of both path radiance and atmospheric transmittance. In addi-tion, the algorithm incorporates a sun elevation and earth-sun distance correction.
empirical-statistical approach uses the gradient and intercept of the regression equation between non-corrected reflectance values and the local incidence angle.
The geometrically corrected and radiometrically calibrated imagery has been subset to the extent of the study area and clipped with the ancillary data (DEM, cosine map, area mask, spatial ground truth data) to form a geospatial database at a unique pixel resolution of 30 m. Within this study area, a focus area has been defined at a resolution of 15 m consisting of the pan-sharpened Landsat/ETM+ images and the same auxiliary data as above.
The qualitative analysis (classification) of the imagery is conducted with the purpose of mapping homogeneous areas of vegetation cover that represent the dominant land cover types within the project area. For this purpose an image segmentation is performed prior to image classification. The generalization of images always means a loss of information (14). This is why in most cases pixel-based classifiers are used to analyse medium resolution satellite data. On the other hand, pixel-based classifications always face the problem of mixed-pixels as well as salt-and-pepper features and thus in most cases require pre- or post-classification smoothing (15).
The entire classification procedure that is used within this study includes the following steps: 1. creation of a cloud mask for the entire data set; 2. segmentation of the imagery based on spectral and spatial attributes of the data sets; 3. definition of object classes and training sites; 4. fuzzy-logic classification of segmented images; 5. accuracy assessment; 6. change analysis based on area statistics.
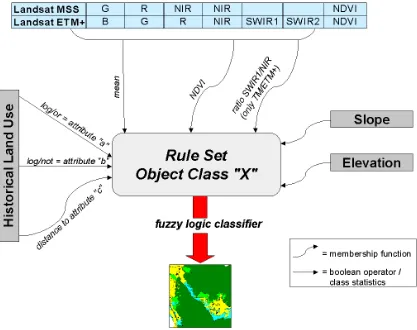
Clouded and shadowed areas are computed using reflectance thresholds for the red and mid-infrared image channels for each data set respectively. These areas are neglected for further analysis. The image segmentation is performed to establish homogeneous areas within the im-ages that are supposed to represent a distinct land cover type or object class, respectively. The image segmentation concept is based on homogeneity definitions in combination with local and global optimization techniques. The homogeneity of each image object is defined based on spec-tral and/or spatial information taken from the images (16). A scale parameter is used to control the average image object size. For the current Landsat data set a low scale factor (scale=5) was used. This resulted in an average object size of 4.7 hectares. The result of the segmentation procedure is a mosaic of image objects per image layer that deliver the input data set for further classification issues. The classification of the segmented image layers is based on a fuzzy logic approach that allows complex object feature descriptions and uses membership functions (rule-sets) to conduct rules for the determination of the membership degree, i.e. the likelihood of a certain object to be-long to an object class based on spectral and/or spatial attributes (see 16 for details). An example for the definition of a rule-set using spectral and spatial data layers is given in Figure 2. As can be seen from this figure, the class description is not only generated using spectral values and ratios but also taking into consideration contextual information for each land cover category that is based on geospatial data and meta data.
RESULTS
Figure 2: Rule set definition for the classification of the multi-temporal Landsat data set
The radiometric calibration of the satellite data included sensor calibration, atmospheric correction and solar / topographic correction. The sensor calibration used the gain and offset coefficients supplied by the USGS for the conversion of digital numbers (DN) to at-sensor-radiance. The vali-dation of the sensor calibration showed a general underestimate of the NIR channels for the Land-sat/MSS data especially for vegetated areas. At the present stage of the investigation, this prob-lem could not be solved. The atmospheric and topographic correction led to the computation of surface reflectance values. The visual interpretation and statistical analysis of the terrain normali-zation data in contrast to the flat surface calibration underlined the necessity of a local solar inci-dence correction model (Figure 3). The solar and terrain corrected image statistics show no corre-lation between solar inclination and reflectance (r2=0.0061). This means that the correction method well adjusts the effect of terrain-induced reflectance distortion. The chosen method for terrain cor-rection (C-corcor-rection) is time-consuming because it requires empirical relations between reflec-tance and illumination to be established for selected test sites prior to the computation of horizon-tal surface reflectance. On the other hand, this empirical component is best accounted for the indi-vidual (non-Lambertian) behaviour of the reflectance distribution for different landscapes and land cover types within the present study.
satellite image interpretation. The table shows the problems that occurred during the classification process within this study. A land cover category always has to aggregate different land use types due to their spectral properties. Within the presented project this problem mainly affected the defi-nition and delineation of forest types and agroforestry systems at the rainforest margin.
Figure 3: Comparison of “flat terrain” calibrated surface reflectance values (a) with solar and topo-graphic corrected reflectance values (b) for a transect within a plot of homogenous dense forest
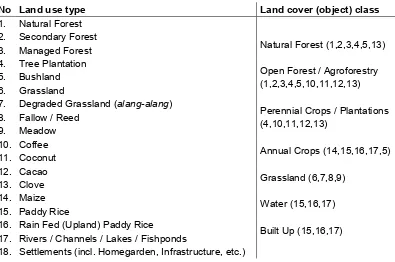
Table 1: Predominant land use types in Central Sulawesi and land cover categories for fuzzy logic classification (in brackets: land use types that contribute to / overlay with land cover classes by means of spectral properties and class definitions)
No Land use type Land cover (object) class
1. Natural Forest 2. Secondary Forest 3. Managed Forest 4. Tree Plantation 5. Bushland 6. Grassland
7. Degraded Grassland (alang-alang) 8. Fallow / Reed
9. Meadow 10. Coffee 11. Coconut 12. Cacao 13. Clove 14. Maize 15. Paddy Rice
16. Rain Fed (Upland) Paddy Rice
17. Rivers / Channels / Lakes / Fishponds
18. Settlements (incl. Homegarden, Infrastructure, etc.)
Natural Forest (1,2,3,4,5,13)
Open Forest / Agroforestry (1,2,3,4,5,10,11,12,13)
Perennial Crops / Plantations (4,10,11,12,13)
Annual Crops (14,15,16,17,5)
Grassland (6,7,8,9)
Water (15,16,17)
Built Up (15,16,17)
The number of identifiable land cover classes could be increased by incorporating auxiliary data taken from the image itself (e. g. texture) or from other spatial data sources (e.g. height, slope, distance to features, historical land use map, etc.).
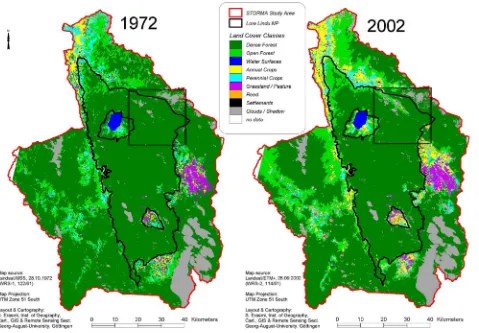
average membership probability of 0.93 (1972) and 0.87 (2002), respectively (see Figure 4). In 2002, natural forest comprises 67 % of the total study area whereas the cultivated land covers 28 %. Cultivated land includes agricultural fields and plantations (paddy, annual crops, perennials) as well as forest areas that are cultivated in the form of agroforestry systems (mainly cacao under shade trees), forest gardens or selective timber extraction at diverse intensity levels. Another 4 % of the total area comprises extensively used grasslands, the remaining part consists of built-up area and water surfaces (Table 2). The area statistics of the change analysis for the data set ap-proves the developments of land cover conversion within the study area during the 30-year time period that have previously been reported from socio-economic studies at the village and regional level within the framework of the STORMA-project. According to (17) the area under cultivation increased by about 58% within the time period of 1982 to 2002 (based on a village survey). The satellite analysis shows an average increase of 55 % for cultivated land for the time period 1972 to 2002.
Figure 4: Land cover maps of the STORMA study area for 1972 (a) and 2002 (b) resulting from segmentation and fuzzy logic classification of Landsat/MSS and /ETM+ imagery taken over Central Sulawesi, Indonesia (the rectangle shows the image subset used in Figure 5)
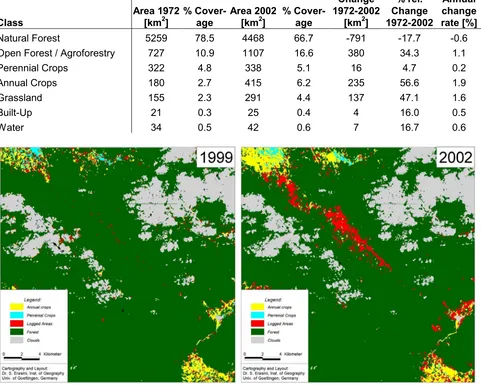
authorities and private benefits of migrants. This led to a loss of more than 2200 ha of natural for-est only within the north-eastern part of the LLNP during the period 1999 to 2002 (see Figure 5). Table 2: Area statistics for the 1972 and 2002 Landsat data sets covering the aggregated land cover classes for the STORMA study area of Central Sulawesi, Indonesia
Class
Area 1972 [km2]
% Cover-age
Area 2002 [km2]
% Cover-age
Change 1972-2002
[km2]
% rel. Change 1972-2002
Annual change rate [%]
Natural Forest 5259 78.5 4468 66.7 -791 -17.7 -0.6 Open Forest / Agroforestry 727 10.9 1107 16.6 380 34.3 1.1
Perennial Crops 322 4.8 338 5.1 16 4.7 0.2
Annual Crops 180 2.7 415 6.2 235 56.6 1.9
Grassland 155 2.3 291 4.4 137 47.1 1.6
Built-Up 21 0.3 25 0.4 4 16.0 0.5
Water 34 0.5 42 0.6 7 16.7 0.6
Figure 5: Land cover maps of the STORMA focus area for 1999 (a) and 2002 (b) resulting from segmentation and fuzzy logic classification of Landsat/ETM+ imagery taken over Palolo Valley, Central Sulawesi, Indonesia (see Figure 4 for the exact location of the subset)
CONCLUSIONS
In this study a processing and analysis work flow for a time series of Landsat imagery in a tropical environment is presented. This includes geometric correction, radiometric calibration, land cover classification and change analysis. Concerning the radiometric calibration, the results indicate that it is necessary to consider topographic effects on spectral reflectance. Surface reflectance data have to be corrected for terrain disturbances prior to image classification because of the significant dependence of reflectance values on solar incidence angles. The presented method for topog-raphic normalization (C-correction) yielded promising results.
object-oriented approach at a minimal aggregation level was preferred to the pixel-based procedures, because it takes into account the spectral as well as the spatial similarities of an object within a multi-source data set.
The results of the land cover mapping and change analysis were compared to actual and recent statis-tical forest assessments at a local and a regional level. The outcome is that the Landsat based land cover mapping provides necessary and reliable information about land cover conversion at the regional level. The area statistics and deforestation rates computed from the satellite analysis correspond well to the investigations at the district level and furthermore show the inhomogeneous spatial distribution of land conversion processes within the study area. Moreover, it is documented that the overall deforesta-tion rate of the area under investigadeforesta-tion is significantly lower (-0.6%/year 1972-2002) compared to other estimates for Sulawesi (-1.7%/year 1985-1997, taken from (18)) and the whole Indonesian Archipelago (-1.2%/year, 1990-2000, (19)) within comparable time periods. These discrepancies may be explained with the varying time periods that have been used but mainly are the result of the different data sources that build the basis for the estimates at the national and global levels. For instance, the data of the In-donesian forest cover and deforestation rates are derived from reports, photographs and satellite im-agery with the help of several institutions (e.g. Regional Physical Planning Programme for Transmigra-tion, RePPProT, World Conservation Monitoring Centre, WCMC, National Forest Inventory (NFI) and the Government of Indonesia in collaboration with the World Bank). Concluding, the following advan-tages of the presented Landsat data analysis can be stated. The object-oriented and context-based classification workflow with rule set based class descriptions offers an opportunity for an objective and transparent definition of land cover units from optical satellite data. The satellite derived maps may be related to field observations at the village or regional level and thus account for the heterogeneous, small-scale landscape pattern at the intensively cultivated rain forest margins.
The most critical factor in interpreting satellite images remains the fact that spatial mapping of land cover categories is only usable to derive land use types to a certain extent and thus limits the informa-tional value of satellite-based mapping for deforestation monitoring. But on the other hand, satellite mapping of land cover units remains the most important input source for spatial modelling of factors and processes that determine land use change. Further research will therefore focus on the transfer-ability of the suggested calibration processing chain and class descriptions to other spectral data sets and thus the establishment of robust and reproducible work flows to ensure the successful application of current and future remote sensing data and systems for the assessment of land cover and land use change at the regional scale in tropical rain forest margin areas.
ACKNOWLEDGEMENTS
The work is funded by the Deutsche Forschungsgemeinschaft (DFG) under SFB-552 (“STORMA – Stability of Rainforest Margins in Indonesia”).
REFERENCES
1 Waltert M, M Langkau, M Maertens, M Härtel, S Erasmi & M Mühlenberg, 2004. Predicting losses of bird species from deforestation in Central Sulawesi. In: Land use, nature conserva-tion and the stability of rainforest margins in Southeast Asia, edited by G Gerold, M Fremerey & E Guhardja (Springer, Berlin & Heidelberg), 327-349
2 Chapin F S, E S Zavaleta, V T Eviner, R L Naylor, P M Vitousek, H L Reynolds, D U Hooper, S Lavorel, O E Sala, S E Hobbie, M C Mack & S Díaz, 2000. Consequences of changing bio-diversity. Nature, 405: 234-245
4 Lambin E F, 1999. Monitoring forest degradation in tropical regions by remote sensing: some methodological issues. Global Ecology and Biogeography,8: 191–198
5 Sunderlin W & A P Resosudarmo, 1996. Rates and Causes of Deforestation in Indonesia: Towards a Resolution of the Ambiguities. CIFOR Occasional Paper: 9, Centre for International Forestry Research, Jakarta
6 Watson R, I Noble, B Bolin, N H Ravindranath, D Verardo, K Andrasko, M Apps, S Brown, G Farquhar, D Goldberg, S Hamburg, R Houghton, P Jarvis, T Karjalainen, H Kheshgi, T Krug, W Kurz, D Lashof, B Lim, W Makundi, M Manning, G Marland, O Masera, D Murdiyarso, B Murray, R Persson, N Sampson, J Sathaye, R Scholes, B Schlamadinger, W Sombroek, S Prisley, J Stone, R Sukumar & R Valentini (eds.), 2000. Land Use, Land-Use Change, and Forestry – a special report of the IPCC (Cambridge University Press) 377 pp.
7 Whitten T, G S Henderson & M Mustafa, 2002. The Ecology of Sulawesi. (The Ecology of Indonesia Series, 4, Jakarta, Indonesia)
8 Toutin Th, 1995. Multisource data fusion with an integrated and unified geometric model, EARSeL Advances in Remote Sensing, 4(2): 118-129
9 Civco D L, 1989. Topographic normalization of Landsat Thematic Mapper digital imagery. Photogrammetric Engineering and Remote Sensing, 55: 1303–1309
10 Lu D, P Mausel, E Brondizio & E Moran, 2002. Assessment of atmospheric correction meth-ods for Landsat TM data applicable to Amazon basin LBA research. International Journal of Remote Sensing, 23(13): 2651-2671
11 Chavez P S, 1996. Image-based atmospheric corrections. Revisited and improved. Photo-grammetric Engineering and Remote Sensing, 62: 1025–1036
12 Riaño D, E Chuvieco, J Salas & I Aguado, 2003. Assessment of Different Topographic Cor-rections in Landsat-TM Data for Mapping Vegetation Types. IEEE Transactions on Geo-science and Remote Sensing, 41(5): 1056-1061
13 Teillet P M, B Guindon & D G Goodeonugh, 1982. On the slope-aspect correction of multis-pectral scanner data. Canadian Journal of Remote Sensing, 8: 84–106
14 Koch B, M Jochum, E Ivits & M Dees, 2003. Pixelbasierte Klassifizierung im Vergleich und zur Ergänzung zum objektbasierten Verfahren. Photogrammetrie Fernerkundung Geoinformation, 2003(3): 195-204
15 Tottrup C, 2004. Improving tropical forest mapping using multi-date Landsat TM data and pre-classification image smoothing. International Journal of Remote Sensing, 25(4): 717-730 16 Baatz M & A Schäpe (2000): Multiresolution Segmentation – an optimization approach for high
quality multi-scale image segmentation. In: Angewandte Geographische Informationsverarbei-tung XII. Beiträge zum AGIT-Symposium Salzburg 2000, edited by J Strobl et al. (Wichmann, Karlsruhe) 12–23.
17 Maertens M, M Zeller & R Birner, 2004. Does technical progress in agriculture have a forest saving or a forest clearing effect? Theory and evidence from Central Sulawesi. In: Land use, nature conservation and the stability of rainforest margins in Southeast Asia, edited by G Gerold, M Fremerey & E Guhardja (Springer, Berlin & Heidelberg) 179-198
18 Forest Watch Indonesia (FWI) & Global Forest Watch (GFW), 2002. The State of the Forest: Indonesia. (Bogor, Indonesia) 115 pp.