Business and Economics Students
Giorgio Brunello
Claudio Lucifora
Rudolf Winter-Ebmer
A B S T R A C T
Expected earnings and expected returns to education are seen by labor economists as a major determinant of educational attainment. In spite of this, the empirical knowledge about expectations and their formation is scarce. In this paper we report the results of the first systematic study of the wage expectations of European university students. Our data are based on a uniform questionnaire answered by about 3,000 business and economics university students across Europe. We study the determinants of wage expec-tations and expected employment probabilities, the variability of these expectations and their variation across countries and universities. We also examine the tradeoff between expected starting wages and expected wage growth.
Giorgio Brunello is a professor of economics at the University of Padova, affiliated with CESifo and IZA. Claudio Lucifora is a professor of economics at the Università Cattolica, Milan. Rudolf Winter-Ebmer is a professor of economics at the University of Linz, affiliated with CEPR, IZA, and IHS. The authors are grateful to G. Bono, J. Fersterer, M. Maurhart and N. Pakhomova for excellent research assistance; to M. Arai, R. Asplund, J. Bacher, C. Badelt, R. Böheim, J. Brüderl, W. Buchholz, M. Burda, D. Checchi, K. Denny, B. Fitzenberger, K. Gerlach, H. Karcher, P. Ordine, P. Pereira, A. Skalli, P. Tsakloglou, V. Ulrich, P. Welzel, N. Westergard-Nielsen, S. Wolter, R. Wright and J. Zweimüller for help in admin- istrating the survey in the different countries; to Julian Betts, George Bresson, Bernard Fortin, Fumio Hayashi, Andrea Ichino, Enrico Rettore, Peter Zweifel and seminar participants at the New Orleans Meeting of the AEA, the ESPE Conference in Athens, the AFSE Conference in Lyon, Australian National University, Zürich, Tokyo, ERMES-Paris2 and European University Institute for comments. Two anony-mous referees proved particularly valuable in shaping the quality and clarity of the paper and we have to thank them for their effort. This research was supported by the European Commission under the TSER program PL980182 for the PuRE project. The usual disclaimer applies. The data used in this article can be obtained beginning May 2005 through April 2008 from Rudolf Winter-Ebmer, University of Linz, Austria, rudolf.winterebmer@jku.at.
[Submitted May 2001; accepted August 2003]
ISSN 022-166XE-ISSN 1548-8004 © 2004 by the Board of Regents of the University of Wisconsin System
I. Introduction
When individuals make decisions about higher education, they face important choices that depend on expectations about earnings and employment oppor-tunities. Educational attainment, labor supply decisions and the choice of occupa-tion—as well as several other economic decisions—require individuals to form (subjective) expectations on the different possible outcomes, under different contin-gencies. In spite of the large body of research on human capital formation and the eco-nomic returns to education, however, relatively little has been done by economists to collect data on expectations. The limited empirical knowledge on actual expectations about earnings, as well as some skepticism about the use of subjective data, has led economists to infer expectations from earnings data conditional on assumptions about how expectations are formed.
In this paper we take the more direct approach in using expectations reported by students on future earnings. Only a few studies have examined this question, and most of those refer to the U.S. experience.1However, there are good reasons why the for-mation of expectations in Europe and the United States might differ: personal income and wage information is much more openly available in the United States, there is less dispersion of earnings and a higher unemployment rate in Europe—suggesting more concern about employment prospects there, the university system in many European countries is more standardized, and finally there is less intergenerational mobility in many European societies, making family background more important in shaping student expectations.
We look across 10 European countries to study the wage expectations of European business and economics students, their assessment of the returns to higher education and at the correlations between expected earnings and individual, university and coun-try-specific variables. The papers on the United States by Betts (1996) and Dominitz and Manski (1996) are closest in spirit to our research. Betts (1996) asked a sample of San Diego undergraduates about their views on the national level of earnings of several types of workers—some with and some without a university degree, and then compared these expectations with actual earnings. Dominitz and Manski (1996) were interested in an assessment of individual wage prospects, not in expectations or knowledge of national averages. They asked not only for a point estimate, but also for a probability distribution of expected earnings.
Our approach takes elements from both papers. We are interested in the expecta-tions of personalearnings prospects under different contingencies, because students might be better able to forecast earnings for themselves than for a “typical graduate.” We refrain, however, from the elicitation of a whole probability distribution of future earnings prospects, because it would be too difficult in a cross-country setting.2While there are shortcomings to be aware of in the use and interpretation of subjective expectations, particularly in a cross-country context, we still believe that there is
1. See Dominitz and Manski (1997) for a review.
much to be learned on the formation of expectations by collecting appropriate information directly from students.
Because of the persistent wage differentials and of the lower labor market attach-ment of women, we expect to find significant gender differences in wage expectations. These differences could help explaining the career paths of males and females: if females expect to get lower earnings from college, they may invest less in on-the-job training and so fulfill the gender gap in earnings (Gronau 1988). The importance of family background in some European societies (Solon 2002) characterized by limited social mobility also points to the influence of this variable in the formation of expectations.
II. The Formation of Expectations
A popular approach among economists has been to infer students’ expectations from realizations by assuming a homogeneous expectations formation process. As reviewed by Manski (1993), researchers have assumed either myopic or rational expectations. In the former case, students enrolling in higher education form their expectations by looking only at the realized income distributions of earlier cohorts. In the latter case, students assess incomes for their cohort properly, by taking the repercussions caused by changing supply of and demand for skills into account. In both cases they may have unconditional expectations—concerning the mean earn-ings of their cohort—or conditional ones, which relate more specifically to their own personal characteristics and abilities. Whereas conditional expectations are relevant for the personal career decisions of the prospective college student, unconditional expectations can be useful to test the respondent’s general knowledge of the labor market and its developments.
An alternative is the collection of data on expectations directly from students. There is a small literature in this area that collects either conditional (on individual characteristics) expectations (Smith and Powell 1990; Blau and Ferber 1991; Domi-nitz and Manski 1996), or unconditional expectations (Betts 1997). Carvajal et al. (2000) used a questionnaire similar to ours to ask college seniors and recent gradu-ates about expected starting wages, but their sample was small. Webbink and Hartog (1999) used subject data from Dutch students and Varga (2001) from Hungarian secondary school students as well.
Although we acknowledge the many merits of eliciting subjective earnings distri-butions, as done by Dominitz and Manski (1996), in this paper we choose to focus on point expectations only.3Our choice is dictated by the need to produce a simple and short questionnaire that could be administered with relative ease in different universi-ties across Europe. For comparability, we also require that the wording of the ques-tions be alike across countries. The design of the questionnaire was repeatedly discussed by a panel of European experts who participated in the project PURE, a European research network on the returns to education, sponsored by the TSER program of the European Union. Before producing the final text, a pilot study was conducted with about 100 students in Regensburg, Germany.
In particular, students were asked about their subjective expected (net monthly) earnings in the following four contingencies: (i) entry wage after college graduation; (ii) entry wage right after a high-school degree; (iii) college earnings after 10 years on the job; (iv) high-school earnings after 10 years on the job (the exact formula-tion of the quesformula-tions asked is shown in Table A3 available on the JHR website:
www.ssc.wisc.edu/jhr/). We interpret the responses to represent each individual’s mathematical expectation (mean) of their subjective earnings distribution.
We have tried to word our questions in a clear and simple way. In spite of these efforts, however, some ambiguity might remain. When asking students to state the approximate net monthly earnings they expect to earn right after finishing their degree, we anticipated, on the basis of our pilot study, that most students would answer with reference to their first job after graduation. However, we cannot rule out the possibility that some students might answer by averaging over alternative scenar-ios that include both working and not working for a while.4
We use the collected information to study the relationship between elicited expec-tations and a set of variables that capture both individual and university characteris-tics and the information set available to students. More in detail, we fit the following empirical model
( )1 E y[ ic|Xic]=ac+bXic+fic
where E[yic⎪Xic] is either the expected (net) wage or the expected (net) wage pre-mium of individual iin university c, computed as the percentage difference between expected college and high school wages, αcis a university specific fixed effect and Xic is a vector that includes individual characteristics and variables that capture the
infor-3. Dominitz and Manski (1996) in their computer-aided technology are able to administer a very specific questionnaire to a small sample of students and ask consecutive questions (which are automatically adapted to the previous answers) in order to elicit subjective earnings distributions.
mation gathering process as well as aggregate information, such as historical country-specific data on the average earnings of high school and college graduates. These country-specific data on previous earnings are likely to be an important component of the information set used by students to form expectations.
Students can collect information about future earnings either informally, by per-sonal communication with parents, friends and relatives, or more formally by con-sulting the press or specialized publications. The quality of information gained informally in the family is presumably higher when parents have themselves a college degree, especially if it is in a related or the same field. Similarly, students in the sec-ond or third year of higher education have had more time to collect relevant informa-tion about future wages—both formally and informally—and to update their initial expectations when they first enrolled in higher education. Access to information, both formal and informal, can help students both in developing a better forecast of mean future earnings and in narrowing down the range of expected future wages.
Conditional on the gathering of earnings information, individual characteristics and preferences also matter. Age, gender, and measures of time preference can shape cur-rent expectations about future earnings and job prospects. Ceteris paribus, more impa-tient individuals could be expected to be less choosy in their job search strategy after graduation and to accept lower entry wages.
As we ask students about their own—conditional—earnings expectation, we expect to find a positive relation between individual ability and earnings expectations. One way students learn about their own ability is by relative comparisons with fellow stu-dents. Parental education does also convey some information on ability. Whether par-ents have a college degree can affect expectations both because studpar-ents with more educated parents have on average higher cognitive ability and are more self-confident and because of the more advantageous network effects provided by an educated family.
III. The Questionnaire and the Data
The survey was conducted in 26 economics and business faculties belonging to universities distributed across 10 European countries.5 The need to administer a rather simple and short questionnaire—which consists of only two pages—and present it to a large number of students in different countries had a bear-ing on the samplbear-ing strategy. The questionnaire was distributed to undergraduates during the academic year 1999/2000. Students were asked to fill it immediately before or during the first minutes of a lecture. This method delivered a very high response rate; 3,382 questionnaires were filled in, leading to a response rate of more than 90 percent.
Because the questionnaire could not be administered directly by the authors in all possible locations, the design of the sample has relied on personal contacts in each country. As a result, we have a fairly representative and comprehensive sample in
Italy, Germany, Austria, Switzerland and Portugal, less so in the other countries. Given the sampling strategy adopted, this should be considered as a convenience sam-ple. Nonetheless, we believe that it provides a comprehensive picture of business and economics students during their first years in college.6Furthermore, we paid particu-lar attention to the quality and the logical consistency of the information collected. A careful data cleaning procedure was carried out on the rough data, and the main steps followed are described below. In general, students showed a thorough comprehension of the questionnaire and were able to report their expectations in a meaningful way.
More than 95 percent of the filled questionnaires had no missing observations or logical inconsistencies in the answers. When missing values or inconsistencies con-cerned any of the crucial variables (wage expectations, gender, faculty, etc.) the indi-vidual was dropped from the final sample.7To reduce cross-country heterogeneity in the data, we also eliminated from the sample senior students, that is those enrolled after the third year, and students older than 35.8In the end a total number of 2,840 valid questionnaires (1,569 males, 1,271 females) were retained. In Table A1—avail-able on the JHRwebsite: www.ssc.wisc.edu/jhr/—we report the distribution of valid questionnaires by country and university (Columns 3 and 4). In Column 5, we docu-ment the incidence (by country) of the questionnaires dropped both in the cleaning process and after selection of the sample used in the empirical analysis.9
Additional checks, performed to assess the overall quality of the responses, con-cerned the degree of bunching of values at round numbers. In this case, as discussed by Dominitz and Manski (1997b), responses though logically consistent may be per-functory. The analysis of the distribution of values in “open” questions—such as rel-ative performance and wage expectations—does show the prevalence of some rounding at integer values, but does not exhibit any strong bunching or lack of care in reporting the figures.
In Table A2—available on the JHRwebsite: www.ssc.wisc.edu/jhr/—we report, for the final sample, the averages of (selected) characteristics by gender. Average age in the sample is around 21 years, slightly higher for males than for females. A large pro-portion of students has held a job regularly during higher education (almost 70 per-cent) and worked on average 3.5 hours per week. Individual discount rates are an important ingredient of preferences showing up in any educational choice model. We measure the individual discount rate by asking each student whether she considers herself better or worse off by having 1,000 Euros today as compared to a colleague student who will get 1,000 +x Euros after one year, and by allowing x to take
6. Due to the relatively few valid questionnaires left after the cleaning procedure, data collected in Finland and Greece were excluded from the analysis.
7. Among the possible logical inconsistencies that we checked in the raw data we considered: age reported
vs.implicit age at start of college; year of study vs.regular duration and expected year of graduation. Inconsistencies in the field of study (that is, multiple and contrasting choices) and in the rate of discounting have also been considered as indicators of poor quality and the associated responses have been dropped from the final sample.
8. We are grateful to the Editor for suggesting this point to us.
different values ranging from 20 to 120 Euros.10The rate of inter-temporal preference derived from the questionnaire suggests a higher rate for males as opposed to females (5.8 and 4.6 percent respectively).
Up to 40 percent of university students (35 percent for females) belong to house-holds where the father house-holds a university degree. When referred to the mother this pro-portion falls to 25 percent and is slightly higher among female students. On average, 11 percent of the students are in the same field of study as their father; this proportion is halved in the case of the mother (5 percent) as both males and females appear to be more inclined to follow their fathers’ rather than their mothers’ academic choices. At the time of the survey, more than 50 percent of the students were in their first year of study, 30 percent in their second year, while the remainder was in their third year.
When asked about their relative performance vis-à-vis that of their colleagues, respondents classify themselves above the theoretical average with no significant dif-ferences by gender (average value: 2.50; 1 =very good; 6 =very poor).11Finally, almost one student out of two expects to need more years than the formal number required to complete her first degree (males: 47 percent; females: 54 percent). The sources of information used to form expectations suggest that personal communica-tions (particularly for men) are used as frequently as other more formal sources of information. Among the main reasons for the choice of university students clearly indicate interest in the subject, as well as (future) income and job prospects and rep-utation. When asked to evaluate their chances to get an appropriate job after college, students expect to have “good” chances on average (prospects are lower for females). Because our data are from different countries in Europe, we transform expected wages in a common unit of measure, the Euro.12Average expected wages after col-lege, as reported in Table A2—available on the JHRwebsite: www.ssc.wisc.edu/jhr/
—are substantially higher for males than for females (27 percent at labor market entry and 47.6 percent after 10 years on the job). A large gender gap exists also for expected wages after secondary school (31 percent at labor market entry and 44.7 percent after 10 years on the job). If we compare the gender differences in expected earnings with those in actual earnings—relative to 1997—we find that they are significantly larger at labor market entry and about the same after 10 years on the job. At labor market entry, the gender gap in actual earnings is 13.8 percent for high school graduates and 17.3 percent for university graduates. After 10 years on the job, the gap is 36.3 per-cent for high-school graduates and 40.5 perper-cent for university graduates.13Expected wages after college, at the start of the career, are on average twice as high (105
per-10. See question 19 in the questionnaire at the end of the paper. To briefly illustrate the computation of the discount rate, assume that a student is better off with 1,080 Euros or more but worse with 1,060 Euros or less. In this case the discount rate that makes her indifferent between today and one year later is between 6 and 8 percent. We take it to be 7 percent.
11. These curious results are well documented in the psychological literature (Matlin and Stang 1978) and provide an example of the so called “Pollyanna Principle”: This principle states that people, under uncer-tainty, have a general tendency to favor positive over negative outcomes. See De Meza and Southey (1996) for an application to entrepreneurial ability.
12. In the case of the United Kingdom, Switzerland and Sweden the average exchange rate over the year was used.
cent) as compared to holding a high school degree; this gap rises to 157 percent when measured after 10 years on the job. These differentials are much larger than those found in actual average wages, which are close to 50 percent.14
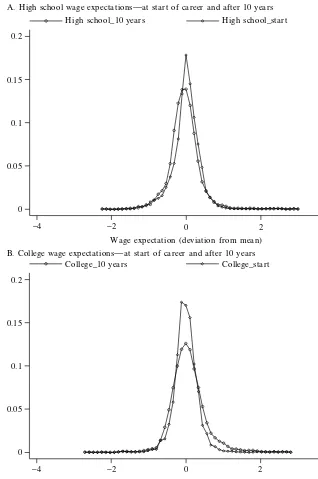
To inspect the distribution of expected wages across students we use nonparamet-ric methods to fit the density of the reported wage expectations under different con-tingencies. We first regress wage expectations—separately for entry and after 10 years—on university dummies and then, pooling all universities together, we use the retrieved residuals and a kernel density estimator to plot in Figure 1 the sample dis-tribution of expected earnings under different contingencies. The two panels show college and high-school wage expectations, respectively at labor market entry and 10 years after entry. The estimated densities are fairly smooth, with almost 90 percent of the distribution falling within two standard deviations and with long tails in either direction. The dispersion of expectations across students is slightly higher, as one might expect given greater uncertainty, for wage expectations 10 years after labor market entry. In particular, the standard deviation of (log) expected wages after col-lege is 0.56 and 0.62, respectively at entry and 10 years after entry. After high school, the standard deviation is equal to 0.62 and 0.64, respectively. Importantly, only 1.5 percent of the interviewed students reported higher expected earnings at labor market entry after high school than after college. This percentage increases to 3.8 percent for expectations 10 years after labor market entry.
IV. Students’ Beliefs about their Future Wages
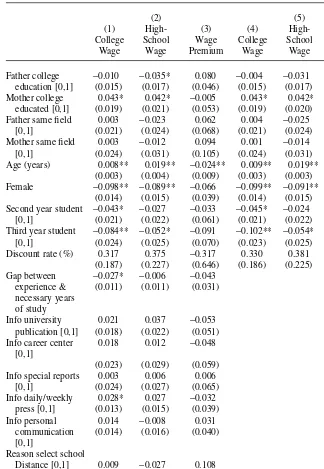
We define the college wage premium both at labor market entry and after 10 years on the job as the percentage difference between the expected wage as a college graduate and the expected wage in the event of having started work right after high school. We use the available information to regress students’ beliefs about col-lege earnings, high school earnings and the colcol-lege wage premium on a set of vari-ables, that include (i) university dummies, that capture both university specific and country effects; (ii) individual characteristics (age, gender, time preference, labor market activities) and (iii) family background variables (parents’ education and field of study). To these variables we add the year of enrolment, the gap between expected duration of the course and its regular duration, relative academic ability, and a set of dummies that capture both the alternative sources of information about future earnings and the main reasons for university choice.
Tables 1 and 2 present our results for earnings after graduation and after 10 years on the job, respectively. To limit the number of rows in the tables, we do not include the estimated coefficients associated to university dummies. Most of these dummies are significantly different from zero. We find that female students expect both sub-stantially lower college earnings (−9.8 percent) and lower high-school earnings (−8.9 percent) than male students.15College wage premia at the start of the career are also
14. The gap between college and high school wages in 1997 was 47.7 percent at labor market entry and 49.2 percent after 10 years on the job. Source: ECHP.
Wage expectation (deviation from mean) College_10 years College_start
−4 −2 0 2 4
0
B. College wage expectations−at start of career and after 10 years
0.05 0.1 0.15 0.2
Figure 1
Wage Expectations at labor market entry and after 10 years: High School and College
Wage expectation (deviation from mean) H igh school_10 years H igh school_start
−4 −2 0 2 4
0
A. H igh school wage expectations−at start of career and after 10 years
Table 1
Expected College and High School Wages and Expected Wage Premium at Labor Market Entry
(2) (5)
(1) High- (3) (4) High- (6) College School Wage College School Wage
Wage Wage Premium Wage Wage Premium
Father college −0.010 −0.035* 0.080 −0.004 −0.031 0.079 education [0,1] (0.015) (0.017) (0.046) (0.015) (0.017) (0.046) Mother college 0.043* 0.042* −0.005 0.043* 0.042* −0.005
educated [0,1] (0.019) (0.021) (0.053) (0.019) (0.020) (0.053) Father same field 0.003 −0.023 0.062 0.004 −0.025 0.071
[0,1] (0.021) (0.024) (0.068) (0.021) (0.024) (0.067) Mother same field 0.003 −0.012 0.094 0.001 −0.014 0.095
[0,1] (0.024) (0.031) (0.105) (0.024) (0.031) (0.106) Age (years) 0.008** 0.019** −0.024** 0.009** 0.019** −0.025**
(0.003) (0.004) (0.009) (0.003) (0.003) (0.008) Female −0.098** −0.089** −0.066 −0.099** −0.091** −0.063
(0.014) (0.015) (0.039) (0.014) (0.015) (0.039) Second year student −0.043* −0.027 −0.033 −0.045* −0.024 −0.051
[0,1] (0.021) (0.022) (0.061) (0.021) (0.022) (0.059) Third year student −0.084** −0.052* −0.091 −0.102** −0.054* −0.125
[0,1] (0.024) (0.025) (0.070) (0.023) (0.025) (0.069) Discount rate (%) 0.317 0.375 −0.317 0.330 0.381 −0.327
(0.187) (0.227) (0.646) (0.186) (0.225) (0.642) Gap between −0.027* −0.006 −0.043
experience & (0.011) (0.011) (0.031) necessary years
of study
Info university 0.021 0.037 −0.053 publication [0,1] (0.018) (0.022) (0.051) Info career center 0.018 0.012 −0.048
[0,1]
(0.023) (0.029) (0.059) Info special reports 0.003 0.006 0.006
[0,1] (0.024) (0.027) (0.065) Info daily/weekly 0.028* 0.027 −0.032
press [0,1] (0.013) (0.015) (0.039) Info personal 0.014 −0.008 0.031
communication (0.014) (0.016) (0.040) [0,1]
Reason select school
Distance [0,1] 0.009 −0.027 0.108 (0.033) (0.044) (0.126) Reputation [0,1] −0.024 −0.036 0.034
(0.027) (0.033) (0.082) Costs [0,1] −0.041 −0.046 0.040
Table 1 (continued)
(2) (5)
(1) High- (3) (4) High- (6) College School Wage College School Wage
Wage Wage Premium Wage Wage Premium
Income [0,1] 0.010 −0.017 0.023 (0.020) (0.026) (0.070) Assignment [0,1] −0.055 −0.013 −0.127
(0.036) (0.055) (0.127) Interest in subject −0.010 −0.025 0.025
[0,1] (0.020) (0.027) (0.071) Relative performance 0.029** 0.004 0.053
[0–6] (0.009) (0.009) (0.029) Hours of work/week 0.000 0.000 0.000
(0.001) (0.001) (0.003)
Observations 2,836 2,836 2,836 2,840 2,840 2,840 Adjusted R2 0.64 0.63 0.16 0.64 0.63 0.16
Robust standard errors in parentheses, * statistically significant at 5 percent; ** statistically significant at 1 percent. Dummies for different universities are not shown in Table.
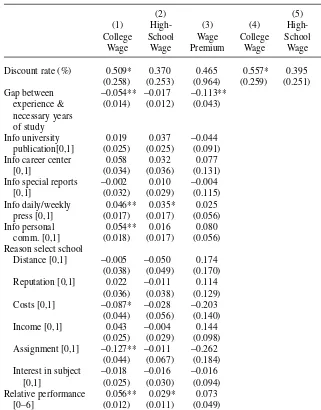
Table 2
Expected College and High School Wages and Expected Wage Premium after 10 Years on the Job
(2) (5)
(1) High- (3) (4) High- (6) College School Wage College School Wage
Wage Wage Premium Wage Wage Premium
Father college 0.007 −0.018 0.019 0.018 −0.010 0.031 educated [0,1] (0.020) (0.020) (0.066) (0.021) (0.020) (0.065) Mother college 0.049* 0.021 0.099 0.050* 0.021 0.098
educated [0,1] (0.024) (0.023) (0.077) (0.024) (0.023) (0.077) Father same 0.025 −0.018 0.173 0.030 −0.019 0.190
field [0,1] (0.028) (0.026) (0.107) (0.028) (0.027) (0.107) Mother same −0.013 −0.001 −0.059 −0.015 −0.001 −0.063
field [0,1] (0.036) (0.036) (0.145) (0.037) (0.037) (0.145) Age (years) −0.001 0.016** −0.050** 0.001 0.016** −0.048**
(0.004) (0.004) (0.013) (0.004) (0.004) (0.012) Female −0.234** −0.178** −0.202** −0.234** −0.179** −0.202**
(0.017) (0.018) (0.058) (0.018) (0.018) (0.058) Second year −0.040 −0.020 −0.032 −0.042 −0.013 −0.064
student [0,1] (0.028) (0.025) (0.101) (0.028) (0.025) (0.097) Third year student −0.024 0.006 −0.108 −0.056 −0.003 −0.180
Table 2 (continued)
(2) (5)
(1) High- (3) (4) High- (6) College School Wage College School Wage
Wage Wage Premium Wage Wage Premium
Discount rate (%) 0.509* 0.370 0.465 0.557* 0.395 0.544 (0.258) (0.253) (0.964) (0.259) (0.251) (0.951) Gap between −0.054** −0.017 −0.113**
experience & (0.014) (0.012) (0.043) necessary years
of study
Info university 0.019 0.037 −0.044 publication[0,1] (0.025) (0.025) (0.091) Info career center 0.058 0.032 0.077
[0,1] (0.034) (0.036) (0.131) Info special reports −0.002 0.010 −0.004
[0,1] (0.032) (0.029) (0.115) Info daily/weekly 0.046** 0.035* 0.025
press [0,1] (0.017) (0.017) (0.056) Info personal 0.054** 0.016 0.080
comm. [0,1] (0.018) (0.017) (0.056) Reason select school
Distance [0,1] −0.005 −0.050 0.174 (0.038) (0.049) (0.170) Reputation [0,1] 0.022 −0.011 0.114
(0.036) (0.038) (0.129) Costs [0,1] −0.087* −0.028 −0.203
(0.044) (0.056) (0.140) Income [0,1] 0.043 −0.004 0.144
(0.025) (0.029) (0.098) Assignment [0,1] −0.127** −0.011 −0.262
(0.044) (0.067) (0.184) Interest in subject −0.018 −0.016 −0.016
[0,1] (0.025) (0.030) (0.094) Relative performance 0.056** 0.029* 0.073
[0–6] (0.012) (0.011) (0.049) Hours of work/week 0.000 0.000 0.002
(0.001) (0.001) (0.005)
Observations 2,726 2,671 2,657 2,30 2,674 2,660 Adjusted R2 0.51 0.59 0.13 0.50 0.59 0.13
lower for females (−6.6 percent), although the difference is not statistically signifi-cant. The gender difference in beliefs is approximately twice as high after 10 years on the job (−23.4 percent for college—17.8 percent for high school earnings and −20.2 percent for the college premium), suggesting that, compared with males, females expect to end up in jobs with substantially lower relative earnings growth (Table 2).16 Conditional on year of enrolment, older individuals have lower expected college wage premia. Conditional on age, senior students expect lower earnings than junior students. Compared to freshmen, students enrolled in their second (third) year expect, ceteris paribus, about four (eight) percentage points less in terms of college wages at labor market entry. These differences are less notable after 10 years. Assuming that endogenous selection weeds out individuals with higher costs and/or lower expected benefits from college, the negative correlation between seniority in college and the expected college wage possibly identifies a learning effect: as students go through their curricula, they become more realistic in their expectations about future incomes. Alternative explanations are: (a) senior students take the questionnaire more seri-ously; (b) students answer the questions by taking into account future inflation and productivity growth. With positive inflation and productivity growth, junior students are bound to have, ceteris paribus, higher expectations. The presence of cohort effects is also a potential explanation, which we exclude because of the close proximity in the age of interviewed students. These results are similar to the learning effects Betts (1996) finds for the United States.
Students who expect to take longer than required to complete their degree17have also lower expected college wages but about the same expected high school wage, both at labor market entry and after 10 years on the job. Clearly, late completion is a negative labor market signal, which should depress wage expectations. Conditional on the year of enrolment, one could think that students who plan to finish later could foresee higher nominal earnings because they incorporate the rate of inflation in their expectations.18 The negative impact of late completion on expected college wages, together with no statistically significant effect of late completion on expected high school wages, is inconsistent with the view that respondents inflate their future expec-tations of college wages. The quality signal should depress both earnings estimates, whereas the inflation argument should bias only the college wage expectations upwards. We find the opposite in our data.
Parents’ education can affect students’ expectations in at least two ways: on the one hand, the information conveyed on future earnings by educated parents is likely to be of better quality; on the other hand, parental background can influence cognitive abil-ity and—via network effects—job prospects. We find evidence of a positive and sig-nificant correlation between the mother’s education and expected earnings after college and high school. Our results suggest that individuals in households where the mother has a college degree expect close to 4 percent higher earnings at labor market entry both with a college and with a high school degree. Conditional on the mother’s education, the father’s education attracts a negative coefficient which is almost never
16. An alternative interpretation would be that females expect to earn less after ten years because of possible work interruptions.
statistically significant. Furthermore, we find no evidence of a statistically significant correlation between expected earnings and the field of education of parents with a college degree.
In the absence of standardized test procedures that measure individual ability and cover all the countries in our sample, we asked students to self-assess their perceived academic ability relative to their peers on a seven-point scale. It turns out that students who rank themselves above the average in their class have consistently higher expected college earnings. According to Della Vigna and Paserman, (2001), more impatient job searchers are expected to search less and set lower reservation wages. In this paper, however, we find that students with high discount rates expect—if ever—higher college wages.
Students might differ considerably in their ability and effort to gather informa-tion about future earnings prospects associated to their field of study. To some extent, information can be collected from personal communications with friends or at home if parents have also gone to college. Alternative sources are publicly avail-able and include university publications, university career centers, special reports, and the daily/weekly press. We asked students what sources of information they used to learn about the income prospects of college graduates. Swedish students used on average 1.2 publicly available channels, followed by the British (0.98) and the Irish (0.93). In contrast, French students used only 0.4 public information sources, and the Italians only 0.6. The use of personal communication was less dis-persed: while four out of ten Italians, French and Swedes used personal information about earnings prospects, more than 70 percent of Portuguese students did so. As reported in Tables 1 and 2, students expect higher earnings if they have had access either to formal or to personal information. The correlation is statistically significant, however, only when the information is personal or collected from the daily and weekly press.
In spite of the fact that working while in school can be expected to improve the information set available to students, we find no evidence in our data that it is posi-tively correlated to expected earnings. Related to information, but also to motivation, is the reason why students have chosen to study in the selected university. We ask stu-dents to rank the determinants of their choice among the following possibilities: dis-tance from home town, academic reputation, costs, income and job prospect, external assignment based on performance and interest in the subject. To each we associate a dummy variable that takes the value one if the option is top ranked and zero other-wise. While most of the coefficients associated to these dummies are not statistically significant, there is some evidence that students who have chosen their university because costs were lowest or because of some external assignment rule have also lower earnings expectations.
these problems, we report in Columns 4–6 similar regressions without these variables. It turns out that the results for the remaining variables are practically unchanged.19
An important aspect of the expected return to college is the probability of finding an appropriate job after graduation. The mismatch between the type of qualifications acquired at school and the job can take two forms: overeducation and unemployment. Unemployment rates have been persistently high in most European countries since the early 1980s and in some countries the probability of unemployment has increased not only among the unskilled but also among the educated (see Nickell and Bell 1995). When unemployment is a possibility, the expected return to college needs to be adjusted to take this event explicitly into account (Nickell 1979).
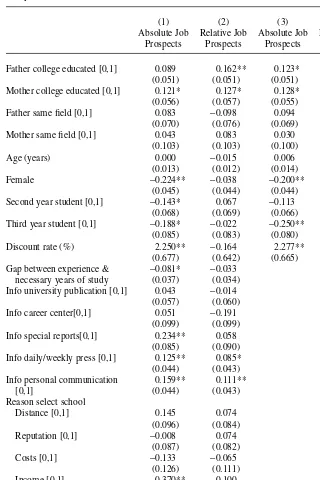
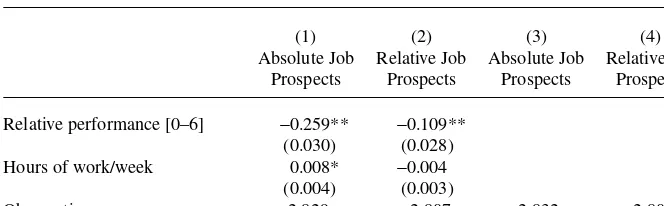
We have asked students to evaluate their own chances of getting an appropriate job after graduating (absolute job prospects), and whether these chances are improved by college education with respect to having only a high school degree (relative job prospects). Since the answers to these questions can be ranked from “very poor” to “very good” and from “much worse” to “much better” (five categories), we estimate an ordered probit model that relates job prospects to individual and household characteristics20and use the same explanatory variables as in Tables 1 and 2.
The results in Table 3 are in most cases similar when we consider absolute or rela-tive job prospects. They can be summarized as follows: (i) females have worse job prospects than males; (ii) second or third year students are less optimistic about their job chances; (iii) prospects increase substantially when parents have a college degree, which clearly indicates the presence of network effects;21(iv) job prospects are worse for students who expect to finish later than required; (v) publicly available informa-tion as well as informainforma-tion from personal communicainforma-tion are associated to a higher probability of finding an appropriate job. The relevance of personal communications is another piece of evidence that family and/or personal networks (are perceived to) matter. (vi) working while at school improves the chances of finding an appropriate job after graduation; (vii) students who selected the university because of income prospects or because they were mainly interested in the subject are more optimistic; (viii) students with a high discount rate expect to have less problems in getting hold of a job, which might be due to their reduced choosiness in terms of potential jobs or their general carelessness about their future. Likewise, in Columns 4–6 we present estimates without potentially endogenous regressors, which leads to practically the same results for the remaining explanatory variables.
It is interesting to compare wage expectations with expectations about job prospects. Family networks (parents with a college degree) appear to be important both for finding an appropriate job and for wage expectations, with the following interesting qualification: while the father’s education is positively and significantly correlated with better job prospects, the mother’s education exhibits a positive and significant correlation both with better job prospects and with wage expectations. On the other hand, students who have worked during college and have chosen their field
19. We check the robustness of our results—with respect to data errors and outliers—by performing median regressions with the same variables listed in Tables 1 and 2. The results—which are very close to the OLS regressions—are available upon request.
Table 3
Expected Job Prospects After Graduation. Absolute and Relative to High School Job Prospects
(1) (2) (3) (4)
Absolute Job Relative Job Absolute Job Relative Job Prospects Prospects Prospects Prospects
Father college educated [0,1] 0.089 0.162** 0.123* 0.175** (0.051) (0.051) (0.051) (0.050) Mother college educated [0,1] 0.121* 0.127* 0.128* 0.135* (0.056) (0.057) (0.055) (0.056) Father same field [0,1] 0.083 −0.098 0.094 −0.091
(0.070) (0.076) (0.069) (0.076) Mother same field [0,1] 0.043 0.083 0.030 0.080
(0.103) (0.103) (0.100) (0.103) Age (years) 0.000 −0.015 0.006 −0.017
(0.013) (0.012) (0.014) (0.012) Female −0.224** −0.038 −0.200** −0.037
(0.045) (0.044) (0.044) (0.044) Second year student [0,1] −0.143* 0.067 −0.113 0.075
(0.068) (0.069) (0.066) (0.067) Third year student [0,1] −0.188* −0.022 −0.250** −0.045
(0.085) (0.083) (0.080) (0.079) Discount rate (%) 2.250** −0.164 2.277** −0.172
(0.677) (0.642) (0.665) (0.641) Gap between experience & −0.081* −0.033
necessary years of study (0.037) (0.034) Info university publication [0,1] 0.043 −0.014
(0.057) (0.060) Info career center[0,1] 0.051 −0.191
(0.099) (0.099) Info special reports[0,1] 0.234** 0.058
(0.085) (0.090) Info daily/weekly press [0,1] 0.125** 0.085* (0.044) (0.043) Info personal communication 0.159** 0.111**
[0,1] (0.044) (0.043)
Reason select school
Distance [0,1] 0.145 0.074 (0.096) (0.084) Reputation [0,1] −0.008 0.074
(0.087) (0.082) Costs [0,1] −0.133 −0.065
(0.126) (0.111) Income [0,1] 0.370** 0.100
(0.068) (0.059) Assignment [0,1] 0.140 −0.082
mainly because of personal interest, expect to have better job opportunities, but not better wages. In the case of other characteristics—gender, relative performance, year of enrolment and the gap between expected and required years of study—expectations about wage and job prospects go nicely hand in hand: for instance, females expect both lower wages and more difficulties to find an appropriate job. Lower (higher) expected wages and worse (better) job prospects are consistent with a lower (higher) relative demand for students with these characteristics. Female graduates expect to receive fewer job offers than male graduates and have as a consequence lower reser-vation wages and lower earnings expectations. Lower expectations, however, are not sufficient to improve expected job prospects if job offers are scarce.
The finding that students with higher discount rates have both higher expected wages and expect better job prospects is not in contrast with human capital theory. According to this theory, individuals enroll in college if the discounted value of their expected returns is higher than current costs. Conditional on costs, enrolled individu-als with higher discount rates need to have higher expected returns.22An alternative story is that students with higher discount rates are over-optimistic about their future. Perhaps more intriguingly, higher discount rates could be correlated to the unobserved components of individual talent which are not captured by self-assessed academic ability. Examples of nonacademic ability include social skills (Heckman 2000) and practical intelligence (Sternberg and Wagner 1986). If students with the same per-ceived academic ability and higher nonacademic talent are more impatient, they can expect both higher wages and better job prospects.
V. Differences across Countries and Institutions
Conditional on individual and family background variables, expected wages and wage premia can differ because of country and university specific effects.
22. We are grateful to Bernard Fortin for suggesting this explanation.
Table 3 (continued)
(1) (2) (3) (4)
Absolute Job Relative Job Absolute Job Relative Job Prospects Prospects Prospects Prospects
Relative performance [0–6] −0.259** −0.109** (0.030) (0.028) Hours of work/week 0.008* −0.004
(0.004) (0.003)
Observations 2,829 2,807 2,832 2,809
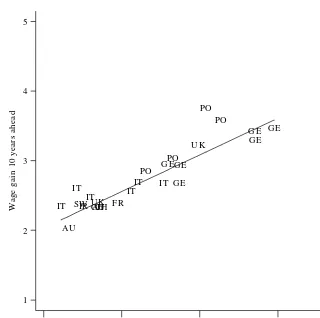
Figure 2 plots the estimated coefficients associated to university dummies in regres-sions where the dependent variable is the expected wage premium either immediately after college or 10 years on the job. We notice that these coefficients are higher in German and Portuguese universities and lower in Italian universities, but we hasten to add that these country specific effects could reflect, apart from genuine differences in expectations, university specific differences in the interpretation of the questionnaire, as discussed in Section II.
Genuine differences in expectations should reflect in a systematic way country and university specific effects. To investigate this further, we run regressions similar to those reported in Tables 1 and 2 after replacing the university dummies with a com-bination of country and university specific variables.23As country specific variables
23. We assume that country and college specific variables are uncorrelated with college specific differences in the interpretation of the questionnaire.
Figure 2
The college wage premium at labor market entry and after 10 years on the job.
Note: the straight line is obtained from a regression of expected wage premia 10 years ahead on expected wage premia at labor market entry.
we use measures of actual wages and wage premia. The underlying idea is that cross country differences in actual wages should reflect differences in demand and supply factors as well as in labor market institutions.
Actual wages are drawn from the European Community Household Panel (ECHP)—a household survey covering most European countries in our sample, with the exception of Sweden and Switzerland—and from national surveys. A clear advan-tage of using data from the ECHP is comparability. We regress individual (monthly) wages for each country on educational dummies, actual labor market experience, defined as age minus age at labor market entry, its squared value and interactions between education and experience, and identify actual wages with the predicted wages from these regressions when experience is equal to zero and 10 years respec-tively24and attained education is either high school or college. Actual wage premia at labor market entry and 10 years after entry are then obtained as percentage differences between actual estimated college and high school wages.
University specific variables are meant to capture within country differences in per-ceived university quality and selectivity. Given the potential endogeneity of university choice, we refrain from giving a causal interpretation to the uncovered correlations between these variables and expected wages. We have asked the interviewers at each university where we collected the individual questionnaire the following: (i) to state whether the university has an official admission procedure for students in the specific field (1 if the procedure exists; 0 if every applicant is admitted); (ii) to compare sep-arately the prestige in education and research of the university to the national average (0–2 for lower, comparable or higher than the national average; our prestige indicator uses the combined information); (iii) to indicate whether the university is private or public (1 if private; 0 otherwise). We expect that students in universities with an admission standard and a better education and research reputation have better labor market opportunities and a higher expected wage premium from university education. Because country and university variables are at a higher level of aggregation than individual expected wages, we need to correct the standard errors of the estimates by allowing for lack of independence within clusters (see Moulton 1990). For reasons that will become clear later, we identify clusters with universities. Our results are reported in Table 4, where we omit for simplicity the estimated individual and family background effects shown in Tables 1 and 2. Columns 1, 2, 4, and 5 in the table show the results when the dependent variable is the expected wage and Columns 3 and 6 present the findings when the dependent variable is the expected wage premium.
Actual wages in the former group of columns are converted into the same currency by using Euro rates. Since a student’s information set could in principle contain a complete history of country-specific average earnings, we would like to include in the regressions several lags of average wages. In practice, we have data from the 1995, 1996, and 1997 waves of ECHP. The very high correlation over time of these country means prompted us to use as a regressor their average over the three-year period. In the case of Switzerland and Sweden, country-specific average wages are drawn from national sources in 1999 and are not strictly comparable to actual wages in the rest of
the sample. This is less of a problem with actual wage premia, because we use per-centage differences rather than levels. Therefore, we omit these two countries in the regressions for expected wages.
With the sole exception of wage premia at labor market entry, our evidence shows that expected wages and expected wage premia are positively correlated to actual wages and wage premia. Hence, students have higher expectations in countries where both actual wages and actual wage premia are higher. Except for the case of wage pre-mia at labor market entry, these correlations are statistically significant. We have checked whether the standard errors associated to these coefficients are affected by changing the selection of clusters from universities to countries, and found only mar-ginal changes. This result and the fact that most of the explanatory variables used to replace university dummies are university specific have guided our choice of university as the clustering variable.
We find that students enrolled in universities with a formal admission procedure have higher expectations with respect to students enrolled in universities which admit Table 4
Expected Wages and Expected Wage Premia when University Dummies are Replaced with Country and University-Specific Variables
(4) (5) (6)
(1) (2) (3) College High School Wage College High School Wage Wage after Wage after Premium
Wage Wage Premium 10 years 10 years after 10 years
Actual wage 0.761** (exp=0) (0.157)
Actual wage 0.661** (exp=0) (0.187)
Actual gain −0.302
(0.354)
Actual wage 1.037**
(exp=10) (0.279)
Actual wage 1.248**
(exp=10) (0.172)
Actual gain 1.897**
(0.534) Admission 0.094 0.018 0.491** 0.229 0.097 0.597**
restricted (0.139) (0.152) (0.164) (0.158) (0.150) (0.147) Prestige in −0.040 0.150 −0.314 0.038 0.102 −0.287
teaching/ (0.133) (0.183) (0.159) (0.131) (0.141) (0.153) research
Private university −0.527** −0.357** −0.245 −0.482** −0.380** −0.261* (0.079) (0.087) (0.204) (0.078) (0.065) (0.122) Observations 2,263 2,263 2,836 2,184 2,136 2,657 Adjusted R2 0.409 0.327 0.061 0.316 0.370 0.094
Note: robust standard errors in parentheses corrected for clustering in universities. Additional controls are the explanatory variables used in Tables 1–2. Exp =labor market experience.
all applicants.25 The natural explanation is that formal admission procedures select more able candidates, who have better labor market prospects. Interestingly, we also find that students in private universities have substantially lower expectations than their peers in public universities. Economic theory suggests the contrary: when pub-lic and private schools compete and school quality is valuable, the equilibrium is char-acterized by stratification, with private schools attracting students of higher quality, who have higher expectations about their future earnings (see Epple and Romano 1998). In this framework, our results can be explained if private universities offer their students for a price something valuable that is not necessarily school quality in the usual sense. For instance, an easier curriculum and a higher probability of graduation could attract to these universities also less talented students, who have lower earnings expectations. Finally, and somewhat surprisingly, there is no evidence that students enrolled in universities with a relatively high reputation in their own countries have higher earnings expectations as compared to other students.
VI. Is There a Trade Off Between the Expected College
Wage at Entry and the Future College Wage
Premium?
When the labor market is loose and youth unemployment is relevant, as it has happened in several European countries during the past fifteen years, univer-sity graduates can experience difficulties in finding a match with a high paying job just after completing university. In many cases, graduates can expect to start with an entry job, that offers a relatively low salary, and to experience fast earnings growth over time, as they shift to better matches. Alternatively, when education and training are complements and graduates expect to find jobs in sectors with high productivity growth and substantial on-the-job training, the expected entry wage can be relatively low because of the investment in training but earnings growth can be fast because of the accumulation of human capital. In both cases, we expect to find a negative rela-tionship, or a trade off, between the expected entry wage after graduation (W_Coll) and expected college earnings growth 10 years after entry (∆W_Coll).
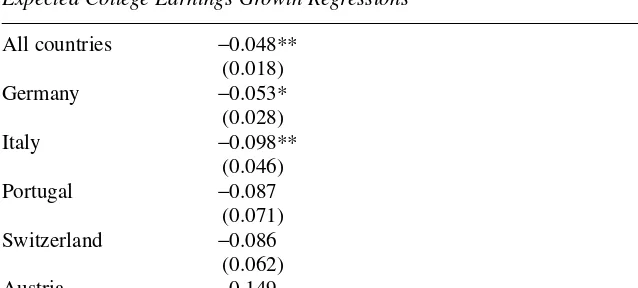
We test whether such a relationship exists in the data by augmenting the list of explanatory variables in the regressions in Tables 1 and 2 with W_Colland by using ∆W_Collas the dependent variable. While cross-country differences in price levels are controlled by university dummies, individual effects are controlled by the full set of characteristics used in the previous regressions. The empirical analysis is per-formed both for the full sample and separately for the five countries where we have enough data, Germany, Italy, Portugal and Switzerland and Austria. The estimated coefficient of W_Collis shown in Table 5.
Our evidence points clearly to the existence of a trade off. With the exception of Austria, the coefficient associated to the expected college wage at entry is always neg-ative and precisely estimated in the full sample and in Germany and Italy. These
results suggest that university students who expect faster earnings growth 10 years after entry also expect a relatively low entry wage.
VII. The Variability of Expectations
Our data show that the median expected college wage premium is 71 percent at labor market entry and 114 percent 10 years after entry. At the same time, the ratio of the 90th to the 10th percentile of expected graduate wages at labor market entry ranges from a high of 3.0 in the United Kingdom, 2.4 in Ireland and 2.3 in Portugal to a low of 1.5 in Sweden and 1.7 in Denmark and Austria. As expected, this ratio is higher in all countries when we consider expected earnings after 10 years on the job: in this case the 90/10 inter-percentile ratio ranges from 5.0 in the United Kingdom, 3.7 in Portugal and 3.4 in Ireland to 2.0 in Sweden and Austria.
Notice that these figures are about the cross-section variation in expectations within each country, and not about subjective individual uncertainty. They are not easily comparable with the existing evidence for the United States. Betts (1996), for instance, reports for U.S. university students a 90 to 10 percentile ratio just below two for wages at labor market entry. The latter ratio, however, is based upon students’ esti-mates of national average earnings for a particular job, not on their estiesti-mates of per-sonal earnings. Therefore, it is not surprising that the variance found by Betts is lower. Dominitz and Manski (1996) have data on subjective earnings expectations, but report only median expectations at age 30 or age 40. While at age 30 the 90 to 10 percentile ratio is equal to 2.4 for females and to 3.7 for males, the respective figures at age 40 are 2.0 for females and 5.7 for males.
Table 5
The Estimated Coefficient of the Expected College Wage at Labor Market Entry in Expected College Earnings Growth Regressions
All countries −0.048**
(0.018)
Germany −0.053*
(0.028)
Italy −0.098**
(0.046)
Portugal −0.087
(0.071)
Switzerland −0.086
(0.062)
Austria 0.149
(0.218)
With the caveat that comparisons are difficult, it is fair to say that the observed vari-ability of expected earnings in Portugal and the Anglo-Saxon countries is closest to the variability found in the U.S. Notice that Portugal and the Anglo-Saxon countries have the highest returns to education in Europe (Harmon et al. 2001).
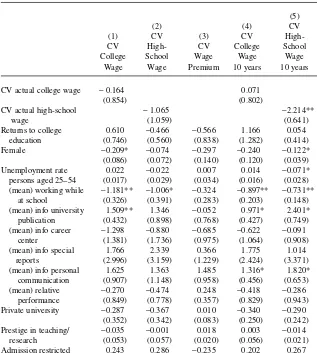
Is the observed variation in expectations related to actual wage dispersion? Are expectations more uniform when students have access to the information on job prospects and wages provided by career centers and similar structures? To investigate these questions more formally, we compute the coefficients of variation of expected college and high-school wages and of the expected wage premium at labor market entry by university, gender and year of study, and regress them both on the coefficient of variation of actual earnings and on the cell-specific mean access to different sources of information.26We also include country dummies in the regressions and correct standard errors for clustering at the country level.
Table 6 shows our results. First, the proportion of female students is negatively cor-related with the dispersion of expectations. Second, there is no evidence that actual wage dispersion and the variation of earnings expectations are positively correlated. If anything, the estimated correlations are negative and not significantly different from zero. We also check whether there is a statistical association between actual labor market conditions and the variation of expectations by including among the regres-sors both the returns to college education and the unemployment rate of prime-age workers. Neither variable attracts a statistically significant coefficient.
The information individuals possess, however, does matter. On the one hand, the proportion of working students in the university is negatively correlated with the vari-ability of expectations. On the other hand, the proportion of students with information about income prospects drawn either from personal communication or from univer-sity publications is positively correlated with the dispersion in expectations. The find-ing for university publications goes against intuition and casts doubts on the reliability and consistency of such information.
Finally, we include in the regressions the same university-related variables used in Table 5. Although, one might assume that in private institutions as well as in institu-tions with stricter admission criteria students should be more homogenous, we find no discernible effects of these variables on the variability of expectations.
VIII. Conclusions
In this paper we have carried out the first systematic study of the wage expectations of university students in Europe by using the replies to the same ques-tionnaire by business and economics students all over Europe. We have studied the determinants of wage expectations and expected employment probabilities, the vari-ability of these expectations within a field of study and their variation across univer-sities and countries. We have also examined the tradeoff between expected starting wages and wage growth and analyzed the correlation between expected and actual (lagged) wages. Our main findings can be summarized as follows.
Expected college wages are correlated with gender, age, seniority in college, the gap between expected and required years of study, parental education, perceived stu-dent relative ability and access to information about future earnings. Importantly, female college students expect substantially lower earnings and worse job prospects than male students. Family background matters both for expected earnings and for expected absolute and relative job prospects, which suggests that personal networks play a relevant part in the European labor market for college graduates.
Table 6
Variance of Expectations within Places and Faculties
(5)
(2) (4) CV (6)
(1) CV (3) CV High- CV
CV High- CV College School Wage College School Wage Wage Wage Premium
Wage Wage Premium 10 years 10 years 10 years
CV actual college wage −0.164 0.071
(0.854) (0.802)
CV actual high-school −1.065 −2.214**
wage (1.059) (0.641)
Returns to college 0.610 −0.466 −0.566 1.166 0.054 0.623 education (0.746) (0.560) (0.838) (1.282) (0.414) (1.240) Female −0.209* −0.074 −0.297 −0.240 −0.122* −0.211
(0.086) (0.072) (0.140) (0.120) (0.039) (0.120) Unemployment rate 0.022 −0.022 0.007 0.014 −0.071* −0.005
persons aged 25–54 (0.017) (0.029) (0.034) (0.016) (0.028) (0.020) (mean) working while −1.181** −1.006* −0.324 −0.897** −0.731** −0.175
at school (0.326) (0.391) (0.283) (0.203) (0.148) (0.256) (mean) info university 1.509** 1.346 −0.052 0.971* 2.401* 0.802
publication (0.432) (0.898) (0.768) (0.427) (0.749) (0.626) (mean) info career −1.298 −0.880 −0.685 −0.622 −0.091 −1.270
center (1.381) (1.736) (0.975) (1.064) (0.908) (1.111) (mean) info special 1.766 2.339 0.366 1.775 1.014 0.752
reports (2.996) (3.159) (1.229) (2.424) (3.371) (1.101) (mean) info personal 1.625 1.363 1.485 1.316* 1.820* 1.702
communication (0.907) (1.148) (0.958) (0.456) (0.653) (1.051) (mean) relative −0.270 −0.474 0.248 −0.418 −0.286 −0.002
performance (0.849) (0.778) (0.357) (0.829) (0.943) (0.281) Private university −0.287 −0.367 0.010 −0.340 −0.290 −0.126
(0.352) (0.342) (0.083) (0.250) (0.242) (0.058) Prestige in teaching/ −0.035 −0.001 0.018 0.003 −0.014 0.025
research (0.053) (0.057) (0.020) (0.056) (0.021) (0.027) Admission restricted 0.243 0.286 −0.235 0.202 0.267 −0.232* (0.201) (0.143) (0.107) (0.159) (0.174) (0.098)
Observations 51 51 51 51 51 51
Adjusted R2 0.56 0.57 0.4 0.5 0.52 0.31
Mean of LHS 0.45 0.45 0.83 0.60 0.52 0.82
Students with higher perceived relative ability have both higher expected wages and better expected job prospects. Moreover, expected wages are positively correlated to country–specific (lagged) actual wages. Students enrolled in universities with a for-mal admission procedure have higher expectations. Enrolment in a private university, however, reduces expected earnings. We find evidence of a substantial trade off between expected college wages at labor market entry and earnings growth 10 years after entry. The dispersion of expected wages is not correlated to actual wage disper-sion but correlated to the proportion of students collecting information about future earnings from university publications and from personal communication. Finally, the variability of expected college earnings within an institution in the Anglo-Saxon countries and in Portugal is closest to the variability found by Betts (1998) in the United States.
The finding that the wage expectations of European university students are sys-tematically correlated to personal and household characteristics, as well as to uni-versity and country-specific features, has two important implications. First, female students, probably anticipating discrimination in the labor market, expect both lower wages and poorer employment opportunities. Lower expectations could induce them to invest less in on-the-job training, and to fulfill in this way part of the gender gap in earnings. Second, in spite of the fact that universities in many European countries are public, family background remains relevant both for earn-ings and for job prospects and university students internalize in their expectations the inertia of intergenerational mobility and the ensuing inequality of opportunities in the labor market.
While our sample covers a substantial number of business and economics students across Europe, much could be done to further improve our knowledge of how univer-sity students form their expectations. A more balanced coverage of universities and fields of study within Europe would be an obvious extension of the current research. Another valuable extension would be to go beyond point expectations and collect information on the probability distributions of expected earnings, as done by Dominitz and Manski (1996). In order to take our preliminary and descriptive analy-sis of expectations further, one would have to ask carefully constructed questions and collect more informative data on the conditioning events determining the outcome whose expectation we want to study. In the case of earnings expectations this would include expectations about future employment outcomes, expectations about fluctua-tions in future wage rates and expectafluctua-tions about aggregate labor market condifluctua-tions. In spite of the limits of the current dataset, we feel that interesting regularities have been discovered that help highlight the individual decisions to enroll and stay in higher education in Europe.27
References
Altonji, Joseph G. 1993. “The Demand for and Return to Education When Education Outcomes Are Uncertain.” Journal of Labor Economics11(1):148–83.
Betts, Julian R. 1996. “What Do Students Know About Wages? Evidence from a Survey of Undergraduates.” Journal of Human Resources31(1):27–56.
Betts, Julian R. 1998. “The Impact of Educational Standards on the Level and Distribution of Earnings.” American Economic Review88(1):266–75.
Blau, Francine D., and Marianne Ferber. 1991. “Career Plans and Expectations of Young Women and Men.” Journal of Human Resources26:581–607.
Brunello, Giorgio, and Rudolf Winter-Ebmer. 2003. “Why Do Students Expect to Stay Longer in College? Evidence from Europe.” Economics Letters80:247–53.
Carvajal, Manuel J. et al. 2000. “Inter-Gender Differentials between College Students’ Earnings Expectations and the Experience of Recent Graduates.” Economics of Education Review19:229–43.
Cook, Anthony, and Janet Leckey. 1999. “Do Expectations Meet Reality? A Survey of Changes in First-Year Student Opinion.” Journal of Further and Higher Education
23:157–71.
Della Vigna, Stefano, and Daniel Paserman. 2001. “Job Search and Impatience.” Cambridge: Harvard University. Unpublished.
De Meza, David, and Southey Clive. 1996. “The Borrower’s Curse: Optimism, Finance and Entrepreneurship.” Economic Journal106:375–86.
Dolton, Peter, and G. H. Makepeace. 1986. “Sample Selection and Male Female Earnings Differentials in the Graduate Labour Market.” Oxford Economics Papers38:317–41. Dominitz, Jeff, and Charles F. Manski. 1996. “Eliciting Student Expectations of the Returns to
Schooling.” Journal of Human Resources31(1):1–26.
Dominitz, Jeff, and Charles F. Manski. 1997a. “Perceptions of Economic Insecurity.” Public Opinion Quarterly61:261–87.
Dominitz, Jeff, and Charles F. Manski. 1997b. “Using Expectations Data to Study Subjective Income Expectations.” Journal of the American Statistical Association92:855–67. Epple, Dennis, and R. Romano. 1998. “Competition between Private and Public Schools,
Vouchers and Peer-Group Effects.” American Economic Review88(1):33–62.
Gronau, Reuben. 1988. “Sex-Related Wage Differentials and Women’s Interrupted Careers— The Chicken or the Egg?” Journal of Labor Economics6(3):277–301.
Harmon, Colm, Walker, Ian, and Niels Westergard-Nielsen, eds. 2001. Education and Earnings in Europe: A Cross Country Analysis of the Returns to Education. Cheltenham: Edward Elgar.
Heckman, James. 2000. “Policies to Foster Human Capital.” Research in Economics
54(1):3–56.
Kunze, Astrid. 2002. “The Evolution of the Early Career Gender Wage Gap.” IZA working paper436, Bonn.
Leonard, Jonathan S. 1982. “Wage Expectations in the Labor Market: Survey Evidence on Rationality.” Review of Economics and Statistics64:57–161.
Manski, Charles F. 1993. “Adolescent Econometricians: How Do Youth Infer the Returns to Schooling?” In Studies of Supply and Demand in Higher Education, eds. C. Clot elder, and M. Rothschild, Chicago: University of Chicago Press, 43–60.
Matlin, Matt.W., and Stang, David. 1978. “The Pollyanna Principle: Selectivity in Language, Memory and Thought,” Cambridge, Mass.: Schenkman.
Moulton, Bent. 1990. “An Illustration of a Pitfall in Estimating the Effects of Aggregate Variables on Micro Units.” Review of Economics and Statistics334–38.
Nickell, Steven. 1979. “Education and Lifetime patterns of Unemployment.” Journal of Political Economy117–31.
Nickell, Steven, and Bell, Brian. 1995. “The Collapse in Demand for the Unskilled and Unemployment across the OECD.” Oxford Review of Economic Policy40–62. Solon, Gary. 2002. “Cross-Country Differences in Intergenerational Earnings Mobility.”
Sternberg, Richard, and Richard Wagner. 1986. “Practical Intelligence.” Cambridge:
Cambridge University Press.
Varga, Julia. 2001. “Earnings Expectations and Higher Education Enrolment Decisions in Hungary.” Budapest WP on the Labour MarketBWP 2001/10.
Webbink, Dinand, and Joop Hartog. 1999. “Can Students Predict their Starting Salary? Yes!” Netherlands: University of Amsterdam. Unpublished.
Winter-Ebmer, Rudolf, and Aniela Wirz. 2002. “Public Funding and Enrolment into Higher Education in Europe.” Austria: University of Linz. Working paper 0202, University of Linz, Austria.