9
The Impact of Indonesia’s Banks Performance towards Banks’ Stock Price
(Listed in Indonesia Stock Exchange from 2011
–
2013) Using CAMEL Analysis
Albertus Andre Sujarwo
International Business Management Program, Petra Christian University Jl. Siwalankerto 121-131, Surabaya
E-mail: [email protected]
ABSTRACT
Although banking industry in Indonesia is facing dynamic challenges every year, banking industry in Indonesia is considered as one of most profitable sectors in Indonesia. This occurance leads to investor preferance in banking industry stocks. In this research, it is believed, profitability is not the only measurement of bank performance which affect stock price. In this problem, other factors as formulated through CAMEL analysis (Capital Adequacy, Asset Quality, Management Quality, Earnings, Liquidity) is a bank performance measurement which affect bank stock price. This research has successfully collected data of 31 banks in Indonesia listed at Indonesia Stock Exchange from 2011 – 2013. Those data is processed with linear regression analysis which proves that CAMEL analysis has significant impact towards bank stock price simultaneously. Partially, only Asset Quality, Management Quality, and Earnings have significant impact towards bank stock price.
Keywords: Bank Performance, Stock Price, and CAMEL Analysis.
ABSTRAK
Meskipun industri perbankan di Indonesia tengah menghadapi tantangan yang dinamis setiap tahunnya, industri perbankan di Indonesia dianggap sebagai salah satu sektor yang paling menguntungkan di Indonesia. Hal ini membuat harga saham di sektor perbankan lebih disukai investor daripada sektor la innya. Dalam penelitian ini, profitabilitas bukan satu-satunya pengukuran performa bank yang memengaruhi harga saham. Dalam penelitian ini pula, diyakini faktor lain yang dirumuskan melalui analisa CAMEL (Capital Adequacy, Asset Quality, Management Quality, Earnings, Liquidity) sebagai pengukuran performa bank yang mampu memegaruhi harga saham bank. Penelitian ini berhasil mengumpulkan data dari 31 bank di Indonesia yang terdaftar di Bursa Efek Indonesia dalam periode 2011 – 2013. Data tersebut diolah melalui regresi dengan analisa jalur yang berhasil membuktikan ba hwa analisa CAMEL memiliki pengaruh yang signifikan terhadap harga saham bank secara simultan. Secara parsial, hanya Asset Quality, Management Quality dan Earnings memiliki pengaruh yang signifikan terhadap harga saham bank.
Kata Kunci: Performa Bank, Harga Saham dan Analisa CAMEL.
INTRODUCTION
Indonesia’s financial sector is considered as one
of the growing areas in Indonesia. According to Indonesia Bureau of Statistics (Statistik, 2015),
Indonesia’s financial sector is considered as one of key sectorial growth in Indonesia from 2007 – 2013 with a cumulative annual growth rate of 15%. Under
Indonesia’s financial sector, there are two sectors that are banking and non-bank financial institutions.
Indonesia’s banking sector alone accounts 70% of the
Indonesia’s financial sector GDP. It can be inferred
that Indonesia's banking sector drives Indonesia's financial sector. Indonesia’s banking sector production or turnover according to Euromonitor research, has grown at cumulative annual growth rate of 13% from 2007 – 2012 and it is expected to continue growing at cumulative annual growth rate of 10% from 2013 – 2018 (Monetary Intermediation In Indonesia : ISIC 651, 2013). This phenomenon tells
that Indonesia’s banking sector is a growing sector.
10 Banking Statistics, 2014), increased regulatory requirement (PricewaterhouseCoopers Indonesia, 2013), and margin pressure (PricewaterhouseCoopers Indonesia, 2014). Further, Banks in Indonesia in the future will focus on capital utilization and increase capital efficiency for the strategic goals (PricewaterhouseCoopers Indonesia, 2013). These challenges here will require banks in Indonesia to have better performance to overcome them. Bank’s performance will be then reflected through their stock prices, that is why it is important to measure what
affects bank’s stock price.
These multiple challenges that Indonesia’s banks face currently also triggers them to assess their
performance well and bank’s performance can be seen
from its tasks. Bank’s primary task according to the regulation of Indonesia is as an intermediary to collect fund from society, to give lending (Undang - Undang Nomor 10 Tahun 1998, 1998). Bank's tasks are not limited to issue a bond, borrow fund, transfer fund, but also to give lending (Undang - Undang Nomor 10 Tahun 1998, 1998). Aligned with the tasks, Bank Indonesia mentions that the critical point of bank performance lies in the risk profile, corporate governance, earnings and capital (Surat Edaran Bank Indonesia Nomor 13/24/DPNP, 2011). Therefore,
measuring bank’s performance should cover risk,
earnings, capital, and the governance, and this can be done through CAMEL analysis.
CAMEL method is an approach that tries to
measure banks’ overall condition using a balanced
sheet (Crystal, Dages, & Goldberg, 2002). “CAMEL method specifically assess five elements of banks’ financial condition and performance that are capital adequacy, asset quality, management, earnings and
liquidity” (Crystal, Dages, & Goldberg, 2002). This overall performance of banks here will eventually be reflected the their stock prices. Share price in a bank
represents bank’s market capitalization or bank’s
worth as mentioned by Gitman (2010) that market capitalization is a multiple function of share price and total outstanding shares (Gitman, Juchau, & Flanagan, 2010). The share price according to efficient market hypothesis fully reacts towards all available information (Fama, 1970). With the underlying theory of Fama (1970), the share price will act towards all information provided to investors to make a decision whether to sell or buy stock. All information provided are mostly to measure the performance of a bank and yet it is not limited to its earnings only. Therefore, the judgment on the performance is essential and, as a result, overall bank’s performance is needed and hence, this research suggest using CAMEL method.
Thus, the aim of this research is to see if capital adequacy, asset quality, management, earnings, and liquidity (CAMEL) simultaneously and individually
impacts bank’s stock price.
LITERATURE REVIEW
In this research, the literature review will be seen from the aspect of two concepts which are bank’s performance and stock price. Bank performance measurement will be CAMEL analysis and stock price is common stock price of banks listed in Indonesia Stock Exchange.
CAMEL analysis was the original form before US regulators added in 1997 with another element to be CAMELS and followed by most bank supervisors worldwide (Grier, 2007). Although CAMEL has developed to be CAMELS, measuring the last component of CAMELS which is sensitivity to market risk might not be applicable for all commercial banks. The reason is, sensitivity of market risk measures the how changes in interest rates, foreign exchanges rates, commodity prices can affect the earnings which are applied to institutions with foreign operations and trading activities (Grier, 2007). Not all of commercial banks have those activities. Further, sensitivity to market risk is an extension of the liquidity component on CAMEL analysis (Grier, 2007). Therefore, in this study, sensitivity to market risk is not applied.
The first component of CAMEL is capital adequacy. Capital adequacy is capital that needs to be maintained by financial institutions in order to prevent
losses as well as to protect financial system’s debt
holders since financial institutions are exposed to risk, and capital adequacy can be measured through risk-based capital adequacy ratio (Dang, 2011). Risk-based capital adequacy ratio is a framework agreed by Basle Committee in 1988 for banking supervision. Risk-based capital adequacy ratio is a framework to set a minimum level of capital for banks, and national authorities are allowed to set higher level. There are two main objectives of capital adequacy ratio. The first objective is to strengthen the stability of international banking system and the second goal is this framework (risk-based capital adequacy ratio) has consistency and fairness level while applied to banks in different countries (Supervision, 1988). Risk-based capital adequacy ratio considers risks of banks to be inserted to measure bank’s strength or performance. The risks to consider are credit risk, interest rate risk, and investment risk on securities. Risk-weighted capital adequacy ratio can be calculated by a formula which is
� − � �
= � − �� + � ℎ � + �
Asset quality is the second measurement of
bank’s performance using CAMEL analysis.
According to Uniform Financial Institutions Rating
System (1997), Asset Quality reflects “the quantity of
existing and potential credit risk associated with the loan and investment portfolio, other real estate owned, and other assets, as well as off-balance sheet
11 System, 1997). Asset quality is considered as an important element since according to Grier (2007) most bank failures are caused by poor asset quality. Asset quality here, help banks to look directly at the current state of credit portfolio (Sundararajan, et al., 2002). Sundararajan et al. (2002) explains that credit is an asset in which the counterparty incurs debt liability. Credit here includes loans and securities other than shares such as bonds and miscellaneous receivables. Credit portfolio is the largest category of assets since it bears the greatest risk of losses derived from the delinquent loans (Dang, 2011). Therefore, measuring asset quality should be seen from the perspective of the credit portfolio. In Indonesia, Bank Indonesia mentions that Non-Performing Loan (NPL) ratio can be the measurement for measuring asset quality that tries to see the position of credit portfolio (Bank Indonesia, 2004) which can be expressed as
= � −�� �
Management quality is the third component of
measuring bank’s performance through CAMEL
analysis. According to Uniform Financial Institutions Rating System (1997), Management Quality is
“the capability of the board of directors and
management in their respective roles to identify, measure, monitor, and control the
risks of an institution’s activities and to ensure a financial institution’s safe, sound, and
efficient operation in compliance with
applicable laws and reflected in this rating”
(Uniform Financial Institutions Rating System, 1997).
According to Bank Indonesia, management assessment is intended to evaluate the managerial capability of a bank management in conducting business. Management quality is usually assessed at the last since this evaluation brings together all of the important areas (Grier, 2007). Well, managed banks have good capital adequacy, good asset quality, good profit as well as real liquidity, thus seeing management quality is done after reviewing those other elements of CAMEL (Grier, 2007). Unlike other components of CAMEL, measuring management quality is usually done qualitatively (Grier, 2007). In Indonesia, Bank Indonesia suggests that measuring management quality of banks is seen from an aspect which is general management. In measuring management quality, Bank Indonesia has set 10 questions regarding general management and 15 questions regarding risk management. Each of the questions will be scored from 0 to 4 and the higher the score the better the management quality (Kodifikasi Peraturan Bank Indonesia, Kelembagaan, Penilainan Tingkat Kesehatan Bank, 2012). Yet, according to Grier (2007), there are two ways to measure management quality which are through qualitative and quantitative. Measuring management quality through quantitative analysis can be done through ratio analysis. Grier (2007) mentions that although
qualitative approach is somehow more advised on measuring management quality, quantitative approach can also tell about the management quality of the bank as well. Measuring management quality through a quantitative approach can be done through efficiency ratio which is expressed as
� = −� �
Earnings is the fourth element of CAMEL to
measure bank’s performance. Nikolai (2010) tries to explain to define earnings as “the amount of earnings
from a corporation’s income-producing activities
during its accounting period” (Nikolai, Bazley, & Jones, 2010). According to Bank Indonesia, Bank Indonesia suggests to use Net Operating Margin (NOM) to measure earnings which is experssed as.
= � � �
Liquidity is the fifth element of CAMEL to
measure bank’s performance. Liquidity of a company according to Nikolai (2010) “is an indication of its
ability to meet its obligations when they come due” (Nikolai, Bazley, & Jones, 2010). According to Grier (2007) there are two primary objective why liquidity is important for banks. The first reason is that liquidity is needed “to satisfy demand for new loans without having to recall existing loans or realize term investments such as bond holdings” (Grier, 2007).
The second reason is that liquidity is needed “to meet
daily and seasonal swings in deposits so that withdrawals can be fulfilled in a timely and orderly fashion” (Grier, 2007). According to Bank Indonesia, measuring liquidity can be done through Loan to Deposit Ratio (LDR) which is expressed as
� = �ℎ� ��ℎ� �� � � �−
Third party credit non-bank is those credits given to third party only excluded from non-bank as well as excluded from related party. Third party deposits here includes time deposits, demand deposits and savings excluded from bank demand deposits and inter-bank time deposits). The indicator is that the higher the rate, the worse liquidity that bank has (Bank Indonesia, 2004).
Stock price in a bank represents bank’s market capitalization or bank’s worth as mentioned by
Gitman et al. (2010) that market capitalization is a multiple function of stock price and total outstanding shares. It can be said that the stock price is the
representation of bank’s value which is dominated in
money term. In this study, the stock that is indicated for study is common stock since common stock is initially issued by the company to raise equity capital whereas preferred stock is will be published later when the company requires more capital. Further, common stockholders are the real owners of the enterprise (Gitman, Zutter, Elali, & Al-Roubaie, 2013).
12 generated by some fundamental factors such as market mechanism (demand and supply), company value and the profitability of the company whereas external factors include market shocks from macroeconomic indicators, policies, global economic condition and psychological biases (Zheng & Chen, 2013). Further, Zheng (2013) that information inside and outside the stock market takes part in determining stock price. He tells that this internal and external factor is called as market forces.
Zheng (2013) explanation is supported by Gitman et al. (2013). Gitman et al. (2013) tells that buyers and sellers will make their purchase and sale activities as soon as they know new information available which creates a new market equilibrium for price quickly. From Zheng (2013) and Gitman et al. (2013) statements, it is believed that information availability determines the driver of stock price. This argument is supported by Fama (1970) in his efficient-market hypothesis said that stock prices fully react all public information available (Fama, 1970). The available public information is usually financial statement which reflects company’s performance during the reported year. Another concept of stock valuation which is through behavioral finance also claims that stock prices reflect accurately actual value of risk and return of the company (Gitman, Zutter, Elali, & Al-Roubaie, 2013). In conclusion, stock price is affected by the performance of the enterprise on its ability to mitigate the risk and its ability to bring returns to the stockholders.
Relationship between CAMEL Analysis and Stock Price
In this research, the researcher is using two main theories which are CAMEL analysis as a measurement of bank performance, as well as the stock price. CAMEL analysis shows a comprehensive
study of a bank’s performance adopted by regulators
and banks themselves. Using these two underlying theories, the researcher intends to see the cause and effect relationship between them.
CAMEL analysis consists of capital adequacy, asset quality, management quality, earnings, and liquidity. These five factors are believed to give direct impact to the bank stock price. When the capital is adequate to protect the bank from debts and losses, it will confirm that the bank is running and performing well so that it will keep stock price rises. This impact
also happens when the quality of banks’ assets are not
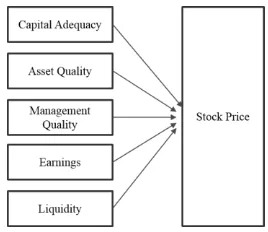
associated with high risk of loss, when the management of the banks is performing well, when banks have good earnings or profitability as well as when banks can meet its obligations. In conclusion, the relationship between the two concepts, which are CAMEL analysis and stock price can be sum up in the following figure.
Figure 1. Relationship between Concepts
As the relationship between concepts have been developed, the researcher then will develop hypotheses which are
1. Capital adequacy, asset quality, management quality, earnings and liquidity simultaneously impact stock price listed in Indonesia Stock Exchange from 2011 – 2013
2. Capital adequacy, asset quality, management quality, earnings and liquidity individually impact stock price listed in Indonesia Stock Exchange from 2011 – 2013
RESEARCH METHOD
According to the type of research defined by Cooper & Schindler (2014) which are reporting, descriptive, causal-explanatory and causal-predictive, this research is a causal explanatory study which the researcher intends to explain the relationship between
bank’s performance and bank’s stock price. This
research will see how bank’s performance through CAMEL analysis as an independent variable will
affect bank’s stock price as a dependent variable. Cooper & Schindler (2014) further mentions that the causal-explanatory study would like to describe the cause of one or more problems. In this research, bank 's performance through CAMEL analysis will act as the cause of bank’s stock price.
In term of research technique, Cooper and Schindler (2014) divides into two which are qualitative and quantitative research. This research will be quantitative research since quantitative research is the research which purpose is to describe or predict, build and test theory through pecise count (numerical data) and usiang statistical and mathematical analysis. The theory that the researcher
intends to test is to see the impact of bank’s
performance through CAMEL analysis towards
bank’s stock price. As quantitative research requires statistical analysis, the data gathered in this research will be processed through SPSS as the statistical tool and the researcher intends to use multiple linear regression analysis
13 (2014), the dependent variable is the variable which is measured and monitored by the researcher or being expected to be affected by independent variable(s). In
this research, the dependent variable is the bank’s
stock price as the result of the independent variable. In order to see the bank’s stock price, this research will use closing price. The reason is the closing price is the price made after the final evaluation of the stock through a day. Closing price may be made on the first hour trading with no sales is affected. Yet, it becomes the base for traders to investment plan on the following day (Edwards, Magee, & Bassetti, 2012). Therefore, in this research, the researcher will make closing price (monthly, as available in Indonesia Stock Exchange) as bank’s stock price for a dependent variable
According to Cooper & Schindler (2014), an independent variable is the variable used by the researcher which gives a change or an impact towards the dependent variable. In this research, the independent variable is bank’s performance through
CAMEL analysis since bank’s performance will make
changes in dependent variable which is stock price. CAMEL analysis consists of five elements which are capital adequacy, assets quality, management quality, as well as liquidity.
Each of the ratio used in measuring bank’s
performance is taken from Bank Indonesia, which is in line with Basel II Accord, as well as from Grier (2007). In this research, only measuring management quality uses a method from Grier (2007) since Bank Indonesia only uses a qualitative approach to measuring management quality. Each of the ratios will generate a number which later being used by the researcher to be further processed in statistical analysis.
According to Cooper and Schindler (2014), there are four types of data level which are nominal, ordinal, interval and ratio. In this research, the data gathered by the researcher is categorized as ratio data level which represents the actual amounts of a variable. Further, data in ratio data level means the data can be classified in mutually exclusive and collectively exhaustive category and it can be ordered also there is the distance between the data, and there is natural origin. Cooper and Schindler (2014) also mention that ratio scales can be found in many of the business research. Therefore, both data for a dependent variable and independent variables are categorized in ratio data level.
Cooper and Schindler (2014) also mentions there are types of data based on the classification which are primary, secondary and tertiary. In this research, the data will be secondary data. Secondary data is the interpretation of the primary data (original data or work without interpretation). Data included in secondary data will be encyclopedias, textbooks, magazines, newspaper article, and all reference materials including the annual report (Cooper &
Schindler, 2014). Aligned with the explanation from Cooper and Schindler (2014), the data for independent variable will be taken from respected
bank’s annual report, and for dependent variable will
be taken from Indonesia Stock Exchange closing price
of respected bank’s stock. Not related to the
independent and dependent variable, the researcher also takes information from textbooks, journals, articles as well as published materials such as rules and regulations as the underlying principles of this research. Therefore, it can be said that the researcher uses secondary data for this source.
In gathering intended data which later will be processed with statistical analysis, the researcher can use the sample. The sampling method that the researcher will use is nonprobability sampling method. Nonprobability sampling is kind of sampling which subjective approach is included and the probability cannot be determined. In nonprobability sampling, the researcher may select the sample based on the interest to conform certain criterias. The criterias are the availability of financial data through published and audited financial report for three years (2011-2013), as well as daily closing stock price. These two criterias bring the researcher to take
samples from Indonesia’s stock exchange. Among the
population of 41 listed banks in Indonesia stock exchange, the sample taken will be all of the listed banks in Indonesia stock exchange which is 31 banks for three years (2011-2013) which results in 93 observations. The reason researcher intends to have three years is because the researcher wants to have a large sample and have similarities among its sample in terms of economic environment.
When the data has been collected, those data will be processed to certain analytical methods which are validity and reliability, classic assumption test, F-test, t-test as well as Coefficient of Determinant (R2).
According to Cooper and Schindler (2014), validity is a measurement characteristic which concerns on the measurement test which a researcher intends to measure. Reliability, on the other hand, is a measurement characteristic which concerns on the consistency, accuracy, and precision. Therefore, it can be said that validity and reliability will tell how a measurement is correct and consistent to measure what a researcher wishes to measure.
Since this research is using secondary sources, Cooper and Schindler (2014) suggests that the researcher should evaluate the source through five factors which are purpose, scope, authority, audience, and format to verify information from website and to evaluate the secondary sources. Each of the factors should be answered several questions by the researcher.
The source of this research will be taken from
published and audited bank’s annual report listed on
the Indonesia Stock Exchange for independent
14 closing price taken from Indonesia stock exchange for dependent variable. In purpose, Cooper and Schindler (2014) explains that it will answer the explicit or hidden agenda of the information source. The purpose of the source is to inform the current financial position of the bank given to the public as the stakeholders. In scope, it will answer the topic coverage of the source including depth and breath, time, geographic as well as the criteria of the information. The extent of the independent variable source is covering the financial position of the respected bank telling all business activities in a fiscal year in Indonesia. The scope of the dependent variable source is covering the price per stock of a bank on a daily basis in Indonesia.
In authority, it will answer the level of the data and the credentials of the authors. In terms of authority for an independent variable, the source is taken from the audited annual report and publish on the corporate website. Those annual reports become legitimate since they are made by the audit committee of the banks, audited by the external auditor as well as authorized by the board of commissioners and board of directors. Bank Indonesia mentions that the audit committee of the bank includes one independent commissioner, one independent body who has expertise in finance or accounting, and one independent body who has expertise in banking and law. The audit committee then will supervise and evaluate on the process financial reporting. The audit committee will recommend an external auditor to the board of commissioner to externally audit the performance of the bank. The role of external auditor
here is to create transparency of bank’s financial
performance. Then, when it is published, it has been authorized before by the board of commissioner and board of directors (Peraturan Bank Indonesia Nomor 8/4/PBI/2006 Tentang Pelaksanaan Good Corporate Governance bagi Bank Umum, 2006). For the dependent variable, the source is legitimate as well since it is taken from Indonesia stock exchange. In the Indonesian regulation, stock exchange is an established entity which objective is to carry on stock trading. Indonesia stock exchange is also part of capital market which has the right to publish stock price. (Undang - Undang Republik Indonesia Nomor 8 Tahun 1995 Tentang Pasar Modal, 1995)
In audience, it will answer the background of the people who will use or see the data later on. Data gathered in independent variable, and the dependent variable is aimed to inform and tell people at large, investors, stakeholders and shareholders who have an interest in the respected company or bank. The audience of this data cannot affect the type and bias of the information or data. In format, it will answer the degree of how the data is shown. For both independent and dependent variables, the data are easy to find since it is widely published.
Overall, the data of this research is valid and reliable since the researcher takes the data from the published audited financial report and Indonesia stock exchange because those sources have credentials and are valid to be used in this research. Further, the audited financial statements will give accuracy and
consistency in measuring the bank’s financial
performance following the financial reporting system in Indonesia.
Before conducting multiple linear regression analysis, classic assumption test should be performed. Ghozali (2013) mentioned that in Ordinary Least Square (OLS) regression estimate method, all classic assumption tests should be passed in order to have Best Linear Unbiased Estimator (BLUE) result. Classic assumption tests consist of multicollinearity, autocorrelation, heteroscedasticity, and normality.
To see whether there is multicollinearity in the model, the researcher will see from Variance Inflation Factor (VIF) value. If VIF value is larger or equal to 10, then it can be said there is multicollinearity in the model. In autocorrelation test, the researcher will use Durbin-Watson test. If the Durbin-Watson value from the SPSS is between the du and 4-du, then it means there is no autocorrelation between the residuals in the regression.
In heteroscedasticity test, the researcher will use Glejser test. In Glejser test, researcher should regress the absolute value of residuals with the independent variables. Then from the regression result, the researcher should see the Significance or the P-value. If the P-value of the regression of absolute value of residuals with independent variables is higher than alpha (0.05) it means that there is no heteroscedasticity in the model. In normality test, the researcher will use Kolmogorov-Smirnov test. In Kolmogorov-Smirnof test, the undstandardised residual is used to be placed into the test. The result of the test will generate numbers and Asymp Sig. If the number of Asymp. Sig is above the alpha of (0.05) it means that there is normality between the residuals in the regression model.
Cooper and Schindler (2014) explains that when a researcher tries to observe the value of X estimate or predict the corresponding value of Y, the process is called as a simple prediction. If there are more than one X variable used, the outcome will be multiple predictors. Since there will be more than one X variable or independent variable to estimate Y variable or dependent variable in this research, the researcher here shows the multiple linear regression equation which follows Lind et al. (2012)
̂ = + + ⋯ + +
Where :
̂ = the Y estimate value from selected X value = the intercept
b1, 2, ... k = the slope of independent variable 1, 2, ... k
15 The intercept is the value of ̂ if the value of X is zero. The slope indicates the value change in ̂ when there is change in one unit of X (Lind, Marchal, & Wathen, 2012). In multiple regression analysis, Ghozali (2013) mentions that it is essential to see the accuracy of the regression function to predict the dependent variable which is through goodness-of-fit. There are critical factors to analyze goodness-of-fit in the multiple linear regression which are F-test, t-test, and the coefficient of determination (R2). F-test and
t-test try to examine whether the independent variables have a significant impact towards the dependent variable (Cooper & Schindler, 2014).
The aim of F-test is to see whether in the regression model all of the independent variables have a simultaneous impact towards the dependent variable (Ghozali, 2013). In F-test, the researcher will see it from the ANOVA table generated from the SPSS in regressing the variables. On the ANOVA table, the researcher will compare the p-value to the alpha or the F-value to F-table. If the p value is smaller than alpha (0.05) or the F-value (F-test statistic) is larger from the F-table (F-critical value), it means that independent variables simultaneously impact to the dependent variable (Ghozali, 2013).
The aim of t-test is to see how far the impact of the independent variable partially or individually to explain the dependent variable (Ghozali, 2013). The researcher will do the t-test through comparison of t statistic value with the critical point according to the t table. If the t statistic value from calculation is greater or lower than t value on the table or the p value is lower than alpha, it means that the independent variable individually impact towards the dependent variable.
In coefficient of determination (R2) Ghozali
(2013) mentions that the purpose is to see how good the model can explain the dependent variable. The value of the coefficient of determination (R2) is
between zero to one. Small value of the coefficient of determination (R2) means that there is a limitation in
the independent variable to explain the dependent variable. On the other hand, if the value of the coefficient of determination (R2) is close to one, it
means that the independent variable almost can explain all of the information to predict the variation of the dependent variable. The weakness of coefficient of determination (R2) is that there is a bias in the total
number of the independent variable placed in the model. Additional independent variable will increase the value of the coefficient of determination (R2)
regardless whether that independent variable significantly impacts the dependent variable. Therefore, many other researchers suggest that using adjusted R2 is better than R2 alone since adjusted R2 is
adjusted for the excessive usage of unimportant independent variables. Therefore, the researcher will
use adjusted R2 for its coefficient of determination and
the result is taken from this following formula
� � = − − � − −−
On the formula, n refers to the sample size, and k refers to the number of independent variables (Ghozali, 2013).
RESULTS AND DISCUSSION
The result will consist of classic assumption test, F-test, t-test and Adjusted R-square. The variables that are tested here are Price as dependent variable, CAR (Capital Adequacy), AQ (Asset Quality), ER (Management Quality), NOM (Earnings) and LDR (Liquidity) as the independent variables. The researcher has successfully gathered 93 data of which 31 Indonesian banks listed before 2011 for 3 years (2011 – 2013).
The first result is classic assumption test. Classic Assumption is essential since Ghozali (2013) mentioned that in Ordinary Least Square (OLS) regression estimate method, all classic assumption tests should be passed in order to have Best Linear Unbiased Estimator (BLUE) result. Classic assumption tests consist of multicollinearity, autocorrelation, heteroscedasticity, and normality. The result of classic
assumption test is summed up in the following table From the classic assumption tests performed on the model that the researcher has, the model did not pass normality and heteroscedasticity test. It means that there is no normality between the residuals in the model as well as there is heteroscedasticity between the residuals in the model. Since, the model did not pass all of the classic assumption tests, the model cannot be said to have Best Linear Unbiased Estimator (BLUE) result. In order to have Best Linear Unbiased Estimator (BLUE) result, Ghozali (2013) suggests transforming the data. Ghozali (2013) mentions if there are both normality and heteroscedasticity problems in the model, the researcher can transform into two ways that are double-log and semi-log regression model.
Ghozali (2013) explains that the double-log regression model is a transformation to apply function Ln in each of the independent and dependent variable in the model. However, it is noted that Ln function is not advised when there is a negative value or zero value in the data of the variable. Semi-log, on the other hand, is a transformation to apply function Ln in either dependent variable or independent variable.
16 Therefore, double-log transformation as well as semi-log transformation with the application of function Ln in the independent variable cannot be performed.
After the data has been transformed, or in this case the dependent variable is transformed to be a Ln function, classic assumption test should be performed as well to the transformed model. The principle is still the same, that in order to have Best Linear Unbiased Estimator (BLUE) result the transformed model should pass all of the classic assumption tests. The result of classic assumption test for transformed data is summed up on the following table
After conducting two classic assumption test sets, transformed model has passed all of the classic assumption tests. Therefore, the transformed model can be expected to have Best Linear Unbiased Estimator (BLUE) result. Then, this transformed model can be proceeded with the multiple linear regression analysis. Under this analysis, the goodness-of-fit is also conducted by seeing through F-test, t-test, and the adjusted R-square.
The result of the F-test can be seen in the ANOVA table as shown in Table 4.9. From the ANOVA table, it is seen that the significance F is 0.000, which is far below from the significance level or alpha of 0.05. Further, the F-value of 22.185 is also far beyond the F-table of 2.4740. Hence, it can be concluded CAMEL analysis or capital adequacy, asset quality, management quality, earnings and liquidity as the independent variables have simultaneously significance influence on the dependent variable which is stock price.
Table 1. ANOVA Table
Model Sum of Squares df Mean Square F Sig. 1 Regression 106,368 5 21,274 22,185 ,000b
Residual 83,426 87 ,959 Total 189,794 92
The result of the t-test can be seen from table of regression coefficient.
Table 2. Table of Regression Coefficient
Model
Unstandardized Coefficients
Standardized Coefficients
t Sig. B Std. Error Beta
1 (Constant) 3,758 ,600 6,263 ,000 CAR -2,873 2,248 -,096 -1,278 ,205 AQ -24,847 6,608 -,350 -3,760 ,000
ER 2,858 ,491 ,869 5,822 ,000
NOM 81,618 9,365 1,188 8,715 ,000
LDR ,046 ,108 ,031 ,430 ,669
a. Dependent Variable: LnPrice
By using the table of regression coefficient, the regression model, can be developed which is shown as
Ln (Y) = - 0.96X1 – 0.350X2 + 0.869X3 + 1.188X4 + 0.31X5
The capital adequacy’s significance t of 0.205 is
higher than the alpha of 0.05, and the capital
adequacy’s t-test statistic of -1.278 is in between of the t critical value of -1.9861 and 1.9861. Therefore, it means capital adequacy does not have significance influence on stock price.
The asset quality’s significance t of 0.000 is far below than the alpha of 0.05, and the asset quality’s t -test statistic of -3.760 is in below the t critical value of -1.9861. Therefore, it means asset quality has significance influence on stock price. Further, having the standardized coefficient in asset quality is -0.350, it means for every 1 standard deviation increase the ratio in non-performing Loan (NPL) of Asset Quality, Ln(Y) will decrease 0.350 standard deviation or Y (stock price) will decrease 1.4191 standard deviation from its mean.
The management quality’s significance t of
0.000 is far below than the alpha of 0.05, and the
management quality’s t-test statistic of 5.822 is in above the t critical value of 1.9861. Therefore, it means management quality has significance influence on stock price. Further, having the standardized coefficient in management quality is 0.869, which means for every 1 standard deviation increase in the efficiency ratio of management quality, Ln(Y) will increase 0.869 standard deviation or Y (stock price) will increase 2.3845 standard deviation from it mean.
The earnings’ significance t of 0.000 is far below than the alpha of 0.05, and the earnings’ t-test statistic of 8.715 is in above the t critical value of 1.9861. Therefore, it means earnings have significance influence on stock price. Further, having the standardized coefficient in earnings is 1.188, it means for every 1 standard deviation increase in the Net Operating Margin (NOM) ratio of earnings, Ln(Y) will increase 1.188 standard deviation or Y (stock price) will increase 3.2805 standard deviation from it mean.
The liquidity’s significance t of 0.669 is higher than the alpha of 0.05, and the liquidity’s t-test statistic of 0.430 is in between of the t critical value of -1.9861 and 1.9861. Therefore it means liquidity does not have significance influence on stock price.
Among those five CAMEL Analysis element, capital adequacy and liquidity are confirmed not to
have significance influence on bank’s stock price
17 sufficient capital to pay long-term maturity debst (Agtarap & Juan, 2007). Liquidity, on the other hand is defined as short-term power which allow companies to stay in the business by showing an ability to pay current maturing obligations (Agtarap & Juan, 2007). Asset quality, management quality, and earnings are more into profit opportunity generated by banks as supported by Grier (2007). Profitability is the ability of company to generate profits (Agtarap & Juan, 2007). Among profitability, solvency, and liquidity, investors or in this case shareholders are focused on the profitability more (Agtarap & Juan, 2007). Shareholders want to make sure if they are investing in the profitable companies so that they will receive profit through selling their shares at higher prices (Agtarap & Juan, 2007). Therefore, only asset quality, management quality and earnings have individual significance towars the bank stock price.
Adjusted R Square is used to examine how the independent variables can explain the variation in the dependent variable, adjusted for the number independent variables used. The summary can be seen from the following table
Table 3. Adjusted R Square
Model R R Square
Adjusted R Square
Std. Error of the Estimate
1 ,749a ,560 ,535 ,97924
a. Predictors: (Constant), LDR, AQ, CAR, NOM, ER b. Dependent Variable: LnPrice
From the table 3, the Adjusted R Square is 0.535, which means that 53.5% of the variation in the bank stock price as the dependent variable, can be explained by the CAMEL analysis (capital adequacy, asset quality, management quality, earnings, and liquidity) as the independent variables and 46.5% of the variation in the bank stock price as dependent variable is explained by other variables aside from CAMEL analysis (capital adequacy, asset quality, management quality, earnings, and liquidity) such as demand and supply, company value, market shocks from macroeconomic indicators, policies, global economic condition as well as psychological biases (Zheng & Chen, 2013).
CONCLUSION
As the questions have been developed, and findings have been presented, the researcher will summarize the all the discussion in this research. Initially, the researcher has developed questions regarding CAMEL analysis as the rating system to
measure bank’s soundness towards bank’s stock price.
The researcher has developed questions to see whether CAMEL analysis that comprises capital adequacy, asset quality, management quality, earnings and liquidity to have simultaneous and partial impact
towards bank’s stock prices. The developed questions
have been the main objectives of this research and to
be answered throughout this research as well. The researcher has finally come out with a result that CAMEL analysis has a simultaneous impact towards
the bank’s stock price which means the hypothesis is
verified. Further, when the researcher tested whether CAMEL analysis has partial or individual impact
towards bank’s stock price, only asset quality,
management quality, and earnings to have an impact
towards bank’s stock price individually. From the
result presented, the researcher has accomplished the objectives of this research that is to see whether CAMEL analysis has simultaneous and partial impact
towards bank’s stock price. It is concluded that
CAMEL analysis has simultaneous impact towards
bank’s stock price, and partially, only asset quality, management quality and earnings are among CAMEL
which have significant impact towards bank’s stock
price.
In this research as well, the researcher admits to have several limitations such as limited independent variables, limited time frame, as well as limited sample scope. Regarding limited independent variables, the researcher is only able to use CAMEL analysis and the result of Adjusted R-Square is only 53.5%. Therefore to improve the Adjusted R-Square, the suggestion will be to insert more theories for the independent variables from theories of Zheng & Chen (2013). Regarding time frame, the researcher is only able to capture from 2011 to 2013. In order to capture broader economic environment in Indonesia especially in banking industry the upcoming researcher can have extended time frame. Lastly, regarding sample scope, the researcher here is only able to examine 31 banks listed on Indonesia Stock Exchange before 2011 which only comprises national private and national state-owned banks. As a result, the sample does not include those foreign-owned banks in Indonesia since they are not listed in Indonesia Stock Exchange and act as branch office alone. Therefore, In order to see the impact of banks performance in Indonesia from more perspective, the upcoming researcher may include foreign banks operating in Indonesia to the sample scope. By adding more sample scope, the result of the result can represent more about Indonesia banking performance and its relationship towards the banks stock price, and it is not limited to national private and state-owned banks only.
REFERENCES
Agtarap, D., & Juan, S. (2007). Fundamental of Accounting Basic Accounting Principles Simplified for Accounting Students. Bloomington: AuthorHouse.
18 Cooper, D. R., & Schindler, P. S. (2014). Business
Research Methods Twelfth Edition. McGraw-Hill.
Crystal, J. S., Dages, G., & Goldberg, L. S. (2002). Has Foreign Bank Entry Led to Sounder Banks in Latin America? Federal Reserve Bank of New York Current Issues in Economics and Finance, 2 - 5.
Dang, U. (2011). The CAMEL Rating System in Banking Supervision. A Case Study. Degree Thesis. Arcada University of Applied Sciences.
Edwards, R. D., Magee, J., & Bassetti, W. (2012). Technical Analysis of Stock Trends, Tenth Edition. CRC Press.
Fama, E. F. (1970). Efficient Capital Markets : A Review of Theory and Enpirical Work. The Journal of Finance, Vol. 25 No. 2, 383-417. Ghozali, I. (2013). Aplikasi Analisis Multivariate
dengan Program IBM SPSS 21 Update PLS Regresi. Semarang: Badan Penerbit Universitas Diponegoro.
Gitman, L. J., Juchau, R., & Flanagan, J. (2010). Principles of managerial finance. Pearson Higher Education.
Gitman, L. J., Zutter, C. J., Elali, W., & Al-Roubaie, A. (2013). Principles of Managerial Finance Arab World Edition. Prentice Hall.
Grier, W. A. (2007). Credit analysis of financia l institutions. Euromoney Books.
(2014). Indonesian Banking Statistics. Jakarta: Otoritas Jasa Keuangan.
Kodifikasi Peraturan Bank Indonesia, Kelembagaan, Penilainan Tingkat Kesehatan Bank. (2012). Pusat Riset dan Edukasi Bank Sentral. Lind, D. A., Marchal, W. G., & Wathen, S. A. (2012).
Statistical Techniques in Business & Economics. McGraw-Hill.
(2013). Monetary Intermediation In Indonesia : ISIC 651. Euromonitor International.
Nikolai, L., Bazley, J., & Jones, J. (2010). Intermediate Accounting 11th edition. Mason: Cengage Learning.
Peraturan Bank Indonesia Nomor 8/4/PBI/2006 Tentang Pelaksanaan Good Corporate Governance bagi Bank Umum. (2006). PricewaterhouseCoopers Indonesia. (2013). Indonesia
Banking Survey. Jakarta: PwC.
PricewaterhouseCoopers Indonesia. (2014). Indonesia Banking Survey. Jakarta: PwC.
Statistik, B. (2015, February 10). Statistics Indonesia. Retrieved from Badan Pusat Statistik: http://www.bps.go.id/eng/pdb.php
Sundararajan, V., Enoch, C., San Jose, A., Hilbers, P., Krueger, R., Moretti, M., & Slack, G. (2002). Financial Soundness Indicators: Analytical Aspects and Country Practices. Washington DC: International Monetary Fund.
Supervision, B. (1988). International Convergence of Capital Measurement and Capital Standards. Basle Committee on Banking Supervision.
Surat Edaran Bank Indonesia Nomor 13/24/DPNP.
(2011). Retrieved from
http://www.ojk.go.id/surat-edaran-bank-indonesia-nomor-13-24-dpnp
Undang - Undang Nomor 10 Tahun 1998. (1998).
Retrieved from
http://www.bi.go.id/id/tentang-bi/uu-bi/Documents/uu_bi_1099.pdf
Undang - Undang Republik Indonesia Nomor 8 Tahun 1995 Tentang Pasar Modal. (1995). (1997). Uniform Financial Institutions Rating System.
Federal Deposit Insurance Corporation. Zheng, X., & Chen, B. M. (2013). Stock Market
Modeling and Forecasting: A System Adaptation Approach. Springer.