IN
2003
MARTINJ. WATTS ANDWILLIAMMITCHELL*
T
here was evidence of a very modest acceleration of wage growth in late 2003. The workplace reform agenda slowed in 2003, with the federal government attempting to outlaw any apparent manifestations of union power, such as pattern bargaining and bargaining fees, through legislative reform. No real progress was made with respect to family friendly initiatives, which might challenge the managerial prerogative for determining hours and other conditions of employment.INTRODUCTION
In this paper we review the wage outcomes in 2003, as well as the institutional developments with respect to the determination of wages and conditions of employment. The macroeconomic environment is the fundamental determinant of the underlying state of the labour market and hence, employment outcomes. Thus, in the first section, we briefly review the state of the macro-economy in 2003, which is followed by an analysis of wage outcomes under the different regimes of wage determination. We explore the time series data on earnings inequality for full-time employees. A detailed analysis of the Safety Net Case is undertaken. The flow-through of industry hourly productivity gains into hourly wages by industry is subject to econometric investigation. Attitudes to executive compensation in the light of corporate scandals in 2002 are examined. In the penultimate section we outline rulings by the Australian Industrial Relations Commission (AIRC) and legislative changes in 2003 that will impact on the determination of wages and conditions of employment. Concluding comments are found in the final section.
MACROECONOMIC BACKGROUND
Macroeconomic forecasts continue to play a key role in the annual deliberations of the Australian Industrial Relations Commission (AIRC) about the appropriate safety net adjustment for award reliant workers. In addition, these forecasts influence the level of the cash rate set by the Reserve Bank and hence, the struc-ture of interest rates, which impact increasingly on households’ living standards, given their growing levels of indebtedness.
Despite a stronger world economy, annual Australian real Gross Domestic Product (GDP) growth to September 2003 remained below 3% but the official rate of unemployment at year’s end was 5.6%, its lowest level since the 1980s.
This decline was largely driven by the fall in the participation rate from 64.1% in December 2002 to 63.8% in December 2003.1The Australian dollar appreciated about 20% over the year and through its impact on import prices the inflation rate was just 2.4%, well within the Reserve Bank’s acceptable range. The inflation rate of non-tradeables was in excess of 4%.
House prices in capital cities grew more than 15% over the year. The demand for credit remained ‘unsustainable’ according to the Reserve Bank (RBA). The continuing growth in housing loans, particularly to investors, and the consequent rise in house prices led to a decline in housing affordability, notwithstanding the historically low interest rates. Consequently, the average debt-servicing ratio2for housing, which stood at under 4% in 1978, and under 5% in 1998, rose above 6% in 2002 (RBA 2003b, p. 21). Over-commitment by some house buyers, which increased the maldistribution of household indebtedness, occurred at a time when the federal government continued to run budget surpluses, thereby increasing net household indebtedness and threatening the sustainability of economic growth. Even moderate interest rate increases could have a significant impact on living standards through rising mortgage repayments.
The Reserve Bank was well aware of the precariousness of the housing bubble, but keen to gently deflate it with interest rate increases, without forcing some home-buyers to sell their properties and precipitate an asset price collapse.
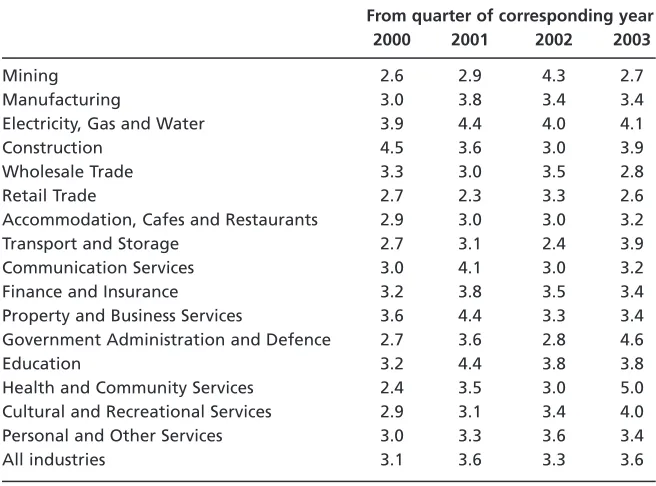
Table 1 Annual percentage increases in ordinary time hourly rates of pay index, excluding bonuses, by industry, September 2000–2002
From quarter of corresponding year
2000 2001 2002 2003
Mining 2.6 2.9 4.3 2.7
Manufacturing 3.0 3.8 3.4 3.4
Electricity, Gas and Water 3.9 4.4 4.0 4.1
Construction 4.5 3.6 3.0 3.9
Wholesale Trade 3.3 3.0 3.5 2.8
Retail Trade 2.7 2.3 3.3 2.6
Accommodation, Cafes and Restaurants 2.9 3.0 3.0 3.2 Transport and Storage 2.7 3.1 2.4 3.9 Communication Services 3.0 4.1 3.0 3.2 Finance and Insurance 3.2 3.8 3.5 3.4 Property and Business Services 3.6 4.4 3.3 3.4 Government Administration and Defence 2.7 3.6 2.8 4.6
Education 3.2 4.4 3.8 3.8
Health and Community Services 2.4 3.5 3.0 5.0 Cultural and Recreational Services 2.9 3.1 3.4 4.0 Personal and Other Services 3.0 3.3 3.6 3.4
All industries 3.1 3.6 3.3 3.6
Toward the end of the year there was evidence of a marginal increase in the growth of wage costs reflecting a tighter labour market (Table 1), following stronger growth in consumption and investment, an improving rural economy following increased rainfall, as well as the strengthening world economy. This evidence underpinned the Bank’s decision to raise the cash rate 25 basis points in November, ostensibly to achieve balanced sustained growth. The RBA acknowledged that the rate of inflation was likely to decline for the foreseeable future given the continued strengthening of the Australian dollar and its impact on the tradeable sector.
A further 25 point increase, which raised the cash rate to 5.25%, took place in December to reduce the degree of economic stimulus from monetary policy. Once the impact of the appreciation of the Australian dollar on the price of tradeables had diminished, the RBA anticipated that the Consumer Price Indexe (CPI) would be on a rising trajectory ‘given the strength of domestic demand, firming labour market conditions and continuing strong price pressures in the non-tradeables sector of the economy’ (RBA 2003b).
WAGE DETERMINATION IN2003
In this section we examine the coverage of different forms of wage determin-ation and the associated rates of money wage growth. The reldetermin-ationship between movements in real wages and productivity across industries is examined, along with the trend in earnings inequality for full-time employees. Brief reference is made to the controversial issue of executive compensation.
Coverage of agreements
There are a number of sources of Australian data on the incidence of different types of extant agreements. Researchers now have access to two issues of the Australian Bureau of Statistics (ABS) publication, Survey of Employee Earnings and Hours(2000 and 2002), which have data on the distribution of employees across different types of federal and state agreements and the associated rates of pay. In May 2000, 23.2 % of workers were covered by awards only, 36.7% by registered and unregistered collective agreements (representing 23.8% of private sector employees and 84.8% of public sector employees, respectively) and the remainder (40.1%) by registered and unregistered individual agreements. Only 1.8% of all employees had written and formally registered individual contracts. Also, the Government encouraged the making of collective, but non-union enterprise agreements, but at the end of 2001, the proportion of all workers covered by federal collective agreements who had non-union agreements was still only 9%.
the Workplace Relations Act, the average duration of agreements increased from 2 years to 30 months.
In both May 2000 and May 2002 there was a monotonically rising incidence of collective agreements as the number of employees in the enterprise increased and conversely for individual agreements.
Collective agreements were most prevalent in the public sector and the utilities, while individual agreements were most common in the wholesale trade, property and business services and construction. Workers in Accommodation, Cafes and Restaurants had a high incidence of award only, followed by Retail and Health and Community Services. Across occupations, Elementary Clerical, Sales and Service Workers had the highest incidence of awards, Professionals tended to be the recipients of collective agreements and Managers and Administrators had a high incidence of individual agreements (ABS 2003a).
The Department of Employment, Workplace Relations (DEWR 2003) collects data on registered federal agreements. At the end of September 2002, there were 14 450 federal wage agreements across all industries covering an estimated 1 537 700 employees, who represented approximately 16.5% of all employees, whereas there were 11 367 federal wage agreements current in September 2003, covering an estimated 1 498 100 employees (DEWR 2003). Thus, many agreements lapsed over this period and were not renewed.
Over 2003, the number of AWAs approved per month steadily rose from about 8000 at the end of 2002 to 11 536 in December 2003 (OEA 2004). A total of 102 474 AWAs were approved of 119 000 applications Australia-wide during 2002–2003. Take-up rates increased significantly in construction, whole-sale trade and education but there were small decreases in the energy industry, finance and communications. In WA, 45 000 AWAs were lodged in 2002–2003, representing a 300% increase on 2001–2002. In part, this reflected the decision to abolish WA workplace agreements (WAWAs), so mining personnel switched to AWAs.
Money wage growth
Since the advent of enterprise bargaining aggregate wage data have been very difficult to interpret. Many employees have unregistered agreements and wage increases may be granted in exchange for trade-offs with respect to other conditions and there are major compositional changes occurring in the workforce (Burgess 1995).
ACIRRT also documents the features of a sample of high wage agreements. A number entailed the absorption of allowances and overtime. Remuneration tended to be linked to Key Performance Indicators (KPIs), rather than individual performance appraisals, both in the form of lump-sum bonus payments and cross-classification wage increases. Both rostering flexibility and functional flexibility were rewarded, with the latter often associated with the introduction of new classification systems.
While the comparison of the ABS data for May 2000 and 2002 provides an indication of the changing incidence of wages paid under different institutional arrangements, a comparison of the corresponding wage levels is less insightful, because the computation of, say, the growth in the pay of award reliant employees will reflect both the general increase in award wages, as well as the compositional bias induced by the change in the wage fixing arrangements for some workers. In addition, the data include workers of all ages, who are working both part-time and full-time. Consequently, we do not report earnings growth from the ABS data over the 2 years under the different forms of wage fixing arrangement.
Full-time adult Average Weekly Earnings grew 6.0% in the 12 months to November 2003, as compared to 5.2% over the previous 12 months (AUSSTATS 2004). These figures conflate changes in hourly wages, full-time hours and compositional changes. Industries exhibited a wide diversity of outcomes in the year to November 2003, ranging from Health and Community Services (10.4%) and Accommodation, Cafes and Restaurants (-3.3%). The annual rates of wage growth across industries across the two successive years (i.e. to November 2002 and November 2003, respectively) exhibited a strong negative correlation (-0.24), which suggests that the timing of the wage agreements could strongly influence these aggregate industry figures, particularly when agreements tended to be in excess of 2 years.
On the other hand, the growth in Average Weekly Ordinary Time Earnings over the same period was 5.5%, following 4.8% in the year to November 2002 (AUSSTATS 2004). The industry rates of wage growth had a correlation of –0.28 with growth rates over the previous 12 months.
In the year to September 2003, wage growth, as measured by the fixed weight Wage Cost Index, grew 3.6% (ABS 2003b).3This was just within the Reserve Bank’s target band of 3.5–4.5%, and represented a small increase in the rate of growth compared to the year to September 2002 (3.3%). This year-to-year increase was composed of the growth of public sector wages (4.7%), and private sector growth (3.2%). Table 1 shows the annual percentage change in the wage cost indexes by industry. The fixed weights significantly reduce the wage variability.
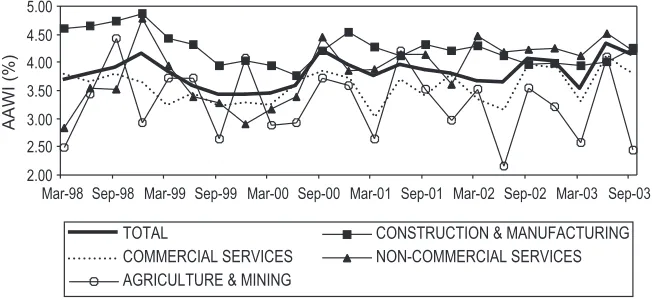
Figure 1 shows developments in wage bargaining. The figure shows quarterly AAWIs per employee across groups of industries for new agreements certified in the corresponding quarter across industry groups from March 1998 to September 2003, based on currently weighted DEWR data. These new wage agreements, while exhibiting considerable volatility provide some indication of contemporary developments in wages bargaining, although they only represented over 22% of extant agreements in September 2003.
Construction and manufacturing consistently yield the highest AAWIs. Commercial services have generally exhibited the third lowest AAWI, but this group comprises somewhat heterogeneous industries, ranging from Wholesale and Retail Trade to Finance and Insurance. Agriculture and Mining exhibit extreme volatility that probably reflects the relatively few agreements finalised in each quarter.
Thus, the evidence is mixed on wage outcomes in 2003, reflecting the difficulty of collecting meaningful data. The wage cost series, which is the easiest to interpret, reveals a small (0.2 percentage point) increase over the 12 months to September 2003 and just places wages growth within the critical band identified by the RBA.
Source:DEWR (2003, various issues), author’s calculations.
Notes: Construction and Manufacturingare equivalent to the Australia and New Zealand Standard Industrial Classification (ANZSIC) industries. Commercial services:Wholesale; Retail; Accommodation, Cafes and Restaurants; Transport; Communications; Electricity, Gas and Water; Finance and Insurance; Property and Business; Cultural and Recreation; and Personal and Other. Non-commercial services: Education and Health; Government Administration and Defence; and Community Services.
The estimates have been rounded since June 1999. Historical estimates have been revised, so the Figure may exhibit slight differences as compared to figure 1 in Watts (2003).
The AAWIs are calculated as a weighted sum of the AAWIs per employee per ANZSIC industry with the weights given by the corresponding employment shares.
Earnings inequality
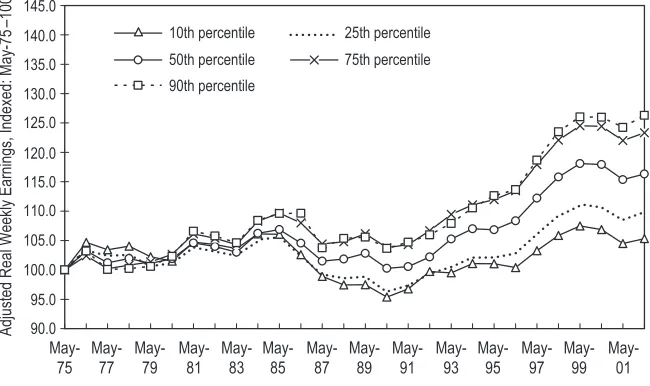
In an annual report of wage determination, the year-to-year documentation of changes in earnings inequality is of marginal use, given the lag in releasing the annual wage data and the limited additional insights conveyed by each year’s data. In its submission to the 2003 Safety Net Case, the Commonwealth documented Australian real total weekly earnings by percentile for the period May 1975 to May 2002 (Commonwealth of Australia 2003, p. 86). Taking May 1975 as 100, the highest percentiles exhibited the highest growth of real weekly earnings over the sample period with the 90th percentile registering an increase in excess of 25%, whereas median earnings had grown approximately 15% and the 10th percentile 4.9% (see Figure 2). Between 1996 and 1999, real earnings at each percentile grew rapidly but, at the same time, the proportional disparity between percentiles increased. Real earnings then fell across all percentiles until 2001, with the disparities between the percentiles staying largely unchanged. Inequality between the percentiles started to widen over the period 2001–2002. Overall, the gap between the 90th percentiles and the median grew 3.5% between May 1996 and May 2002, whereas the gap between the median and the 10th percentile rose 2.3%. The Commonwealth concluded that similar processes were occurring in the Australia labour market, as in ‘other advanced and dynamic economies such as the United States and the United Kingdom’. The Commonwealth made a virtue of the growing wage inequality by arguing
Figure 2 Australian real total weekly earnings, by percentile, for full-time adult non-managerial employees, 1975–2002.
that it enhanced the productivity and flexibility of the workforce by promoting incentive.
These economic benefits were alleged to have been gained without compro-mising the living standards of the low paid due to the presence of income support systems. Indeed, the Commonwealth was quite clear: ‘earnings have continued to increase in real terms across the distribution, showing that low paid workers are benefiting from economic growth’ (Commonwealth 2003, p. 85). Significant real earnings growth did occur over the period 1996–2002, whereas median earnings grew a rather modest 5% over the period 1983–1996 under the Labor Government. The significant real growth of earnings under the Coalition Government was accompanied by rising inequality, as measured by the percentile differentials. We explore this issue below in the context of the Safety Net Case.
In a recent paper, Keating (2003) analyses the change in earnings inequality amongst full-time adult employees between 1975 and 2000. He claims that it is the change in the occupational composition of employment, rather than changing wage relativities, that is the source of the rising inequality. He concludes that Australia must increase its rate of job creation, especially full-time job creation, to achieve a sustainable improvement in income inequality.
The living wage case
In November 2002 the Australian Council of Trade Unions (ACTU) filed its Living Wage Claim under the Workplace Relations Act (1996). The peak body requested a $24.60 per week increase in all award rates of pay with an equivalent increase in wage related allowances (AIRC 2003, para. 1).
The Workplace Relations Act(1996, Section 88A) is designed to ensure that: (a) wages and conditions of employment are protected by a system of
enforce-able awards established and maintained by the Commission; and
(b) awards act as a safety net of fair minimum wages and conditions of employment . . .
Under the Act (1996, Section 88B (2)b), the AIRC is required to have regard to ‘economic factors, including levels of productivity and inflation, and the desirability of attaining a high level of employment’ in setting appropriate minimum rates of pay, but also to take into account the need to provide fair minimum standards for employees in the context of general Australian living standards and the needs of the low paid. Sectoral outcomes must also be taken into account in determining the safety net adjustments (AIRC 2003, para. 174).
Minimum Wage. If the Commission were to award more than $12, the Commonwealth argued that the increase should be phased in over no less than 18 months (AIRC 2003, para. 13).
Most employer groups favoured no increase, pointing to an uncertain economic outlook particularly in light of the drought, the state of the world economy and international instability. No party or intervener suggested that the Commission should apply a percentage adjustment.
In this case there were no new substantive economic arguments presented. The major issues addressed in the submissions were the economic impact of the ACTU’s demand and the appropriateness of the wage system, rather than the tax-transfer system, in addressing the needs of the low paid. We address each of these issues briefly below.
Economic impact
Quoting both the Treasurer and the November 2002 RBA Statement on Monetary Policy, the ACTU argued that the Australian economy had performed strongly with continued positive economic growth, strong productivity growth in the market sector, employment growth and business investment, moderate wage growth, record high profits and a rate of inflation within the Reserve Bank target range (AIRC 2003, para. 19). Based on projections from Government agencies and the OECD (para. 26), the peak body claimed that the overall prospects for 2003/04 were good, despite the effects of the drought and weaker overseas demand.
The Commonwealth acknowledged the positive economic outlook, but argued that the ACTU had failed to recognise the downside risks which had emerged since the forecasts were devised, including the geo-political tensions, sharp rises in oil prices, weak and volatile equity markets, higher exchange rates and weakening employment growth (AIRC 2003, para. 32). Industry groups also pointed to uncertain economic prospects.
The AIRC also noted the strong performance of the Australian economy, and the positive economic outlook, notwithstanding the weakness of the rural sector due to the drought (AIRC 2003, para. 67). Also, the Commission could not discern any adverse impacts of the $18 Safety Net Decision of 2002. It was inappropriate to assume that the risks identified by business groups would necessarily materialise in the form of a worse case scenario (AIRC 2003, para. 93). Also, the Australian economy had revealed a capacity to resist external shocks, which had been noted by the OECD (AIRC 2003, para. 95). Finally, in line with Australian Council of Social Service, the Commission rejected the view that the low paid should carry the full burden of the economic uncertainty through wage restraint (AIRC 2003, para. 96).
The ACTU drew on work by Dowrick and Quiggin (2003) who denied that there was conclusive econometric evidence that rising wage inequality, from the failure to adjust minimum wages, led to faster employment growth. Likewise, evidence from the UK Low Pay Commission also failed to find major adverse effects on UK employment and hours arising from the introduction of the Minimum Wage, and it subsequent upratings (AIRC 2003, paras 153–58).
The AIRC concluded that increases in the wages of the low paid would only have modest impacts on employment and would be confined to specific groups (AIRC 2003, para. 161). The Commission was convinced that the limited impact of the ACTU’s claim on aggregate wages would, in turn, have a minimal impact on inflation (AIRC 2003, para. 179).
Drawing on UK and Australian evidence, the Commission dismissed the argument that enterprise bargaining promoted productivity growth, so that productivity growth would be lower in award reliant sectors subject to safety net increases (AIRC 2003, para. 180). A recent paper by Loundes, Tseng and Wooden (2003) acknowledges that the link between enterprise bargaining and faster productivity growth in Australia has yet to be established empirically, despite the resurgence in productivity growth in the 1990s.
In its deliberations, the Commission noted the uncertainty associated with the duration of the rural drought. In the context of relatively strong aggregate employment and hours growth, employment growth in the three most award reliant sectors, namely health and community services, accommodation, cafes and restaurants, and the retail industry, had significantly exceeded the total employment growth of 12.5% since May 1996 (AIRC 2003, para. 149). These three industries constituted around one-third of regional employment. Thus, any negative effects of a large wage increase would be amplified in drought-affected areas (AIRC 2003, para. 247). The UK Low Pay Commission also found that since the uprating of the minimum wage in October 2001, employment in low-paying sectors as a whole had been stronger than in the higher paying sectors (AIRC 2003, para. 158).
Wage adjustment and the social security system
Drawing on the NATSEM analysis of the Effective Marginal Tax Rate (EMTR), the ACTU challenged the claim that workers only received a little of a Safety Net adjustment due to a high EMTR (AIRC 2003, para. 207).
The Australian Industry Group repeated the Commonwealth arguments of 2002 that the determination of the Safety Net Adjustment (SNA) by the AIRC should take into account the interaction of the wages system and the income support system. In particular, wage increases for the low paid represented a low bang for the buck, due to the presence of wedges, so that wage earners would typically only receive between 20 and 60% of each dollar of a wage increase (AIRC 2003, para. 227). In addition, wage increases attracted additional oncosts.
225), so that safety net increases were an ‘imperfect and partial mechanism for addressing the needs of the low paid’ (para. 226). The AIRC did indicate that the variation of awards to provide wage increases was the only tool available to it to address the ‘needs of the low paid’ (AIRC 2003, para. 230).
In a previous review, Watts (2003 p. 192) noted that by arguing that SNAs were a limited means of achieving social equity, the Commonwealth appears to be trying to marginalise the Living Wage Case, thereby gaining greater discretion to determine the degree of economic inequality within the Australian economy, through manipulation of the tax-transfer system. Also, by limiting wage increases for the low paid, the Commonwealth was promoting static and dynamic inefficiency (Mitchell and Watts 2002, p. 97).
The Commonwealth asserted that the key cause of inequality was unemploy-ment and hence employunemploy-ment creation was needed to reduce income inequality in Australia rather than increasing the incomes of those in work (AIRC 2003, para. 217). Recent work, including Watts (2001) points to causality running from unemployment to wage inequality. The irony is that tight federal monetary and fiscal policies in the form of relatively high interest rates and budget surpluses have been a major cause of persistent unemployment in Australia (Mitchell 2001). A significant aggregate demand stimulus would be required to impact on wage differentials, given the significant levels of hidden unemployment and underemployment (Mitchell & Carlson 2001). Further, in the context of growing real wages, the Commonwealth supported an increase in the Federal Minimum Wage of $12 to maintain its real value, thereby sanctioning a widening of earnings inequality, given the overall growth of real wages. On the other hand, Dowrick and Quiggin advocated the indexation of minimum wages to the average or median wage, rather than the CPI to enable workers in low-pay occupations to share in the benefits of rising productivity (AIRC 2003, para. 151).
Decision
The Commission reaffirmed its view expressed in the 2002 decision that it should try to maintain a safety net of fair minimum wages for all award reliant employees (AIRC 2003, para. 248).
In its 7th Safety Net Adjustment since the Workplace Relations Act(1996), the Commission (2003, paras 241–253) granted a $17 per week increase in award rates up to and including $731.80 per week; and a $15 per week increase in award rates above $731.80 per week. Consistent with the decision, the federal minimum wage was increased by $17 to $448.40 per week (2003, para. 253). The extra increase for the low paid gave emphasis to their needs and slightly moderated the overall economic impact, as compared to a uniform adjustment of awards.
delay the next case until October 2004. In its decision the Commission reaffirmed the terms of the Economic Incapacity Principle.
In its submission to the 2004 Safety Net Case, the ACTU sought an increase in awards of $26.60 per week with a commensurate increase in wage-related allowances. If granted, the ACTU claim would take the Federal Minimum Wage to $475.00 per week or $12.50 per hour.
Real wage and productivity movements
Mitchell, Muysken and Watts (2002) provide a detailed examination of the relationship between real hourly earnings and labour productivity by industry (measured as gross value added per hour) for Australia for the period 1985 to 2001. Special attention was paid to assessing the extent to which labour produc-tivity growth was reflected in real hourly earnings and if the introduction of the
Workplace Relations Act (1996) (hereafter WRA) affected this relationship in Australia. They found that productivity movements were only partially being passed on in the form of lower prices and/or higher nominal wage outcomes, so that in many industries (13 of 16 Australia and New Zealand Standard Industrial Classification [ANZSIC], excluding the farm sector), businesses were using the
Table 2 Industry employment, real wage and productivity growth rates, Australia, 1990–2003
Sector 1990–2003 2000–2003
EMP Rhw Lph EMP Rhw Lph
Mining –0.69 1.43 2.80 4.33 0.00 –4.22 Manufacturing –0.53 1.31 2.04 –1.21 1.72 2.45 Electricity, Gas and Water –2.53 2.64 3.91 5.23 2.79 –4.21 Construction 2.02 0.53 1.37 3.10 2.51 4.13 Wholesale Trade –0.91 1.10 4.67 0.00 1.66 3.64 Retail Trade 2.14 0.75 2.17 3.46 1.22 2.14 Accommodation, Cafes
and Restaurants 3.02 0.92 0.59 0.76 –1.89 3.42 Transport 0.92 0.78 2.60 1.24 0.63 2.57 Communications 1.25 0.80 5.72 –0.19 –1.83 4.19 Finance and Insurance –0.33 2.10 3.59 1.54 2.71 2.11 Property and Business 4.85 1.35 –0.20 2.60 1.29 1.77 Government and Defence 1.54 1.47 1.44 7.80 1.24 –3.18 Education 1.99 0.71 –0.01 3.62 0.83 –2.19 Health and Community 2.65 1.18 1.42 3.09 2.05 2.43 Cultural and Recreation 3.52 0.39 –0.28 1.50 5.06 0.13 Personal and Other 2.46 0.52 0.26 3.05 –2.32 0.73 Total Non-farm 1.66 1.00 1.90 2.26 1.65 1.79
productivity gains to expand their margins. With more data now available we can better assess whether the WRA has allowed real wage movements to be more closely aligned to enterprise-level productivity growth.
Table 2 shows the annual average compound growth rates for employment (EMP), real hourly wages (RHW) and hourly productivity (LPH) by sector for 1990–2003 and 2000–2003. It is clear that the first period figures were heavily influenced by the significant recession in the early 1990s. Over the second period, employment growth was generally stronger with notable excep-tions (Manufacturing, Accommodation, Cafes and Restaurants, Communicaexcep-tions, Property and Business Services, and Cultural and Recreation Services). Real wage growth was stronger and productivity growth slower in the latter period, but again, there were exceptions. Real wages growth was negative in several of the growing service sectors (Accommodation, Cafes and Restaurants, Communications, Property and Business services, Personal and Other services).
To examine the relationship between real wages growth and sectoral produc-tivity growth we returned to the model in Mitchell et al.(2001) and estimated
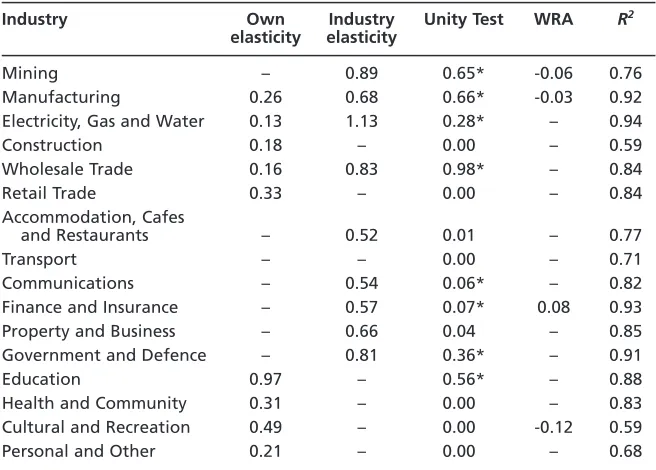
Table 3 Real wage-productivity regressions, Australia 1984–2003
Industry Own Industry Unity Test WRA R2
elasticity elasticity
Mining – 0.89 0.65* -0.06 0.76
Manufacturing 0.26 0.68 0.66* -0.03 0.92 Electricity, Gas and Water 0.13 1.13 0.28* – 0.94 Construction 0.18 – 0.00* – 0.59 Wholesale Trade 0.16 0.83 0.98* – 0.84 Retail Trade 0.33 – 0.00* – 0.84 Accommodation, Cafes
and Restaurants – 0.52 0.01* – 0.77
Transport – – 0.00* – 0.71
Communications – 0.54 0.06* – 0.82 Finance and Insurance – 0.57 0.07* 0.08 0.93 Property and Business – 0.66 0.04* – 0.85 Government and Defence – 0.81 0.36* – 0.91
Education 0.97 – 0.56* – 0.88
Health and Community 0.31 – 0.00* – 0.83 Cultural and Recreation 0.49 – 0.00* -0.12 0.59 Personal and Other 0.21 – 0.00* – 0.68
real hourly wages equations at the industry level in the following form (variables in logs):
(1) (w/p)it=a0+a1git+a2gt–1+βut+eit
where w/p are hourly real wages in industry i, giis the corresponding output
per hour worked in industry i, g is all-industry output per hour worked, and uis aggregate unemployment. Seasonally adjusted data was used.
This model allows us to discriminate between the influence of sectoral productivity on real hourly wages by industry relative to the impact of economy-wide productivity movements. The model was supplemented with a dummy variable designed to test for the impact of the WRA 1996 (various threshold effects were examined with the results reported using 0 prior to 1996 : 3 and 1 thereafter). The own elasticities reported in Table 3 refer to a1and the Industry elasticities refer to a2. Only elasticities which are significant at the 5% level are reported. Maximum likelihood estimation corrected for serial correlation was used and the equations were subjected to the usual diagnostic tests and were generally satisfactory.
The results show that for some industries, real hourly wages were driven by economy-wide productivity trends, while for others, it was predominantly own-industry productivity that mattered. Only workers in the Education sector gain full compensation for their industry specific productivity increases. In eight of the 17 industries (Mining, Manufacturing, Electricity, Gas and Water Supply, Wholesale Trade, Property and Business Services, Government and Defence, Education, and Cultural and Recreational Services) the restriction that the sum of these statistically significant elasticities is unity was accepted. Workers in these industries were able to share in labour productivity growth within their own industry and/or the overall economy. In Mining, Communications, Finance and Insurance, Property and Business and Government and Defence, economy-wide productivity growth was the sole source of the real wage growth. More industries now satisfy the unity restriction than was found in the earlier study by Mitchell et al.(2001). The other major difference is that the unemployment rate was less significant in the extended sample when compared to the results of Mitchell et al.(2001). Clearly, continued improve-ment in the economy has allowed real wages to grow more in line with labour productivity.
growth. Over the period 2000–2003 this occurred in Manufacturing, Wholesale, Communications, Finance and Insurance, whereas in the remaining industries, satisfying the unity test, margins were cut.
The WRA has a significant negative effect for Mining, Manufacturing and Cultural and Recreational Services, whereas real hourly wages were higher for Finance and Insurance in this period (other things equal). The results reflect the findings of Carlson et al.(2001) who argued that the key share changes occurred in the 1980s rather than in the 1990s.
Executive pay
Following a number of corporate scandals in 2002, there was an increased public focus on the pay of Australian executives in 2003. In particular, there was a heightened sense of shareholder activism, as well as academic interest with a symposium in the Australian Economic Review. In a poll of retail investors (holding between 5000 and 10 000 shares in Australian companies), 77% considered that companies failed to properly disclose their executive payments and show how it was linked to performance (Australian Financial Review2003b). Even key corporate players were talking about it. Former BHP Billiton CEO Paul Anderson told the 2002 Business Council Annual General Meeting that executive compensation was out of control after the bidding frenzy of the 1990s. He particularly noted that share options are being overused because boards ‘considered them to be free’ (Anderson 2002, p. 4). He also considered the common practice of ‘annual compensation reviews’ to be a rubber stamp for executive pay inflation.
Trade unions also wanted answers. Shields et al. (2003, p. iii) in a report commissioned by the Labour Council of NSW, sought to determine whether Australian executives delivered ‘value for the ever increasing investment from shareholders’. Relying heavily on the Australian Financial Review’s annual survey of executive pay in the top 150 Australian companies, they concluded that ‘existing executive remuneration practices are defensible neither in terms of distributive justice nor organisational effectiveness’.
Their major findings included that executive pay was 22 times AWE in 1992 and by 2002 it was 74 times. Further, executive option packages (typically relating to privileges concerning company shares) comprised 35.2% of total remuneration in 1998 rising from 6.3% in 1987. Despite this growth in executive pay, Shields et al.(2003, iii) found that the ‘often-stated link between high executive pay and company performance does not exist’ and that as executive pay increases, ‘the performance of the company deteriorates’. O’Neill and Iob (1999) also report an inverse relationship between senior executive pay and Australian company performance with organisations making new (expensive) appointments in response to poor performance.
being paid ‘scandalous salaries while customer service was being downgraded’ (quoted in Turnbull 2004).
The policy agenda would suggest that controls on executive pay and incentives to be more accountable to shareholders, customers and the public are needed. Some commentators have suggested that government discriminate in their spending against companies with excessive executive pay and that the regulatory functions currently performed by the Australian Stock Exchange (a private company) are vested, instead, in a public watchdog. More directly, share options used to supplement executive pay should be controlled with caps and minimum vesting periods. Increased accountability and disclosure rules would be enhanced if formal shareholder assent was required for all executive pay agreements (Shields et al.2003, iii).
The federal government reacting to earlier collapses (for example, HIH) which involved apparent executive pay excesses has proposed legislation where share-holders would be able to ‘vet multimillion dollar executive salaries and companies would face $100 000 fines for inadequate disclosure’ (Maiden et al2003). Critics of the proposed changes to law argue that shareholders should have the power of veto over the ‘overly generous’ retirement packages for executives and that the fines for misleading the market should be stiffer. Our legislative proposals would be more lenient than those recently enacted in the USA in the Enron aftermath.
Clearly, more debate will be forthcoming in the year ahead on this issue.
INDUSTRIAL RELATIONS AND LABOUR MARKET REFORM
During 2003, the ACTU mounted a number of test cases before the Commission. The federal government initiated legislative reforms which were designed to impact on the wages and conditions of workers. The Government was keen to reinforce the decentralisation of industrial relations, by diluting unions’ power, through outlawing pattern bargaining, and union bargaining fees, and scrapping unfair dismissal laws for small business, but, in a number of instances, was frustrated in the Senate.
Bargaining fees
In mid-2002, the full bench of the Federal Court overturned an earlier decision in the Electrolux case, and ruled that unions and their members could take protected strike action in the pursuit of enterprise agreements that included clauses outside the traditional employment relationship, such as a bargaining fee (Watts 2003, p. 196). The High Court will make a decision in 2004 on the appeal against the Electrolux decision.
included clauses outside the employment relationship, such as bargaining fees or payroll deductions for union dues. An enterprise bargaining agreement could be unanimously supported by all employees, the employer and the union but the AIRC could refuse to approve it (Balogh 2003a). The issue remained legally untested, however, because the ruling related specifically to one clause in one enterprise agreement (Adam 2003). In March, the AIRC struck out 160 agree-ments containing bargaining fee clauses (Priest 2003b).
Compulsory bargaining fees are said to offend against the law of contract that underpins the WRA. This requires offer and acceptance as well as consideration and certainty to be binding. On the other hand, unions argue that fairness and equity dictates that these fees prevent non-union members freeloading on the efforts of unions to provide improved pay and conditions without contributing to their cost. By setting a fee of $500 which exceeds the annual membership to the union, however, the union could be accused of trying to impose a closed shop. The Australian Financial Review(2003a) was quite clear ‘In no other commercial environment can a non-state party foist its services on a person and demand payment’. Also, unions would never let an employer pay a non-union member a lower rate because it would undercut their members. Indeed, under the Government’s own workplace laws, union-negotiated enterprise agreements benefit all employees in the workplace, not just union members. Unions support this approach because it prevents discrimination (Burrow 2003). Thus the union rate provides a floor to the non-union member.
The Australian Financial Reviewargues that the rights of non-union workers who might secure a better deal for above-average skills by direct negotiation must be respected. If a significant minority in the workplace choose not to be union members, then is the employer going to undertake a genuine negotiation with each of them? As noted above, the number of registered individual agreements remains very low. ABS data indicates that union members are better off with respect to weekly pay, annual leave entitlements, access to sick leave, long service leave and paid maternity leave (ABS 2003a).
Government amendments to the WRA to outlaw union bargaining fees had been blocked earlier in the Senate by Labor and the minor parties, but in March 2003, the Democrats capitulated and supported Abbott’s bill to ban them.
Pattern bargaining
An anti-pattern-bargaining provision was inserted into the WRA late in 2003 which forced Australian unions to negotiate directly with individual employers. A uniform wage increase was viewed as symptomatic of the ‘one size fits all’ principle which was outdated. The National Secretary of the Australian Workers Union, Bill Shorten, noted that all workers were entitled to a wage increase of at least 4%, arising from inflation of 2 to 3% and productivity growth of 2%, yet a demand for such an increase would be construed as pattern bargaining (Priest 2003a).
economics, to which the Coalition could be said to adhere, would interpret that wage inequality amongst workers essentially undertaking the same tasks was a manifestation of allocative inefficiency, with the employers of the lower paid workers receiving a subsidy. Further one strand of the efficiency wage hypothesis is premised on a link between wages and productivity.
The issue of pattern bargaining has a dynamic dimension too. By outlawing this practice the Commonwealth was trying to quarantine individual enterprise wage agreements, thereby minimising the flow-on of wage increases through the network of industrial awards by the tribunals which had characterised previous wage explosions (Watts 2003, p. 195). The orderly flow-on of a modest wage increase will not promote an acceleration of inflation, but in an environment of unsynchronised, unequal wage outcomes, there is the prospect of catch up and leapfrogging, which was characteristic of the periods of wage explosion.
The debate about pattern bargaining was reignited by the Cole Royal Commission which found that pattern agreements in the building industry accounted for 89% of all agreements from 1 January 2000, to 31 December 2001. The agreements had common expiry dates which enabled the unions to run industry-wide campaigns. The rapid establishment of a 36-hour week in the building industry during 2002 and 2003 indicated the presence of pattern bargaining (Priest 2003a). Priest (20003a) notes that in an industry with an elaborate web of contracting between small operators and sub-contractors, ‘the fragmentation of conditions through genuine bargaining offers the prospect of a brave new order or simply chaos’. The legislation flowing from the Royal Commission appears unlikely to be passed by the Senate, with the Democrats wanting it to include a crackdown on political donations (Skulley 2003b).
Redundancy provisions
In May, a full bench of the AIRC commenced hearing an application to extend redundancy pay obligations to small businesses of less than 15 staff and to end the exemptions that apply under federal and most state awards which deny payouts to long-term casuals. In addition, the claim sought to increase severance pay for each employee from a maximum of 8 weeks’ pay per employee to a maximum of 20 weeks and include additional penalty and overtime payments in redundancy payouts. Also employers would be required to pay redundant employees a $300 allowance for employment and financial advice (Jackson 2003).
Late in the year a court decision gave Ansett employees a further 42c in the dollar in outstanding entitlements. Following a 2-year legal case after Ansett’s collapse in 2001, the former employees received a total of 71c in the dollar (AAP 2003). A $10 airline ticket levy had funded $300 million of the funding, which generated the community standard of 8 weeks redundancy pay for the nearly 13 000 former employees (Australian Broadcasting Corporation [ABC] 2003).
Australian Workplace Agreements
employees and involving workers in decision making, most AWAs gave manage-ment the flexibility to change employees’ working hours and pay rates in a bid to cut costs (Skulley 2003a). The report found that AWAs were more common in small-to-medium sized employers and often allowed employers to unilaterally change working hours and add duties. In March, only 1.9% of the Australian workforce was covered by AWAs, but this is rising.
The federal government was forced to drop its plan to force universities to offer AWAs to staff in exchange for $404 million in extra funding, which was part of the Higher Education Billthat passed in December with the support of the independent senators.
Disability remuneration
At a separate hearing of the Full Bench, the AIRC agreed to increase the sup-ported wage for disabled workers from $56 to $60 per week. This wage system allows disabled workers to work in open employment and be paid an amount consistent with their assessed productive capacity. Workers will be able to earn $60 per week without a reduction in their Disability Support Pension. The federal government introduced the Disability Reform Bill, however, which stated that anyone with a disability who was capable of working more than 15 hours would no longer be entitled to disability benefits. The current threshold is 30 hours. The Bill is a trigger for a double dissolution after its rejection in the Senate (O’loughlin 2003b).
Casual employment
Casual workers do not have access to entitlements received by permanent staff, which include paid sick leave and paid annual leave. About 60% of part-time employees are casuals and casuals have a lower rate of unionisation than permanent staff. Also, casual employees are not deemed to have appropriate job security and income to qualify for a home or car loan. The percentage of workers in casual employment rose from 13% in 1982 to over 27% in 2002.
Pocock et al.(2004) claim that an inadequate regulatory system has facilitated this growth in casual employment, because ‘permanent casuals’ can be employed with few rights and benefits as substitutes for workers with standard rights and benefits. Almost 50% of casual workers stayed in the same job for more than 12 months, but had no access to sick leave or holidays (Robinson 2003). Pocock et al(2004) argue that casual employment should be limited to proper casual work which is short term and unpredictable.
In November the Democrats decided to support amendments to the Workplace Relations Amendment (Fair Dismissal) Bill 2002, which excluded casual employees from access to unfair dismissal laws for the first 12 months of employment (Louw 2003). Employers would not be allowed to rort the 12-month qualifying period, however, by dismissing staff, only to re-employ them again later (O’loughlin 2003a). The Democrats had previously supported a proposal by the Australian Labor Party to allow casual workers the same rights as permanent employees after 6 months of employment. This legislation followed a ruling by the AIRC in September that casual employees could claim for unfair dismissal under federal awards, when they had been employed for less than 1 year.
Work and family
The federal government failed to introduce paid maternity leave in the May budget. Australia and the USA remain the only OECD countries that do not offer a universal system of paid maternity leave. A Senate Bill was introduced which would provide 14-weeks paid maternity leave at a minimum wage level, along the same lines as the model proposed by Ms Goward in late 2002 (see Watts 2003). Goward had found that more than 60% of Australian women did not have access to paid maternity leave (Milburn 2003).
Under the WRA, permanent full-time and part-time employees who have 12 months of continuous service with their employers have a minimum entitle-ment to 52 weeks of unpaid parental leave following the birth or adoption of a child. While 59% of public sector workplaces offer maternity leave, only 23% of private sector workplaces do so, with most being large companies with more than 1000 employees. 0.7% of AWAs provide paid maternity leave for either 9 or 12 weeks. Up to 65% of managers and 54% of professional women have access to paid maternity leave compared with 18% of clerical, sales and service workers and 0.4% of casual workers. The average duration for paid maternity leave for federal agreements is 6 weeks, and for private sector employees between 6 and 12 weeks.
One problem with the ACTU proposal was that while the mother had certain entitlements, she had to exercise her rights through negotiation with the employer in a potentially unequal bargaining environment (O’Connor 2003). The AIRC Full Bench will make a decision on the test case in 2004.
The Australian Chamber of Commerce and Industry detailed its own plan for more family-friendly workplaces, including a proposal to allow employees to trade leave loading and penalty rates for extra holidays and have greater access to unpaid leave.
Unfair dismissal laws
The Workplace Relations Fair Dismissal Bill, which exempts small businesses from the unfair dismissal provisions, except in relation to apprentices and trainees, was rejected in the Senate. The Bill is a trigger for a double dissolution in 2004.
The federal government planned to utilise its corporation powers under the Termination of Employment Billto assume responsibility for state unfair dismissal cases where workers were employed by corporations. The Commonwealth was already responsible for 50% of claims, and this would increase their workload by another 35%. NSW and Queensland planned to mount a constitutional challenge. The Democrats signified support overall for the legislation but opposed any provisions that discriminated against small business employees (Balogh 2003b). This Bill is a potential trigger for a double dissolution (O’loughlin 2003b).
CONCLUSION
The last 12 months saw no evidence of a strong federal reform agenda in the run up to the next election. The shift of Abbot away from the Workplace Relations portfolio signified a less aggressive approach to industrial relations, and a priority on resolving Medicare and other issues, including the reform of Universities. The federal government took a legalistic perspective to reform by trying to fix up loopholes in the WRA by making it harder to take industrial action, limiting collective bargaining and union’s role and powers within the process and pro-moting individual contracts (Skulley 2003b). Some of their efforts were frustrated by political and legal processes and through decisions by the AIRC. The annual submissions to the Safety Net cases by the Commonwealth revealed their desire to marginalise the Commission’s influence on wage setting. The award system is not seen as a vehicle for countering growing earnings inequality, but merely maintaining the real pre-tax wages of the lowest paid.
While the ALP supports enterprise bargaining but with an improved set of minimum conditions, it wants to abolish individual AWAs and introduce ‘good faith’ bargaining, which would restore a wider role for the Australian Industrial Relations Commission.
‘fair dealing’ besides trust and confidence and ‘reasonable equality’ between the parties, plus access to relevant information when there is a decision that is ‘likely to have an adverse effect on employees’ (James 2003).
The ACTU is looking to halt the decline in union membership by broadening its appeal by exploiting the concerns of casual and part-time work-force, lifting minimum pay and conditions for the low-paid and winning ‘work and family’ improvements such as paid maternity leave (Skulley 2003b).
The absence of legislative developments in 2003 would suggest that, despite the rhetoric, the Government did not see itself as under pressure to develop initiatives. With a federal election due in the next 12 months, however, and Mark Latham doing well in the polls at the time of writing, the federal govern-ment may well be vulnerable on the softer industrial relations issues, which profoundly influence employees’ work and family lives, including working hours, parental leave and child care.
ENDNOTES
1. Had the participation rate remained at 64.1%, the unemployment rate would have been 6.06% in December 2003, compared to 6.1% in December 2002. The inclusion of underemployment and hidden unemployment would approximately double the official unemployment rate (see Mitchell & Carlson 2001).
2. The debt servicing ratio is defined as the household interest paid as a percentage of household disposable income.
3. The wage cost index measures hourly wages net of bonuses and, in contrast to measures of average weekly ordinary time earnings (AWOTE), is independent of compositional changes, because it is based on a fixed basket of jobs, which, however, includes part-time jobs.
REFERENCES
Anderson PM (2002) Corporate Governance Only Part of the Problem / Only Part of the Solution.
Presentation to Business Council of Australia’s Annual General Meeting, 22 October. Australian Associated Press (2003) Anderson welcomes court decision on Ansett entitlements.
General News, 26 November.
Australian Broadcasting Corporation (2003) Audit office backs Ansett Entitlements Process. (ABC) News, 22 December.
Australian Centre for Industrial Relations Research and Training (2003) Agreements Database and Monitor (ADAM) Report, quarterly issues.
Adam B (2003) Fed-Union push for bargaining fees to continue. Australian Associated Press General News,17 January.
Australian Bureau of Statistics (2001) Survey of Employee Earnings and Hours, 2000, Cat no. 6306.0 May. Canberra: ABS.
Australian Bureau of Statistics (2003a) Survey of Employee Earnings and Hours, 2002 Cat no. 6306.0 May, Canberra: ABS.
Australian Bureau of Statistics (2003b) Wage Cost Index, Australia, Cat no. 6345.0 September, Canberra: ABS.
Australian Centre for Industrial Relations Research and Training (ACIRRT) (2003a) Agreements Database and Monitor (ADAM) Report, March.Sydney: ACIRRT.
Australian Centre for Industrial Relations Research and Training (ACIRRT) (2003b) Agreements Database and Monitor (ADAM) Report, June.Sydney: ACIRRT.
Australian Centre for Industrial Relations Research and Training (ACIRRT) (2003a) Agreements Database and Monitor (ADAM) Report, September.Sydney: ACIRRT.
Australian Financial Review (2003a) The Perils of Wage Setting.22 January, p. 46. Australian Financial Review (2003b) Executive Pay Riles Investors.7 December.
AUSSTATS (2004) 6302.0 Average Weekly Earnings, Tables 10g and 10h.
Balogh S (2003a) High Court may rule on union fees. The Australian, 22 January, p. 3. Balogh S (2003b) Abbott faces challenge on sacking laws. The Australian,15 May, p. 4. Burgess (1995) Economic and Labour Relations Review.6 (2), 216–33.
Burrow S (2003) Rewards of bargaining have a price. The Australian,22 January, p. 11.
Carlson E, Mitchell WF, Watts MJ (2001) The impact of new forms of wage setting on wage outcomes in Australia. Ten Years of Enterprise BargainingConference, May, Newcastle, Australia. Commonwealth of Australia (2003) Safety Net Review – Wages 2002–2003: Commonwealth
Submission, 26 February.
Department of Employment, Workplace Relations (2003) Trends in Enterprise Bargaining, September.
Dowrick S, Quiggin JA (2003) Survey of the Literature on Minimum Wages, Exhibit ACTU 3, Tag 8 February.
Jackson P (2003) Threat to business. Sunday Territorian,24 July, pp. 1–4.
James C (2003) ‘Good faith’ at the heart of employment reform bill. New Zealand Herald,
5 December.
Keating M (2003) The Labour Market and Inequality. Australian Economic Review, 36 (4), 374–96. Loundes J, Tseng Y, Wooden M. (2003) Enterprise bargaining and productivity in Australia. What
do we know? Economic Record, 79 (245), 245–58.
Louw C (2003) Casual dismissal bill likely to pass. Australian CPA (ABIX abstracts), p. 41. Maiden M, Costa G, Gordon J (2003) Plan to vet executive pay deals. The Age, 9 October. Milburn C (2003) Insight – Left holding the baby. The Age, 17 May, p. 7.
Mitchell WF (2001) The job guarantee and inflation control. Economic and Labour Relations Review
12, 10–25.
Mitchell WF, Carlson E (2001) Labour underutilisation in Australia and the USA. In: Mitchell WF, Carlson E, eds, Unemployment: The tip of the iceberg, pp. 219–232. Sydney: CAER. Mitchell WF, Muysken J, Watts MJ (2002) Wage and productivity relationships in Australia and the
Netherlands,AIRAANZ Conference, February, Queenstown, New Zealand.
Mitchell WF, Watts MJ (2002) Restoring full employment – The Job Guarantee. In: Carlson E, Mitchell W, eds. The Urgency of Full Employment, Sydney: UNSW Press.
Norington B, Nixon, S (2003) ACTU pushes job security for casuals. The Sydney Morning Herald,
20 August, p. 8.
O’Connor, A (2003) Bid to give new fathers unpaid leave. The Age, 25 June, p. 6.
O’loughlin T (2003a) Casual employees law. Australian Financial Review, 28 November, p. 14. O’loughlin T. (2003b) Senate stalls on the tough billsAustralian Financial Review, 8 December,
p. 4.
Office of the Employment Advocate (2004) AWA Statistics: Who is making AWAs? http://www.oea.gov.au/graphics.asp?showdoc=/home/statistics.asp&SubMenu=2
O’Neill G L, Iob M (1999) Determinants of executive remuneration in Australian organisations: An exploratory study. Asia Pacific Journal of Human Resources, 37(1),
65–75.
Pocock B, Buchanan J, Campbell I (2004) ‘New’ Industrial Relations: Meeting the challenge of casual work in Australia. New Economies: New Industrial Relations: Proceedings of the 18thAIRAANZ
Conference, Volume 2: Unrefereed Abstracts and Papers.
Priest M (2003a) Employers see red in patterns. Australian Financial Review, 23 January, p. 4. Priest M (2003b) Union bargain fees struck out. Australian Financial Review, 10 March, p. 7. Reserve Bank of Australia (2003a) Statement of monetary policy, Reserve Bank of Australia Bulletin,
November.
Reserve Bank of Australia (2003b) Statement by the Governor, Mr Ian Macfarlane Monetary Policy, RBA, 3 December.
Robinson P (2003) Wanted: More job security. The Age,9 August, p. 5.
Skulley M (2003a) Report slams workplace agreements. Australian Financial Review, 25 March, p. 6.
Skulley M (2003b) Reform, but slowly does it, Australian Financial Review, 14 November, p. 80. Sunday Tasmanian (2003) ACTU push for unpaid leave. 29 June, p. 12.
Turnbull J (2004) Executive pay ‘scandalous’, The Australian, 23 January.
Watts MJ (2001) Wage polarisation and unemployment in Australia. In: Carlson E, Mitchell WF, eds, Unemployment: The Tip of the Icebergpp. 171–92. Sydney: CAER-UNSW Press. Watts MJ (2003) Wages and Wage Determination in 2002. Journal of Industrial Relations, 45(2),
184–204.
Way N (2003) Cost or Opportunity? Business Review Weekly.17 July, p. 52
APPENDIXI
Data sources
Employment and Total Hours Worked by industry came from the ABS, The Labour Force, Australia, Cat. No.6203.0.
Gross value added data for 16 non-farm ANZSIC industries came from the ABS, National Accounts, Cat. No.5204.0. The value added series are chain indexes. Sectoral price indices were not available so wages were deflated by the non-farm implicit price deflator.
Average hourly wages by industry were computed from the ABS, Average Weekly Earnings, 6302.0.
Industry mnemonics Mining (ANZSIC B) Manufacturing (ANZSIC C)
Electricity, gas & water (ANZSIC D) Construction (ANZSIC E)
Wholesale Trade (ANZSIC F) Retail Trade (ANZSIC G)
Accommodation, Cafes, Restaurants (ANZSIC H) Transport and Storage (ANZSIC I)
Communications (ANZSIC J) Finance & insurance (ANZSIC K) Property & business services (ANZSIC L)
Government Administration and Defence (ANZSIC M) Education (ANZSIC N)