The influence of organizational image on college selection: what students seek in institutions of higher education
Andrea M. Pampaloni∗
Communication Department, La Salle University, PA, USA
Colleges and universities rely on their image to attract new members. This study focuses on the decision-making process of students preparing to apply to college. High school students were surveyed at college open houses to identify the factors most influential to their college application decision-making. A multi-methods analysis found that institutional characteristics were more influential than interpersonal or informational resources used by students. More specific results revealed that size, housing, and knowing someone who attended a school predicted students’ views of the school’s atmosphere. Key findings are discussed and recommendations offered to address issues related to organizational image.
Keywords:organizational image; decision-making; higher education
Introduction
For many students the decision to attend a college immediately after high school is foregone, having been decided years before any application is due. Other stu-dents might decide to pursue higher education in response to the realization that the life they have thus enjoyed is about to change drastically. For most, however, it is a stressful process (Whitehead, Raffan, & Deaney, 2006) that generally begins in conjunction with the start of high school, with a much more dedicated effort undertaken as the junior year approaches (Hossler, Schmit, & Vesper, 1999). Regardless of the incentive, the commitment to pursue continued edu-cation is often the first major, life-changing decision an individual will make. As such it warrants attention for two reasons. First, external influences are almost certain to be solicited to seek recommendations for guidance and direc-tion. A better understanding of whom and what these influences are and how they contribute to the final decision may offer valuable insights into the decision-making process and help to identify possible outcomes. Second, considering the desired long-term outcome related to this decision, presumably a job upon graduation, it makes sense from an organizational perspective to recognize the factors that influence the decision-making process at this early stage. Gaining a better understanding of the influences on and outcomes of the
ISSN 0884-1241 print/ISSN 1540-7144 online
#2010 Taylor & Francis DOI: 10.1080/08841241003788037 http://www.informaworld.com ∗
E-mail: [email protected]
decision-making process of this population allows organizations to adapt their recruitment messages to target desired potential new employees who provide the best ‘fit’ within that organization. This study looks at how organizational image and the factors that contribute to it influence the decision-making process of new, first-year college students.
To begin, a definition and overview of organizational image is provided. Next, influences on decision-making specifically within the context of higher education, are reviewed. This is discussed at two levels: first looking at the influences affect-ing potential students when selectaffect-ing a college, and next consideraffect-ing the organiz-ational influences that colleges employ to influence prospective members. The results of a survey of high school students conducted to identify characteristics influential to their decision-making are reported, and key findings are discussed, including recommendations for institutions of higher education to address the criteria identified by potential students as influential to their decision-making. Within this text the termscollegesanduniversitiesare used interchangeably.
Organizational image
Although image has been defined as the perception of an organization held by both internal and external publics (Margulies, 1977; Scott & Jehn, 2003), or the views that organizational members believe outsiders hold of the organization (Dutton & Dukerich, 1991; Dutton et al., 1994), for the purposes of this discus-sion organizational image is considered to be the views and perceptions of an organization held by non-members exclusively (Berg, 1986; Hatch & Schultz, 2002). Image is created by an organization to persuade outsiders that the organization represents specific and desirable characteristics. It can be con-veyed interpersonally, through direct or indirect contact with an organization or its members, or more indirectly based on the mission statement and stated goals of the organization (Gray, 1991). The perceptions non-members have of an organization directly influences future contact with that organization.
unsafe. This may hold true even after it is determined that the fight occurred across the street from campus, the people involved were not enrolled at the school, and University X has the safest campus in the city. This supports Wan and Schell’s (2007) view that image congruency – the reflection of the public’s desires and expectations – strongly influences how people view organizations.
For institutions of higher education, image is important because it helps create a positive view of the organization, which determines if potential members are attracted enough to want to become affiliated. The influence of image can be seen in the decision-making process of potential members; that is, first time students, which is discussed next.
Factors influencing students’ decision-making
Deciding to attend college is often monumental to a young person. It is com-pounded by the fact that a defined time frame mandates the process and that the outcomes can be potentially significant. Additional life-changing consider-ations include the possibility of moving to a new location, developing new relationships, accruing debt, and deciding on a course of action that might significantly affect future life and career plans.
Galotti’s (1995) longitudinal study on the decision-making process of college-bound high school students provides insights on the number and type of criteria used and the alternatives available to students as they make decisions about what colleges to pursue. The findings indicate that the types of criteria used to evaluate schools were only marginally different between students with higher or average aca-demic ability versus those with lower ability. Conversely, differences were reported in the types of criteria reported, based on academic ability and gender. Galotti’s find-ings indicate that students’ academic ability influences both the number and types of decision criteria they consider when making decisions about college.
Other studies looking at factors that influence decision-making in adolescents focus on different demographic characteristics of students such as race (Freeman, 1999), geographic origin (Kelpe Kern, 2000; Lapan, Tucker, Kim, & Kosciulek, 2003; Powell & Luzzo, 1998), and financial issues (Bergerson, 2009; DesJardins, Ahlburg, & McCall, 2006; Perna & Titus, 2004). Related studies consider attributes that might influence students’ decisions to pursue higher education. For example, high school students with high levels of career maturity, including competencies in decision-making skills, are more committed to making career choices (Powell & Luzzo, 1998). This could include the decision to attend college. Across studies, several factors emerged as being consistently influential. These can be categorized as interpersonal influences and informational influences.
Interpersonal influences
higher education or careers. Of the individuals from whom high school students sought guidance and information, parents are overwhelmingly identified as the single strongest influence during the school selection process (Bergerson, 2009; Cabrera & LaNasa, 2000; Helwig, 2004; Hossler et al., 1999; Ketterson & Bluestein, 1997; Moogan, Baron, & Harris, 1999; Otto, 2000; Paulsen, 1990; Rowan-Kenyon, Bell, & Perna, 2008; Sachs, 2002; Scott & Daniel, 2001). Parental involvement has many components. It can be classified loosely as unstructured support such as encouragement, motivation, and providing a sense of expectations, and as practical support such as assisting with preparation of forms, or offering to pay for, or, more notably, actually saving to pay for college (Cabrera & LaNasa, 2000; Hossler et al., 1999). An interesting contra-diction to this finding is that as students come closer to finalizing their decision-making plans, typically in the second half of their final year of high school, the influence of counselors and teachers increases, sometimes becoming even more prominent than that of parents (Helwig, 2004; Hossler et al., 1999). Friends and other family members are also influential in the college decision-making process, though to a notably lesser extent than parents (Hossler et al., 1999).
Given their role in the college application process, it is not surprising that school counselors influence students’ decision-making. However, throughout the literature, counselors are portrayed simultaneously as being influential and needing to be more influential in the process (Baker, 2002; Helwig, 2004; Johnson, 2000; Kelpe Kern, 2000; Ketterson & Bluestein, 1997; Mitchell, 1975). One area identified as a way in which counselors can be more proactive is through career planning (Baker, 2002; Lane, 2000; Lapan et al., 2003). Career planning has been found to help students develop skills, including self-acceptance, awareness and understanding of work-related concepts, decision-making, and self-development skills (Mitchell, 1975).
Informational resources
tool used by schools to depict both the lifestyle students who attend the school can expect as well as their institution’s values (Anctil, 2008).
The preferred medium of students seeking information about colleges is the Internet (Adams & Eveland, 2007; Anctil, 2008; Ramasubramanian, Gyure, & Mursi, 2002). Students entering college today are among the highest users of computers and online technologies (Day, Janus, & Davis, 2005). Twenty percent of college students began using computers between the ages of five and eight; by the time they were 16 to 18 years old all of today’s current college students had begun using computers (Jones, 2002). Further, a 2009 report by Pew Internet Project found that 93% of teens between the ages of 12 – 17 use the Internet regularly. The Internet continues to grow as a resource for students for seeking information about colleges (Horrigan & Raine, 2006; Mentz & Whiteside, 2003), with 57% of online teenagers saying that they have gone online to get information about a college, university, or other school they are thinking about attending (Lenhart, Madden, & Hitlin, 2005).
Since current students have had Internet access for their entire lives, it is not surprising that it is their primary resource for researching colleges and univer-sities (Mentz & Whiteside, 2004). Multiple studies have looked at the increas-ing importance of Web sites to students seekincreas-ing information about college (Gordona & Berhow, 2009; Kang & Norton, 2006; McAllister-Spooner, 2008; Poock & Lefond, 2001; Ramasubramanian, Gyure, & Mursi, 2002). While schools recognize the importance of maintaining an updated, well-orga-nized, and content-appropriate site, there are areas in which they can improve the information they are providing and how they present it to better meet the expectations of their technologically savvy audiences (Hegeman, Davies, & Banning, 2007; Kang & Norton, 2006; McAllister & Taylor, 2007). This takes on added importance because students are influenced by the reputation and word-of-mouth recommendations of others when making decisions about which school to pursue (Anctil, 2008; Sung & Yang, 2008), thus colleges and universities must be attentive to the image they portray through their organ-ization’s site.
Several other factors emerge as influential when selecting a college. While certainly not an exhaustive list, five criteria beyond the interpersonal influences already noted are identified repeatedly. They are majors/programs offered, reputation, financial issues – specifically costs and availability of aid, extracur-ricular/sporting opportunities, and campus attributes, such as location, setting, and atmosphere (Cabrera & LaNasa, 2000; Coccari & Javalgi, 1995; Comm & LaBay, 1996; Galotti & Mark, 1994; Henrickson, 2002; Hossler et al., 1999; Kelpe Kern, 2000; Letawsky, Schneider, Pedersen, & Palmer, 2003; Mattern & Wyatt, 2009). These factors are consistently identified as influential across gender, geography, and socioeconomic groups, suggesting they are highly relevant to students during their decision-making process.
others select a specific school because of the opportunities offered, such as financial aid or scholarships. Still others may make their choice based on the location of the school or specific programs offered. Failing to consider differing audience goals and to whom the message is directed can impede the recipient’s decision-making process. For example, a study evaluating the factors that influ-ence athletes to consider attending a university finds that the messages sent had a narrow focus (Letawsky et al., 2003). That is, the messages focused on issues related to athletics and did not address the academic concerns cited by athletes as most important to their decision-making. Of the five reasons cited by partici-pants as factors influencing their college choice, only two were related to ath-letics, and neither was the most frequently identified. Sending an unclear or limited message may portray an image that is inconsistent with the school’s intent and thus negatively influence potential members.
To make students aware of these and other characteristics that might influence their decision-making, schools provide targeted information via their print litera-ture and Web sites. Schools should present a message that is both accurate and desirable to provide adequate information to allow for informed decision-making. Recognizing this, many schools have adapted their Web sites to show-case specific images and incorporate key features such as online tours and applications that appeal to students seeking information (Anctil, 2008; Ramasu-bramanian, Gyure, & Mursi, 2002). Regarding the effectiveness of organiz-ational literature, however, students’ perceptions are mixed. This could indicate a need for organizations to adapt their strategies in using these resources to influence potential members. One alternative is for colleges to target distri-bution of organizational literature to coincide with students’ increased search activities. This typically occurs during their third year of school during which time they focus on external sources of information (Hossler et al., 1999). For students who have indicated an interest in a school, follow-up information should be sent early in the beginning of their final year in school since most students apply to colleges between October and April of their senior year, with 50% of applications sent between November and January (Hossler et al., 1999).
Research questions
decisions about the colleges and universities to which they will apply. The following research questions are posed:
(RQ1) What types of interpersonal and informational resources influence the decision-making process of a potential student to become affiliated with an institution of higher education?
(RQ2) What characteristics associated with institutions of higher education are most consistently desired by new members?
(RQ3) How do institutions of higher education make potential members aware that they have the characteristics desired by potential members?
Having a greater awareness of the factors that contribute to student decision-making allows schools to focus on those key areas. While schools cannot and should not attempt to be everything to everyone, recognizing characteristics that students deem as important might help schools address these key factors, thereby providing students with relevant information necessary to inform their selection process. Doing so may contribute to a more positive organiz-ational image by potential members.
Method
To understand how outsiders view an organization, their direct involvement must be solicited. This research considered viewpoints of external audiences by surveying potential organizational members; that is, high school students planning on attending college.
Data collection
Permission to attend an open house to survey potential incoming students was requested and granted from seven schools in New Jersey that had participated in related research. Permission was requested for the primary researcher and/or an assistant to attend an open house for high school students for the purpose of col-lecting survey data. In exchange for authorizing attendance, each school was offered copies of the results upon completion of the study.
have, which might alert them to the presence of key characteristics that may affect their pursuit of a specific characteristic(s) or school. This heightened awareness made students attending open house events preferred participants for the survey.
At each open house, the primary researcher or an assistant approached students who were together with their parents. A brief introduction and over-view of the project was offered, and their participation was requested. The assent form required a signature from the students to ensure they understood why the survey was being conducted and how the results would be used. Students who were under 18 years of age were given a consent form along with the survey and parents were also given a consent form. Students who were 18 years or older were given only the assent form and survey. Both consent forms and assent forms were separated from the surveys at the end of each open house and stored separately to ensure participant anonymity. Students who declined to participate were thanked for their time and left alone. Parents had the option of requesting a copy of the final results by check-ing a box on the consent form and providcheck-ing a mailcheck-ing address. Those who made such a request were sent a copy of the results.
Instrument
The primary objective of the survey (Appendix 1) was to identify the resources that influence high school students when making decisions about applying to colleges or universities. Four open-ended questions requested that students identify specific desirable qualities or characteristics they sought in schools. In addition, students were asked to select responses from a series of 7-point Likert scale questions, with 1 being ‘strongly disagree’ and 7 being ‘strongly agree,’ that listed various institutional characteristics, interpersonal sources, and informational resources that might influence their decision-making in this context. Demographic data about the students’ high school, their accessibility to computers, and their attendance at college open houses was also requested. Additional open-ended questions positioned after the Likert-scale questions offered students the opportunity to add information that was not included on the survey (e.g., ‘Is there something else you look for in a school that is not on the list?’). A total of 249 surveys were collected. Although not all surveys were completed entirely, either the open-ended or the Likert-type questions were answered on every survey, making them all usable in some form.
Open-ended questions
In some cases one or more open-ended questions were not answered (Q1: n¼
4; Q2: n¼17; Q3: n ¼18; Q4: n¼8). Open-ended questions allow for a richer
description than is afforded by limited response choices and also allows the opportunity for respondents to include or expand on the selection criteria that they deem as important in the school selection process. Students were asked to write answers to the following questions:
(1) What are three things that would make you choose a certain college? (2) How do colleges let you know that they are the kind of school that you
want to go to?
(3) Realistically, what school (or what kind of school) do you think you will attend and why?
(4) Please finish this sentence: ‘When I finally select a college to attend it will be because ________________.’
As suggested by previously cited research (Bergerson, 2009; Cabrera & LaNasa, 2000; Galotti and Mark, 1994; Henrickson, 2002; Hossler et al., 1999; Kelpe Kern, 2000; Letawsky et al., 2003; Rowan-Kenyon, Bell, & Perna, 2008), stu-dents consider multiple characteristics when applying to a college. Thus it is worthwhile to consider the influence of these characteristics on the decision-making process. The intent of the open-ended questions was to solicit specific information from students to isolate unique or common characteristics that may be more influential than others. To better understand the influence of these emergent characteristics, it was decided that the results of the open-ended questions would serve as dependent variables for the data analyses. The first dependent variable (DV1) would be represented by the number of distinct, nonrepeated decision criteria stated by respondents across all four open-ended questions. The second (DV2) and third dependent (DV3) variables would be determined by the responses provided to the third and fourth open-ended questions, respectively, as these questions best encapsulate the desired decision outcomes of the participants.
Likert-scale items
college fairs. Informational sources include Web sites, magazine rankings, college guides, materials sent by schools, and materials requested by students. Research suggests the influence of printed materials on students is limited (Anctil, 2008; Galotti, 2000; Hossler et al., 1999). This study will attempt to better determine if and how informational sources are used by students.
A pilot test was conducted to confirm the clarity of the open-ended questions and to determine if additional characteristics would be suggested by respon-dents. Undergraduate students from two communication courses at a large, mid-Atlantic university were offered extra credit to complete the survey. All students participated, and 41 surveys were collected. The responses provided were in line with the expectations for the listed questions, and no new charac-teristics were suggested, thus the survey was considered valid.
Data analysis
Open-ended questions
Responses to each of the four questions were transcribed and entered into an Excel spreadsheet to help organize and sort responses. The four questions yielded more than 1800 responses. Multiple responses to an individual question were often provided. In such cases each response was treated as a separate answer. For example, if a student answered that cost and location were factors that would influence his or her decision to attend a school, both responses (cost and location) were coded individually.
Since the questions sought different types of responses and respondents often provided multiple answers, a broad range of categories was defined. The primary researcher reviewed all responses and used an open-coding system to create a preliminary coding scheme consisting of 23 categories. As is typical of this methodology, the number of categories (Appendix 2) were col-lapsed to a total of 15 through regrouping and consolidation (Lindlof & Taylor, 2002; Strauss & Corbin, 1998).
The primary researcher and three coders, one undergraduate and two gradu-ate students, analyzed a random sample of 20% of the completed surveys (n¼
50) to validate the coding categories. A coding sheet created by the primary researcher was provided to the three other coders and the categories explained. Although the primary coder had developed the coding sheet, her participation in the coding session was deemed appropriate because as a result of the sorting process all responses had been grouped alphabetically rather than by respon-dent. This process, combined with the sheer volume of data, made it virtually impossible to link any individual responses back to a specific survey. Thus, although she had greater knowledge of the coding categories, her role in coding the survey data was comparable to that of the other coders.
listed and the coders were asked to independently identify the category they felt best described the response. All three coders provided responses identical to those of the primary researcher. After reviewing the pretest, all four coders inde-pendently coded the 50 surveys. Intercoder reliability was computed based on the number of times identical responses were provided among the coders. Cronbach’s alpha was .97 (range¼ .961 – .975; M¼1.8; SD ¼1.04).
A limited number of responses were provided to the three additional open-ended questions; those comments were consolidated by the primary researcher and collectively discussed by all four coders rather than independently coded. A response that matched one of the characteristics included among the Likert-scale choices was coded accordingly. All remaining responses were reviewed and categorized using one of the coding categories that resulted from analysis of the four open-ended questions.
Likert-scale items
A multiple methods approach using quantitative analyses of data was employed. In coding the responses to the open-ended questions, several write-in responses matched characteristics that were included in the Likert-scales. Where dupli-cation existed between write-in responses and the Likert-scale responses, bivari-ate correlation procedures were performed. A Pearson’s correlation coefficient was determined using pairwise-exclusion and a two-tailed test of significance. Correlations indicate the degree of the relationship between two variables. In this case, correlations were run between responses to the open-ended questions and the Likert-scale choices to determine if the responses were consistent. For example, a student might write in programs, cost, and atmosphere as reasons for choosing a school. The first two responses, programs and cost, are listed among the Likert-scale choices. Thus it is reasonable to expect that a student who provided such responses would give a high ranking to the identical Likert-scale choices, suggesting greater consistency of responses.
‘environment’ or ‘feel’ of the school. The most frequently cited responses to the third and fourth open-ended questions from the survey were used to determine these variables. Because these responses were unique from the Likert-scale responses, their distinctiveness from the independent variables confirmed their validity as dependent variables.
In total, the multiple methodologies allow for more comprehensive analyses of the data. Using different tests allows for both exploration and confirmation of the findings. In addition, because all methodologies have weaknesses, using multiple methods can offer clarity and complimentarity of the analysis, thereby avoiding any limitations that may be inherent in a given method.
Results
The surveys considered the views of potential members – first time students – as critical to the organizational image. A multi-method approach was used to analyze survey data in response to the research questions that look at the school characteristics and the interpersonal and informational resources that influence students in their decision-making process.
Descriptive statistics
Demographic information related to the college selection process was requested of participants. The majority of students (N¼ 227) were White (71.4%, n¼
162). Other ethnic groups included Asian Americans/Pacific Islanders (9.6%, n¼24), Hispanics/Latin Americans (8.8%, n¼ 20), African Americans/
Black (4.4%, n ¼10), and Native American/American Indian (0.4%, n¼ 1).
Although this distribution is slightly skewed based on national trends (US Department of Education, 2005; US Department of Labor, 2000), it supports more recent studies that report increased enrollments among racially diverse populations, particularly Hispanic and Asian American (Anderson, 2003). All respondents reported ‘a lot’ (93.4%) or ‘some’ (6.6%) computer access, and all but one respondent had a computer at home.
The majority of respondents (N¼ 224) were high school seniors (75%, n¼
168). Participants were from both public (87.5%, n ¼196) and private (12.5%,
n¼28) high schools, primarily from New Jersey (87.3%, n¼ 185) as well as
surrounding states (NY: 4.7%, n ¼10; PA: 4.2%, n ¼9; CT: 1.9%, n ¼ 4;
New England area: 1.4%, n¼ 3).
The majority of respondents began planning to attend college between one and two years prior to taking the survey (56.7%, n¼105). The majority of
mean of 3.32 (SD¼ 2.38) schools each. Demographic characteristics are
sum-marized in Table 1.
Descriptive statistics were performed on the seven-point Likert-scale items. The institutional characteristics most frequently cited by students as influential to their decision-making were in line with previous research. The characteristics were academic programs (95%, M¼6.55, SD ¼1.00), location (90%, M¼
6.00, SD¼1.26), and cost (85%, M¼ 5.83, SD¼ 1.28). The least influential
were religious affiliation (21%, M¼ 3.31, SD¼ 1.75), family or friend
attended the school (31%, M¼ 3.62, SD¼1.75), and athletics (41%, M¼
4.08, SD¼1.77).
Responses to the interpersonal and informational resources used to attract new students were not as strong. The most influential interpersonal sources were tours/open house (86%, M¼ 5.80, SD¼ 1.20), teachers (73%, M¼
5.21, SD¼ 1.38), and interviews at the school (72%, M¼ 5.20, SD¼
1.35). The least influential interpersonal sources were clergy (9%, M¼2.85,
SD¼ 1.51), family/friends (55%, M¼4.44, SD ¼ 1.62), and college fairs
(50%, M¼ 4.47, SD¼ 1.55). The most influential informational resources
were college Web sites (74%, M¼5.21, SD¼ 1.41), materials requested
from schools (69%, M¼5.15, SD ¼1.32), and magazine rankings (57%, M ¼4.62, SD¼ 1.50). College guides (50%, M¼ 4.53, SD¼1.41) and
unsoli-cited materials sent by schools (44%, M¼4.45, SD¼ 1.51) were at the lower
end of the informational resources used. Table 2 displays frequencies, percen-tages, and measures of central tendency for these variables.
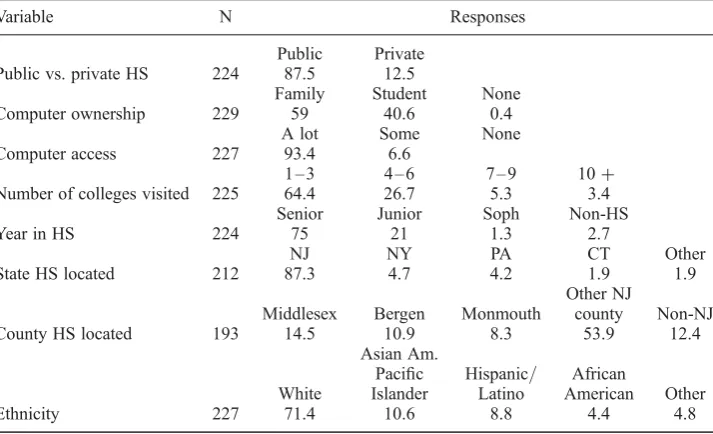
Table 1. Demographic characteristics of students applying to institutions of higher education.
Variable N Responses
Public Private Public vs. private HS 224 87.5 12.5
Family Student None
Computer ownership 229 59 40.6 0.4
A lot Some None
Computer access 227 93.4 6.6
1 – 3 4 – 6 7 – 9 10+
Number of colleges visited 225 64.4 26.7 5.3 3.4 Senior Junior Soph Non-HS
Year in HS 224 75 21 1.3 2.7
NJ NY PA CT Other
State HS located 212 87.3 4.7 4.2 1.9 1.9
Other NJ
Middlesex Bergen Monmouth county Non-NJ
County HS located 193 14.5 10.9 8.3 53.9 12.4
Asian Am.
Pacific Hispanic/ African
White Islander Latino American Other
Ethnicity 227 71.4 10.6 8.8 4.4 4.8
Correlations
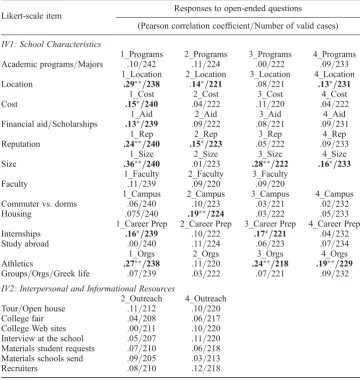
Because the subjective responses to the open-ended questions often identified the same characteristics included among the Likert-scale options, correlations were performed to check for consistency in responses. Upon coding the open-ended questions, seven categories of responses (academic programs, location, cost, financial aid, reputation, size, and faculty) were found to be identical to cat-egories included among the Likert-scale responses. Responses from both groups, the open-ended questions and matching Likert-scale responses, were correlated and are presented in Table 3. The purpose of running correlations between the open-ended and these Likert-item responses was to look for relationships among responses to both sets of questions. Although five of seven of the Table 2. Frequencies of factors influencing students’ decision to apply to institutions of higher
education by school characteristics and resources used to attract students.
Percent Percent Percent
Frequencies N Mean SD Agree1 Neutral Disagree2
IV1: School Characteristics
Academic programs/Majors 248 6.55 1.00 95.2 3.2 1.6
Athletics/Sports 244 4.08 1.77 41.4 28.7 29.9
Commuter vs. dorms 246 5.43 1.39 74.8 17.9 7.3
Cost 246 5.83 1.28 85.0 10.6 4.4
Faculty 245 5.39 1.31 75.9 16.3 7.7
Family/Friend attend school 246 3.62 1.75 30.5 29.7 39.8 Financial aid/Scholarships 245 5.74 1.32 83.3 10.6 6.1 Groups/Orgs/Greek life 245 4.29 1.73 48.1 24.5 27.4
Housing 246 5.53 1.38 81.7 11.8 6.4
Internships 245 5.53 1.32 78.0 14.7 7.3
Location 244 6.00 1.26 89.8 6.6 3.6
Religious affiliation 245 3.31 1.75 21.2 33.9 44.9
Reputation 246 5.47 1.32 77.2 17.1 5.6
Safety school 242 5.06 1.52 64.8 21.5 13.7
Size 246 5.46 1.25 78.0 15.9 6.1
Social life 246 5.58 1.28 80.4 14.6 4.8
Study abroad 246 4.53 1.79 47.6 29.3 23.1
IV2: Interpersonal and Informational Resources
Clergy (priest/rabbi/imam) 227 2.85 1.51 9.3 34.4 56.4
College fair 226 4.47 1.55 49.6 28.3 22.1
Family/Friend 225 4.44 1.62 54.7 21.8 23.5
HS guidance counselor 228 4.69 1.53 60.1 19.7 20.2 Interview at the school 224 5.20 1.35 71.5 19.6 8.9
Recruiters 227 4.60 1.47 50.2 30.8 19.0
Teachers 227 5.21 1.38 72.7 18.1 9.2
Tour/Open house 230 5.80 1.20 86.4 10.0 3.4
College guides 225 4.53 1.41 49.8 32.4 17.8
College Web sites 229 5.21 1.41 74.3 12.7 13.1
Magazine ranking 228 4.62 1.50 57.0 24.1 18.9
Materials sent by schools 222 4.45 1.51 44.1 32.9 23.0 Materials reqt from schools 227 5.15 1.32 69.2 21.6 9.2
Likert-items were significantly correlated with at least one of the four open-ended questions, weak findings indicate that these results should be interpreted cautiously. Still, these findings suggest that students showed a degree of consist-ency across responses, suggesting greater reliability of responses.
In addition, three coding categories included references to multiple school characteristics identified among the Likert-scale items. Campus included the Likert items housing and commuter versus dorm. Career preparation included internships and study abroad programs. Organizations included athletics and groups/organizations. These multivariable categories were correlated with the open-ended questions. Again, although findings were weak, three of the four multivariable categories showed significant correlations with at least one Table 3. Correlations between responses to open-ended questions and Likert-scale items.
Likert-scale item Responses to open-ended questions
(Pearson correlation coefficient/Number of valid cases)
IV1: School Characteristics
Financial aid/Scholarships .13∗/
239 .09/222 .08/221 .09/231 1_Career Prep 2_Career Prep 3_Career Prep 4_Career Prep
Internships .16∗/ Interview at the school .05/207 .11/220 Materials student requests .07/210 .06/218 Materials schools send .09/205 .03/213 Recruiters .08/210 .12/218
Note:∗p
,.05 (two-tailed);∗ ∗p
of the four open-ended questions, further suggesting that students showed a degree of consistency across responses.
Multiple regression analysis
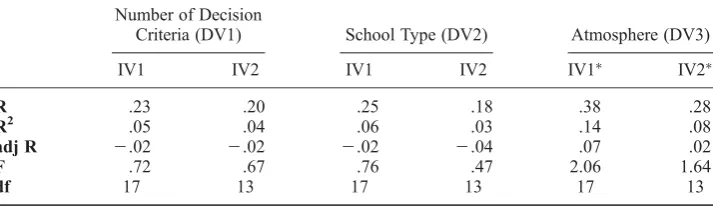
Multiple regression analyses were conducted to predict relationships between the dependent variables and independent variables. Standard multiple regression ana-lyses were performed using each of the three dependent variables (DV1: number of decision criteria, DV2: school type, and DV3: atmosphere) and two indepen-dent variables, represented by each grouping of Likert-scale choices. The first grouping (IV1) included the school characteristics students might look for when making decisions about applying to a college; the second grouping (IV2) included the resources students might seek, both interpersonal and informational. Table 4 summarizes the regression analysis models for all of the variables.
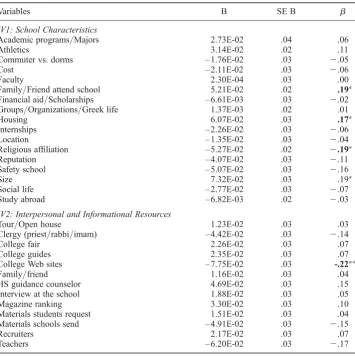
No significant relationships were found between either DV1 or DV2 and IV1 or IV2. The model using DV3 (atmosphere) and IV1 (school character-istics) yielded significant results. R2 for the model was .143, and adjusted R2 was .07. The variables that significantly predicted students’ views of the school’s atmosphere were family or friend attended the school (t¼ 2.50, p ¼
.01), size (t¼ 2.42, p¼ .01), and housing (t¼ 2.18, p¼ .03). Religious
affiliation (t ¼ – 2.38, p ¼.02) was also found to be significant; however,
the relationship was negative. When considering the resources students sought (IV2) when making decisions about applying to schools, college Web sites (t¼ – 2.60, p¼ .01) were found to have a significant inverse relationship
in how students viewed the school’s atmosphere. R2 for the model was .081, and adjusted R2was .02. Table 5 displays the unstandardized regression coeffi-cients (B) and standardized regression coefficoeffi-cients (b) for each variable.
The first research question asked what types of interpersonal and informa-tional resources influence students in their decision-making process. Based on the 7-point Likert scale, respondents were more likely to indicate some level of agreement (strongly agree, agree, somewhat agree) rather than a Table 4. Summary of multiple regression models showing relationship between all dependent and independent variables.
Number of Decision
Criteria (DV1) School Type (DV2) Atmosphere (DV3)
IV1 IV2 IV1 IV2 IV1∗
IV2∗
R .23 .20 .25 .18 .38 .28
R2 .05 .04 .06 .03 .14 .08
adj R 2.02 2.02 2.02 2.04 .07 .02
F .72 .67 .76 .47 2.06 1.64
df 17 13 17 13 17 13
level of disagreement (strongly disagree, disagree, somewhat disagree) that interpersonal sources had some influence on their decision to apply to a college. These included campus tours/open houses (M¼ 5.80, SD¼ 1.20),
teachers (M¼5.21, SD¼ 1.39), interviews at the school (M¼ 5.20, SD¼
1.35), high school guidance counselors (M¼4.69, SD¼ 1.53), recruiters
(M¼4.60, SD ¼1.47), college fairs (M¼ 4.47, SD¼ 1.55), and family
members/friends (M ¼4.44, SD ¼1.62). The sole exception in this category
was clergy (M¼2.85, SD ¼1.51). The average of the means of these
scores (M¼4.66) suggests neutrality to weak agreement that interpersonal
resources influence students’ decision to apply to a school. It appears interper-sonal sources physically located at colleges are most influential, as indicated by higher frequencies for open houses and interviews at the school.
Table 5. Summary of regression analysis for variables predicting that school characteristics and interpersonal/informational resources will influence students’ view of atmosphere.
Variables B SE B b
IV1: School Characteristics
Academic programs/Majors 2.73E-02 .04 .06
Athletics 3.14E-02 .02 .11
Commuter vs. dorms – 1.76E-02 .03 2.05
Cost – 2.11E-02 .03 2.06
Faculty 2.30E-04 .03 .00
Family/Friend attend school 5.21E-02 .02 .19∗
Financial aid/Scholarships – 6.61E-03 .03 2.02 Groups/Organizations/Greek life 1.37E-03 .02 .01
Housing 6.07E-02 .03 .17∗
Internships – 2.26E-02 .03 2.06
Location – 1.35E-02 .03 2.04
Religious affiliation – 5.27E-02 .02 2.19∗
Reputation – 4.07E-02 .03 2.11
Safety school – 5.07E-02 .03 2.16
Size 7.32E-02 .03 .19∗
Social life – 2.77E-02 .03 2.07
Study abroad – 6.82E-03 .02 2.03
IV2: Interpersonal and Informational Resources
Tour/Open house 1.23E-02 .03 .03
Clergy (priest/rabbi/imam) – 4.42E-02 .03 2.14
College fair 2.26E-02 .03 .07
College guides 2.35E-02 .03 .07
College Web sites – 7.75E-02 .03 -.22∗ ∗
Family/friend 1.16E-02 .03 .04
HS guidance counselor 4.69E-02 .03 .15
Interview at the school 1.88E-02 .03 .05
Magazine ranking 3.30E-02 .03 .10
Materials students request 1.51E-02 .03 .04
Materials schools send – 4.91E-02 .03 2.15
Recruiters 2.17E-02 .03 .07
Teachers – 6.20E-02 .03 2.17
Note:∗p
,.05;∗ ∗p
Responses to the open-ended questions yielded mixed results regarding the influence of interpersonal sources. For example, although faculty was identified as a reason why a student would select a school, only 2.57% of respondents ident-ified it specifically. The campus category was identident-ified by 13.93% of respondents and included references to staff, students, and people at the school, among other characteristics. However, individual characteristics were not analyzed separately to determine to what degree they contributed to the overall category. Another cat-egory, outreach, was comprised of multiple interpersonal and informational sources and was frequently identified (70.2%). As with the campus category, however, the degree to which individual interpersonal or informational resources contributed to the overall results was not determined.
The survey also allowed for write-in responses to explicate the Likert scales. Twenty-seven respondents provided comments. After eliminating responses that duplicated the Likert-scale choices, comments referencing interpersonal influences included coaches (n¼ 2), alumni (n¼ 1), other people who
attended or visited the school (n¼ 3), word of mouth (n¼ 1), peers (n¼ 1),
and phone calls (n¼ 1). In summary, although several interpersonal sources
were cited, their effect appears limited.
Similar levels of agreement were found among the informational resources: materials requested from schools (M¼ 5.15, SD¼ 1.32), magazine rankings
(M¼ 4.62, SD¼1.50), college guides (M¼ 4.53, SD¼1.41), and
unsoli-cited materials sent by schools (M¼ 4.45, SD¼ 1.51). Although the multiple
regression analysis found college Web sites to have a negative influence, the frequency with which the category was identified by students as influential (M¼ 5.21, SD¼1.41) indicates mixed results. A possible explanation for
this could be confusion about the category. Although the Likert-scale item was labeled as ‘college Web sites,’ some students may have considered other college-related Web sites to be included, such as collegeboard.com. The fre-quency with which this was included in the write-in responses suggests that it is a notable resource among this group.
Additional resources identified through the open-ended questions included online sources, information packets, catalogs, mailed information, advertising, and other materials used by colleges to solicit new members. As noted, however, these responses were combined with multiple other responses, thus the individual influence of these specific resources was not calculated. Among the write-in answers, electronic sources were most frequently identified (n¼
10), including six responses that cited a specific Web site (collegeboard.com) as an additional resource. Similar to the interpersonal sources, the average of the informational resources scores (M¼ 4.79) likewise suggested neutrality
to weak agreement regarding the influence of informational resources on stu-dents’ decision to apply to a school.
or friend who attended the school influenced prospective students. Additionally, the frequency with which respondents identified programs offered (M¼6.55,
SD¼ .99) and location (M¼ 6.00, SD¼ 1.26) indicate that they likewise
influ-ence student decision-making. Five other areas had mean scores of over 5.5, suggesting higher levels of agreement than neutrality. Those areas were cost (M¼5.83, SD¼ 1.28), financial aid/scholarships (M¼ 5.74, SD¼ 1.32),
social life (M¼5.58, SD ¼1.28), housing (M¼ 5.53, SD¼ 1.38), and
internships (M¼5.53, SD¼ 1.32). This broad range of characteristics cited
by students suggests that schools should be comprehensive in addressing multiple aspects of their image when appealing to potential members.
Various means were used to make potential members aware that schools had desired characteristics (RQ3). As noted, the outreach category that emerged from the coding of the second open-ended question accounted for the majority of the responses (70.2%) and reflected multiple practices through which stu-dents were made aware of the characteristics they desired. Among others these included tours, open houses, campus visits, marketing via mail and the Internet, presentations, publications, and word of mouth. Among the Likert-scale responses, tours/open house ranked highest among interpersonal resources and third overall among all variables in frequency (86.5%, M¼
5.8, SD¼ 1.20), suggesting that visiting the school in person is an important
means through which students gather information.
In summary, these analyses found that characteristics directly associated with schools, such as programs, location, cost, tours/open house, and others, were most influential to students when making decisions about colleges. Both the Likert-item and open-ended responses supported these findings. This was perhaps best supported by the number of students (60%) who indepen-dently stated that a school’s atmosphere or environment, that is something they found desirable when visiting the campus, would be the determining factor in their decision to pursue a college. This suggests that potential students seek both concrete and abstract qualities about a school when making decisions about whether or not to affiliate (RQ2).
well as instrumental in influencing a student’s ultimate decision on whether to apply to a school.
Discussion
As organizations, including institutions of higher education, and their member-ship continue to evolve, scholars must likewise reconsider how we think about them (Cheney & Christensen, 2001; Gioia et al., 2000). This study attempts to contribute to our understanding of the characteristics of organizational image that influence the decision-making of potential members. First, similarities among characteristics of college-seeking students are reviewed. Next, the importance of direct contact with a school is noted. Finally, the influence of specific attributes, including institutional characteristics, interpersonal sources, and informational resources as well as intangible factors are discussed.
Consistency of members
Perhaps the most consistent finding of this study is that college-bound students are a uniform group. Regardless of demographic factors, no specific type of student emerged from these analyses. Although a few institutional character-istics were more significant to students overall, most students indicated some level of interest about a wide range of school attributes. It appears that gaining information about multiple aspects about colleges is an integral part of their decision-making process. Attempting to fulfill the need for knowledge about such a broad range of concerns could complicate an already stressful decision-making period for the student. Indeed, students who commented on the decision-making process noted that it was ‘a long, tedious, stressful pro-cedure’ and the ‘hardest and most stressful process.’ Given the magnitude of the decision and the potential long-term benefits and risks (Anctil, 2008; Moogan, Baron, & Harris, 1999), there is little wonder that the process can be overwhelming. From the school’s perspective, adequately and effectively addressing the many and diverse concerns of potential members adds to the dif-ficulty of creating a unified image. To benefit both groups, schools would do well to be comprehensive in addressing their multiple attributes. Providing at least a thumbnail view on a variety of topics allows schools to highlight key areas that both address student concerns and offer insights into the school. For the student, coverage of a broad range of topics might help fill informational gaps, thereby providing the necessary resources for making a decision.
Seeing is believing
sense of what the school represents, literally and symbolically, more so than hearing what others have to say about it. Students identified open houses or tours (86%) as the third most influential factor in their decision-making process, after programs and location. Students believe that at ‘open houses you can tell a lot of things’ about the school and they allow students to ‘see the school for [their] own eyes.’ They also found that visiting campuses allowed them to see ‘the way [schools] present themselves’ and helped the stu-dents to answer questions such as ‘Am I welcome? Would I fit in?’ Open houses offer multiple opportunities for schools to communicate a positive image (Fischbach, 2006). Interviews at the school (72%) were also considered impor-tant to many students. Students use open houses and on-site visits to determine if a school is one they want – or do not want – to attend (Anctil, 2008; McAllister-Spooner, 2008; McAllister & Taylor, 2007; Moogan et al., 1999). For many, seeing a school firsthand provides them with the information they feel they need to make a decision about a school. As summarized by a student’s response, ‘Visiting a college tells me more than most pamphlets or booklets could ever tell me.’
Due to time and financial restraints it may be difficult for students (and parents) to visit each of the schools to which they would like to apply. This may contribute to the reason why the majority of students (88.2% nationwide) remain in state to attend college (US Department of Education, 2000). Advances in technologies that provide more detailed graphic representations of the physical attributes of the school may be an option for schools that would like to encourage out-of-state enrollment. Still, schools should be mindful that personally seeing and experiencing the campus, including physical as well as academic and social aspects, influences many aspects of student decision-making. Frequent evaluation of open house programs should be under-taken by schools to ensure they offer appropriate opportunities for potential members to experience many different aspects of the campus and its offerings. Presenting a desirable image to potential members can also serve as an initial step to anticipatory socialization (Jablin, 1987). Thus open houses offer a poten-tial benefit to schools because socialization experiences influence information and feedback-seeking behaviors (Mignerey, Rubin, & Gorden, 1995). For stu-dents deciding among several options, a positive campus experience can lead to continued contact with the school and perhaps future enrollment.
Institutional aspects versus secondary sources of information
about additional resources used to gather information about college. Of the 13 responses (43%) that identified informational sources, the majority (12) reflected efforts they had undertaken through use of the Internet or use of college guides. This supports research that found materials sent by schools have little influence on students’ college selection process (Hossler et al., 1999). The level of effort put forth by potential members suggests a willingness and desire to gain a comprehensive overview of several schools in order to be well-informed in their decision-making. This, again, reinforces the potential benefit to schools in hosting open house events to both showcase the physical attributes of their campus and to address the students’ many concerns.
Of the three overarching categories – school characteristics, informational resources, and interpersonal sources – the latter category was least influential overall. Indeed the category receiving the lowest ranking overall by a distinct margin (9.3%) was an interpersonal source (clergy). Among other interpersonal sources, this study found that teachers were most influential. While this sup-ports some previous research (Helwig, 2004; Moogan et al., 1999), it contra-dicts a preponderance of research that suggests that parents are most influential (Cabrera & LaNasa, 2000; Hossler et al., 1999; Ketterson & Blue-stein, 1997; Otto, 2000; Paulsen, 1990; Sachs, 2002; Scott & Daniel, 2001). A possible explanation for this is that parents were not identified as a separate survey item. Instead, a broader category labeled ‘family member/friend’ was offered. Separating these categories or identifying parents as an option distinct from other family members may have yielded different results. Another con-sideration is that parents’ ideas and expectations about what schools their child should attend can cause stress for their children, as does the influence they hold over them (Broekemier & Hodge, 2008).
Beyond those who are well-known to students such as parents and teachers, respondents also noted the influence of people affiliated with the schools that they visited. Prospective students indicated that ‘the people already there’ and the ‘students who either went here or are still here’ let them know that the school may be somewhere they might attend. This supports the findings of Capraro, Patrick, and Wilson (2004) whose study on social life at colleges indicates that there is a positive relationship between attractiveness of social life at a school, which includes ‘people that you’d fit in with’ or ‘hang out with’ (p. 98) and likelihood to undertake decision approach actions (i.e., request information, visit, or apply) toward that school.
Despite evidence indicating that measurable factors contribute to the decision-making process, many students made their final decision based on much less tan-gible factors. The influence of these indefinable aspects is discussed next.
Intangible influences: the ‘It’ factor
relevant to their decisions. Almost 60% of students identified the atmosphere of the school as the reason they would ultimately decide to attend. They chose schools because ‘it feels right’ or ‘comfortable,’ or ‘[the student] really liked something about it,’ or ‘because it’s where [the students] feel at home for all the right reasons.’ Students want to feel ‘like [they] belong at the school’ or that ‘it’s where [they’re] supposed to be.’ Perhaps one student’s view best cap-tures the essence of the ‘it’ factor: ‘I fell in love with it and can’t wait to begin.’ Thus, while students are confident that they will know what they want when they see it or feel it, there was a lack of clarity about what ‘it’ is. This reinforces the need for organizations to provide a complete and accurate picture of what they are, both in their materials and during campus visits (Cable, Aiman-Smith, Mulvey, & Edwards, 2000). As Anctil (2008) describes, schools need to ‘make the intangible tangible’ (p. 32). Although achieving a balance between accuracy and desirability of image may be difficult, doing so provides students with a more informed view of the school.
Conclusion
This study provides a clearer picture of the characteristics that potential members seek when deciding if affiliation with a specific college or university is desirable. Respondents seek a broad range of information to inform them about the attributes of selected schools. This suggests that schools provide at least minimal information on a host of subjects. One way of doing so is for schools to recognize the influence of direct contact with the school via tours, open houses, or on-campus interviews. As such, these provide excellent oppor-tunities for schools to highlight their strengths and address student concerns. Furthermore, because potential members are often unable to articulate the specific qualities that appeal to them, personal visits offer an opportunity for students to identify or experience characteristics specific to each school. This may help them narrow their decision. Ultimately schools benefit even if a student decides not to apply, because students who decide not to attend may be students who would eventually transfer or leave due to some type of incompatibility.
References
Adams, J., & Evenland, V. (2007). Marketing online degree programs: How do traditional resi-dential programs compare?Journal of Marketing for Higher Education,17,67–90. Anctil, E.J. (2008). Selling higher education: Marketing and advertising America’s colleges and
universities.ASHE Higher Education Report,34(2), 1–121.
Anderson, E.L. (2003). Changing U.S. demographics and American higher education.New Directions for Higher Education,121,3–12.
Berg, P.O. (1986). Symbolic management of human resources.Human Resources Management,
25,557–559.
Bergerson, A.A. (2009). College choice as a comprehensive process.ASHE Higher Education Report,35,21–46.
Broekemier, G.M., & Hodge, K.A. (2008). Stressors for college bound high school students based on sex of respondents.Journal of Marketing for Higher Education,18,34–49. Cable, D.M., Aiman-Smith, L., Mulvey, P.W., & Edwards, J.R. (2000). The sources and
accu-racy of job applicants’ beliefs about organizational culture. Academy of Management Journal,43,1076–1085.
Cabrera, A.F., & LaNasa S.M. (2000). Understanding the college-choice process. In A.F. Cabrera & S.M. LaNassa (Eds.), New directions for institutional research: Understanding the college choice of disadvantaged students (No. 107, pp. 5 – 22) San Francisco: Jossey-Bass.
Capraro, A.J., Patrick, M.L., & Wilson, M. (2004). Attracting college candidates: The impact of perceived social life.Journal of Marketing for Higher Education,14,93–105.
Cerit, Y. (2006). Organizational image perceptions of the university by undergraduate students of school of education.Educational Administration: Theory & Practice,47,359–365. Cheney, G., & Christensen, L.T. (2001). Organizational identity: Linkages between internal and
external communication. In F.M. Jablin & L.L. Putnam (Eds.),The new handbook of organ-izational communication: Advances in theory, research, and methods (pp. 231–269). Thousand Oaks, CA: Sage.
Coccari, R.L., & Javalgi, R.J. (1995). Analysis of students’ needs in selecting a college or uni-versity in a changing environment.Journal of Marketing for Higher Education,6,27–39. Comm, C.L., & LaBay, D.G. (1996). Repositioning colleges using changing student quality per-ceptions: An exploratory analysis.Journal of Marketing for Higher Education,7,21–34. Day, J.C., Janus, A., & Davis, J. (2005).Computer and Internet use in the United States: 2003
(pp. 23–208). Washington, DC: US Census Bureau.
DesJardins, S.L., Ahlburg, D.A., & McCall, B.P. (2006). An integrated model of application, admission, enrollment, and financial aid.The Journal of Higher Education,7,381–429. Dutton, J.E., & Dukerich, J.M. (1991). Keeping an eye on the mirror: Image and identity in
organizational adaptation.Academy of Management Journal,34,517–554.
Dutton, J.E., Dukerich, J.M., & Harquail, C.V. (1994). Organizational images and member identification.Administrative Science Quarterly,39,239–263.
Elliott, K.M., & Healy, M.A. (2001). Key factors influencing student satisfaction related to recruitment and retention.Journal of Marketing for Higher Education,10,1–11.
Fischbach, R. (2006). Assessing the impact of university open house activities.College Student Journal,40,227–34.
Freeman, K. (1999). The race factor in African Americans’ college choice.Urban Education,
34,4–25.
Galotti, K.M. (1995). A longitudinal study of real-life decision making: Choosing a college.
Applied Cognitive Psychology,9,459–484.
Galotti, K.M., & Mark, M.C. (1994). How do high school students structure an important life decision? A short-term longitudinal study of the college decision making process.
Research in Higher Education, 35, 589 – 607.
Gioia, D.A., Schultz, M., & Corley, K.G. (2000). Organizational identity, image, and adaptive instability.Academy of Management Review,1,63–81.
Gordona, J., & Berhow, S. (2009). University Websites and dialogic features for building relationships with potential students.Public Relations Review,35,150–152.
Gray, L. (1991).Marketing education. Milton Keynes, England: Open University Press. Hatch, M.J., & Schultz, M. (2002). The dynamics of organizational identity.Human Relations,
55,989–1018.
Hegeman, D.L., Davies, T.G., & Banning, J.H. (2007). Community colleges’ use of the Web to communicate their mission: Slights of commission and omission. Community College Journal of Research and Practice,31,129–147.
Henrickson, L. (2002). Old wine in a new wineskin. Social Science Computer Review, 20,
400–419.
Horrigan, J., & Raine, L. (2006). The Internet’s growing role in life’s major moments. Washington, DC: American Institutes for Research for Pew Internet and American Life Project.
Hossler, D., Schmit, J., & Vesper, N. (1999).Going to college: How social, economic, and edu-cational factors influence the decision students make. Baltimore, MD: Johns Hopkins University Press.
Ivy, J. (2001). Higher education institution image: A correspondence analysis approach.
International Journal of Educational Management,15(6), 276–282.
Jablin, F.M. (1987). Organizational entry, assimilation and exit. In F.M. Jablin, L.L. Putnam, K.H. Roberts, & L.W. Porter (Eds.),Handbook of organizational communication: An inter-disciplinary perspective(pp. 679–740). Newbury Park, CA: Sage.
Johnson, L.S. (2000). The relevance of school to career: A study in student awareness.Journal of Career Development,26,263.
Jones, S. (2002).The Internet goes to college: How students are living in the future with today’s technology. Washington, DC: American Institutes for Research for Pew Internet and American Life Project.
Kang, S., & Norton, H.E. (2006). College and universities’ use of the World Wide Web: A public relations tool for the digital age.Public Relations Review,32,426–428.
Kelpe Kern, C.W. (2000). College choice influences: Urban high school students respond.
Community College Journal of Research & Practice,24,487–494.
Ketterson, T.U., & Blustein, D.L. (1997). Attachment relationships and the career exploration process.Career Development Quarterly,46,167–178.
Klassen, M.L. (2000). Lots of fun, not much work, and no hassles: Marketing images of higher education.Journal of Marketing for Higher Education,10,11–26.
Lane, J. (2000). A scientific approach for developing and testing a students’ job-career plan before 11th grade.Education,120,605–613.
Lapan, R.T., Tucker, B., Kim, S.-K., & Kosciulek, J.F. (2003). Preparing rural adolescents for post-high school transitions. Journal of Counseling and Development: JCD, 81,
329–342.
Lenhart, A., Madden, M., & Hitlin, P. (2005). Teens and technology. Washington, DC: Pew Internet and American Life Project.
Letawsky, N.R., Schneider, R.G., Pedersen, P.M., & Palmer, C.J. (2003). Factors influencing the college selection process of student-athletes: Are their factors similar to non-athletes?
College Student Journal,37,604–610.
Lewison, D.M., & Hawes, J.M. (2007). Student target marketing strategies for universities.
Journal of College Admission,196,14–19.
Lindlof, T.R., & Taylor, B.C. (2002).Qualitative communication research methods. Thousand Oaks, CA: Sage Publications.
Luque-Martı´nez, T., & Del Barrio-Garcı´a, S. (2009). Modelling university image: The teaching staff viewpoint.Public Relations Review,35,325–327.
Margulies, W. (1977, July – August). Make the most of your corporate identity. Harvard Business Review, 66–77.
Mattern, K., & Wyatt, J.N. (2009). Student choice of college: How far do students go for an edu-cation?Journal of College Admissions,203,18–29.
McAllister, S.M., & Taylor, M. (2007). Community college Websites as a tool for fostering dia-logue.Public Relations Review,33,230–232.
McAllister-Spooner, S.M. (2008). Users perceptions of dialogic public relations tactics via the Internet.Public Relations Journal,2,1–18.
Mentz, G., & Whiteside, R. (2003a). Internet college recruiting and marketing: Web promotion, techniques and law.Journal of College Admission,181,10–17.
Mentz, G., & Whiteside, R. (2003b). Web promotion, techniques, and law: An overview of effective engine placement and strategy for college enrollment management. Journal of College Admissions,181,10–17.
Mitchell, A.M. (1975). Emerging career guidance competencies. Personnel and Guidance Journal,53,700–703.
Moogan, Y.J., Baron, S., & Harris, K. (1999). Decision-making behaviour of potential higher education students.Higher Education Quarterly,53,211–228.
Otto, L.B. (2000). Youth perspectives on parental career influence. Journal of Career Development,27,111–118.
Paulsen, M.B. (1990). College choice: Understanding student enrollment behavior. ASHE-ERIC Higher Education Report No. 6. Washington, DC: The George Washington University, School of Education and Human Development.
Perna, L.W., & Titus, M.A. (2004). Understanding differences in the choice of college attended: The role of state public policies.Review of Higher Education,27,501–525.
Pew Internet and American Life Project. (2009). Trend data. Demographics of Internet users. Retrieved 21 January, 2010, from http://www.pewinternet.org/Static-Pages/Trend-Data/ Whos-Online.aspx
Poock, M.C., & Lefond, D. (2001). How college-bound prospects perceive university Web sites: Findings, implications, and turning browsers into applicants. College & University, 77,
15–21.
Powell, D.F., & Luzzo, D.A. (1998). Evaluating factors associated with the career maturity of high school students.The Career Development Quarterly,47,145–158.
Ramasubramanian, S., Gyure, J.F., & Mursi, N.M. (2002). Impact of Internet images: Impression-formation effects of university Web site images. Journal of Marketing for Higher Education,12,59–68.
Rowan-Kenyon, H.T., Bell, A.D., & Perna, L.W. (2008). Contextual influences on parental involvement in college going: Variations by social class. Journal of Higher Education,
79,564–586.
Sachs, S.B. (2002).Voices of reason: Adolescents talk about their futures over time. Westport, CT: Bergin & Garvey.
Scott, E.D., & Jehn, K.A. (2003). About face: How employee dishonesty influences a stake-holder’s image of an organization.Business & Society,42,234–266.
Scott, R., & Daniel, B.V. (2001). Why parents of undergraduates matter to higher education.
New Directions for Student Services, 94, 83–89.
Strauss, A., & Corbin, J. (1998).Basics of qualitative research: Techniques and procedures for developing grounded theory. Thousand Oaks, CA: Sage Publications.
Sung, M., & Yang, S. (2008). Toward the model of university image: The influence of brand personality, external prestige, and reputation. Journal of Public Relations Research,20,
357–376.
US Department of Education, National Center for Education Statistics. (2000). 1999 – 2000 national postsecondary student aid study(NPSAS:2000). Washington, DC: Author. US Department of Education, National Center for Labor Statistics. (2005). Postsecondary
institutions in the United States: Fall 2003 and degrees and other awards conferred: 2002 – 03(NCES 2005-154). Washington, DC: Author.
US Department of Labor, Bureau of Labor Statistics. (2000). College enrollment and work activity of 1999 high school graduates. Washington, DC: Author.
Wan, H., & Schell, R. (2007). Reassessing corporate image—An examination of how images bridges symbolic relationships with behavioral relationships.Journal of Public Relations Research,19,25–45.
Whitehead, J.M., Raffan, J., & Deaney, R. (2006). University choice: What influences the decisions of academically successful post-16 students?Higher Education Quarterly,60,
4–26.
Appendix 1
Organizational image survey
Organizational image: factors influencing student decision-making
1. What are three things that would make you choose a certain college?
2. What do colleges do to let you know that they are the kind of school that you want to go to?
3. Realistically, what school (or type of school) do you think you will attend and why?
4. Please finish this sentence: ‘When I finally select a college to attend it will be because...’
5. Please rate the following characteristics that may influence your decision to apply (or not to apply) to a college 1 ¼strongly disagree; 2¼disagree; 3¼somewhat disagree; 4¼neutral; 5¼agree somewhat; 6¼agree; 7¼strongly agree
6. Please rate the following characteristics that may influence your decision to apply (or not to apply) to a college 1¼strongly disagree; 2¼disagree; 3¼somewhat disagree; 4¼neutral; 5¼agree somewhat; 6¼agree; 7¼strongly agree
6a. Is there another source that you use to gather information about colleges that is not included on the list?
7. What else would you like to say about your college decision-making process that hasn’t been asked?
8. When did you begin to plan to attend college? ____________ (month/year)
9. How many colleges have you visited? ____________
10. Do you have a computer at home?
____ Yes, everyone in my home shares a computer ____ Yes, I have my own computer
____ No, we do not have a home computer
11. How much access do you have to a computer? (at home, school, a friend’s house, the library, etc.)
____ A lot ____ Some ____ None
12. What year are you in high school? ____ Senior ____ Junior ____ Sophomore
13. What is your ethnic group?
____ African American/Black ____ Middle Eastern
____ Asian American/Pacific Islander ____ Native American/American Indian ____ Hispanic/Latin American ____ White
____ Other (please specify) ________________________
Appendix 2
Emergent coding categories from survey analysis
Aid
Indication of some form of funding financial aid including scholarships, grants, money or reference to some other type of incentives.
Cost
Reference to expenses/costs (tuition, fees, housing).
Campus
Reference to physical campus (butNOTsize or location), including appearance/ attrac-tiveness, architecture, buildings, dorms/housing, and/or safety; also, helpfulness/
friendliness/impressions of school representatives, including students, staff, adminis-tration (NOTfaculty); also diversity.
Atmosphere
Reference to more social and/or amorphous elements of the school, i.e. the ‘feel’.
Faculty
Reference to faculty, teachers, professors.
Career preparation
References to opportunities to gain experience that will help students academically or in their future careers, including internships, co-ops, study abroad, job placement services, etc.
Location
Includes references to distance from student’s home, proximity to or identification of other points (cities, attractions), setting (rural/urban).
Miscellaneous
Responses that do not clearly fit into another category.
Organizations
Identification of social groups, athletics teams and other types of (non-academic) school sponsored groups or activities.
Outreach
Interpersonal outreach by schools through various on and off campus efforts including open houses, colleges fairs, high school visits/fairs, personal visits, interviews.
Academic Programs
Reputation
Reference to school’s status, prestige, quality (specific to schools,NOTprograms), cre-dentials, ranking.
Size
Reference to population of school, desire for small/large school, number of students, size of class, number of students per class, desire for small/large classes, and student/teacher ratio.
Student research
Attempts by students to proactively solicit information about a school.
School type
may not be copied or emailed to multiple sites or posted to a listserv without the copyright holder's express