Step-by-Step Analytical
Methods Validation and
Protocol in the Quality System
Compliance Industry
Introduction
Methods Validation: Establishing documented evidence that provides a high degree of assurance that a specific method, and the ancillary instruments included in the method, will consistently yield results that accurately reflect the quality characteristics of the product tested.
Method validation is an important requirement for any package of information submitted to international regula-tory agencies in support of new product marketing or clini-cal trials applications. Analyticlini-cal methods should be vali-dated, including methods published in the relevant pharma-copoeia or other recognized standard references. The suit-ability of all test methods used should always be verified under the actual conditions of use and should be well docu-mented.
Methods should be validated to include consideration of characteristics included in the International Conference on Harmonization (ICH) guidlines1, 2addressing the validation of analytical methods. Analytical methods outside the scope of the ICH guidance should always be validated.
ICH is concerned with harmonization of technical re-quirements for the registration of products among the three major geographical markets of the European Community (EC), Japan, and the United States (U.S.) of America. The recent U.S. Food and Drug Administration (FDA) methods validation guidance document,3-5as well as the United States Pharmacopoeia (USP),6both refer to ICH guidelines.
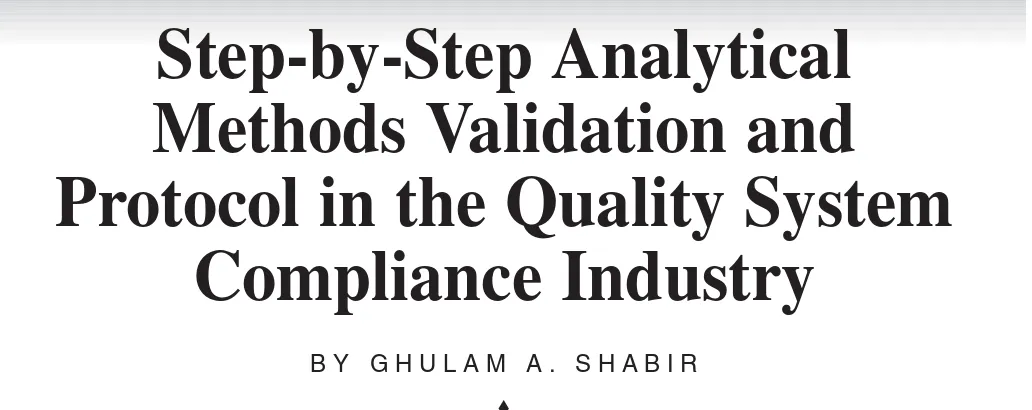
The most widely applied typical validation characteris-tics for various types of tests are accuracy, precision
(re-peatability and intermediate precision), specificity, detec-tion limit, quantitadetec-tion limit, linearity, range, and robustness (Figure 1). In addition, methods validation information should also include stability of analytical solutions and sys-tem suitability.7
Health Canada (HC) has also issued guidance on meth-ods validation entitled Acceptable Methods Guidance.8HC has been an observer of ICH, and has adopted ICH guide-lines subsequent to its reaching Step Four of the ICH process. An acceptable method predates ICH, and HC plans to revise this guidance to reflect current ICH termi-nology.
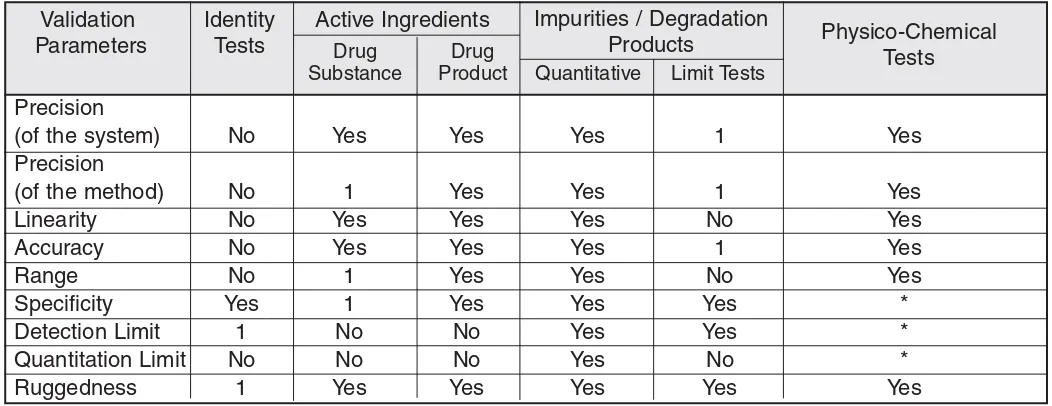
Figure 2shows the data required for different types of analysis for method validation. Where areas of the Accept-able Methods Guidanceare superseded by ICH Guidelines Q2A1and Q2B,2HC accepts the requirements of either the ICH or Acceptable Methods Guidance; however, for method validation, ICH acceptance criteria are preferred. HC’s Acceptable Methods Guidanceprovides useful guid-ance on methods not covered by the ICH guidelines (e.g., dissolution, biological methods), and provides acceptance criteria for validation parameters and system suitability tests for all methods.
HC has also issued templates recommended as an ap-proach for summarizing analytical methods and validation data ICH terminology was used when developing these tem-plates.
This paper suggests one technique of validating meth-ods. There are numerous other ways to validate methods, all
❖
equally acceptable when scientifically justified.
Prepare a Protocol
The first step in method validation is to prepare a proto-col, preferably written, with the instructions in a clear step-by-step format, and approved prior to their initiation. This approach is discussed in this paper. The suggested accep-tance criteria may be modified depending on method used,
required accuracy, and required sensitivity. (Note: Most of the acceptance criteria come from the characterization study.) Furthermore, some tests may be omitted, and the number of replicates may be reduced or increased based on scientifically sound judgment.
A test method is considered validated when it meets the acceptance criteria of a validation protocol. This paper is a step-by-step practical guide for preparing protocols and
per-Validation Assay Testing for Impurities Identification
Characteristics
Accuracy Yes Yes No No
Precision - Repeatability Yes Yes No No
Precision - Intermediate Yes1 Yes* No No
Precision
Specificity Yes Yes Yes Yes
Detection limit No No Yes No
Quantitation limit No Yes No No
Linearity Yes Yes No No
Range Yes Yes No No
Robustness Yes Yes No No
Quantitative Limit
Figure 1
___________________________________________________________________________
ICH, USP, and FDA Methods Validation Characteristics Requirements for Various Types of Tests* In cases where reproducibility has been performed, intermediate precision is not needed.7
Precision
(of the system) No Yes Yes Yes 1 Yes
Precision
(of the method) No 1 Yes Yes 1 Yes
Linearity No Yes Yes Yes No Yes
Accuracy No Yes Yes Yes 1 Yes
Range No 1 Yes Yes No Yes
Specificity Yes 1 Yes Yes Yes *
Detection Limit 1 No No Yes Yes *
Quantitation Limit No No No Yes No *
Ruggedness 1 Yes Yes Yes Yes Yes
Validation Parameters
Identity Tests
Active Ingredients Impurities / Degradation
Products Physico-Chemical
Tests
Drug Substance
Drug
Product Quantitative Limit Tests
Figure 2
____________________________________________________________________
Health Canada Methods Validation Parameter Requirements for Various Types of TestsDocument Approval Department /
Functional Area Name Signature Date
Technical Reviewer End Lab Management Health & Safety Quality Assurance Documentation Control (reviewed and archived by)
Document Approval
Summary Information
Organization name Site location
Department performing validation Protocol title
Validation number Equipment
Revision number
Summary Information
Project Name Signature Date
Controller
Project Controller
Revision History
Revision No. Date Description of change Author
Revision History
forming test methods validation with reference to High Performance Liquid Chromatography (HPLC) (use simi-lar criteria for all other instrumental test method valida-tion) in the quality system compliance industry.
Analytical Methods Validation Protocol
Approval Cover Page
of the validation:
Writing a Test Method Validation Protocol
Analytical method validations should contain the fol-lowing information in detail:
Purpose: This section provides a short description of what is to be accomplished by the study.
Project scope: Identify the test methods and which prod-ucts are within the scope of the validation.
Overview: This section contains the following: a gen-eral description of the test method, a summary of the char-acterization studies, identification of method type and vali-dation approach, test method applications and valivali-dation protocol, the intended use of each test method application, and the analytical performance characteristics for each test method application.
Resources: This section identifies the following: end user laboratory where the method validation is to be per-formed; equipment to be used in the method validation; software to be used in the method validation; materials to be used in the method validation; special instructions on han-dling, stability, and storage for each material.
Appendices: This section contains references, signa-ture, and a review worksheet for all personnel, their specific tasks, and the documentation of their training. Listings of all equipment and software necessary to perform the method validation should be found here along with document and materials worksheets used in the method validation and in the test method procedure(s).
1. Analytical Performance Characteristics Procedure
Before undertaking the task of methods validation, it is necessary that the analytical system itself be adequately designed, maintained, calibrated, and validated. All per-sonnel who will perform the validation testing must be properly trained. Method validation protocol must be agreed upon by the CFT and approved before execution. For each of the previously stated validation characteristics (Figure 1), this document defines the test procedure, doc-umentation, and acceptance criteria. Specific values are taken from the ICH, U.S. FDA, USP, HC, and pertinent literature as references. (See the References section at the end of this article for further definitions and explanations.)
1.1. Specificity
1.1.1. Test procedure
The specificity of the assay method will be investigated by injecting of the extracted placebo to demonstrate the absence of interference with the elution of analyte.
1.1.2. Documentation Print chromatograms.
1.1.3. Acceptance criteria
The excipient compounds must not interfere with the analysis of the targeted analyte.
1.2. Linearity
1.2.1. Test procedure
Standard solutions will be prepared at six concentra-tions, typically 25, 50, 75, 100, 150, and 200% of target concentration. Three individually prepared replicates at each concentration will be analyzed. The method of standard preparation and the number of injections will be same as used in the final procedure.
1.2.2. Documentation
Record results on a datasheet. Calculate the mean, stan-dard deviation, and Relative Stanstan-dard Deviation (RSD) for each concentration. Plot concentration (x-axis) ver-sus mean response (y-axis) for each concentration. Cal-culate the regression equation and coefficient of deter-mination (r2). Record these calculations on the datasheet.
1.2.3. Acceptance criteria
The correlation coefficient for six concentration levels will be ≥0.999 for the range of 80 to 120% of the target concentration. The y-intercept must ≤2% of the target concentration response. A plot of response factor versus concentration must show all values within 2.5% of the target level response factor, for concentrations between 80 and 120% of the target concentration.9,10 HC states that the coefficient of determination for active ingredi-ents should be ≥0.997, for impurities 0.98 and for bio-logics 0.95.8
1.3. Range
1.3.1. Test procedure
Linearity - Data Sheet Electronic file name:
5 (e.g.) 25
10 50
15 75
20 100
30 150
40 200
Equation for regression line = Correlation coefficient (r2) =
Concentration (mg/ml)
Concentration as % of Analyte Target
Peak Area (mean of three Injections)
Peak Area RSD (%)
Range - Data Sheet Electronic file name:
Record range:
Accuracy - Data Sheet Electronic file name:
Sample Percent
of Nominal (mean of three injections)
Amount of Standard (mg)
Recovery (%)
Spiked Found
1 75 (e.g.)
2 100
3 150
Mean SD RSD%
Repeatability - Data Sheet Electronic file name:
Injection No. Retention Time (min) Peak Area Peak Height
Replicate 1 Replicate 2 Replicate 3 Replicate 4 Replicate 5 Replicate 6 Replicate 7 Replicate 8 Replicate 9 Replicate 10 Mean
The precision data used for this assessment is the preci-sion of the three replicate samples analyzed at each level in the accuracy studies.
1.3.2. Documentation
Record the range on the datasheet.
1.3.3. Acceptance criteria
The acceptable range will be defined as the concentra-tion interval over which linearity and accuracy are ob-tained per the above criteria, and in addition, that yields a precision of ≤3% RSD.9
1.4. Accuracy
1.4.1. Test procedure
Spiked samples will be prepared at three concentrations over the range of 50 to 150% of the target concentration. Three individually prepared replicates at each concen-tration will be analyzed. When it is impossible or diffi-cult to prepare known placebos, use a low concentration of a known standard.
1.4.2. Documentation
For each sample, report the theoretical value, assay value, and percent recovery. Calculate the mean, stan-dard deviation, RSD, and percent recovery for all sam-ples. Record results on the datasheet.
1.4.3. Acceptance criteria
The mean recovery will be within 90 to 110% of the the-oretical value for non-regulated products. For the U.S. pharmaceutical industry, 100 ± 2% is typical for an assay of an active ingredient in a drug product over the range of 80 to 120% of the target concentration.9 Lower percent recoveries may be acceptable based on the needs of the methods. HC states that the required accuracy is a bias of ≤2% for dosage forms and ≤1% for drug sub-stance.8
1.5. Precision - Repeatability
1.5.1. Test procedure
One sample solution containing the target level of ana-lyte will be prepared. Ten replicates will be made from this sample solution according to the final method pro-cedure.
1.5.2. Documentation
Record the retention time, peak area, and peak height on the datasheet. Calculate the mean, standard deviation, and RSD.
1.5.3. Acceptance criteria
The FDA states that the typical RSD should be 1% for drug substances and drug products, ± 2% for bulk drugs and finished products. HC states that the RSD should be 1% for drug substances and 2% for drug products. For minor components, it should be ± 5% but may reach 10% at the limit of quantitation.8
1.6. Intermediate Precision
1.6.1. Test procedure
Intermediate precision (within-laboratory variation) will be demonstrated by two analysts, using two HPLC sys-tems on different days and evaluating the relative per-cent purity data across the two HPLC systems at three concentration levels (50%, 100%, 150%) that cover the analyte assay method range 80 to 120%.
1.6.2. Documentation
Record the relative % purity (% area) of each concentra-tion on the datasheet.
Calculate the mean, standard deviation, and RSD for the operators and instruments.
1.6.3. Acceptance criteria
The assay results obtained by two operators using two instruments on different days should have a statistical RSD ≤2%.9, 10
1.7. Limit of Detection
1.7.1. Test procedure
The lowest concentration of the standard solution will be determined by sequentially diluting the sample. Six replicates will be made from this sample solution.
1.7.2. Documentation
Print the chromatogram and record the lowest detectable concentration and RSD on the datasheet.
1.7.3. Acceptance criteria
of a number of blank samples and then multiply this num-ber by two to estimate the signal at the limit of detection.
1.8. Limit of Quantitation
1.8.1. Test procedure
Establish the lowest concentration at which an analyte in the sample matrix can be determined with the accuracy and precision required for the method in question. This value may be the lowest concentration in the standard curve. Make six replicates from this solution.
1.8.2. Documentation
Print the chromatogram and record the lowest quantified concentration and RSD on the datasheet. Provide data that demonstrates the accuracy and precision required in the acceptance criteria.
1.8.3. Acceptance criteria
The limit of quantitation for chromatographic methods has been described as the concentration that gives a sig-nal-to-noise ratio (a peak with height at least ten times as high as the baseline noise level) of 10:1.2HC states that the quantitation limit is the best estimate of a low
con-centration that gives an RSD of approximately 10% for a minimum of six replicate determinations.8
1.9. System Suitability
1.9.1. Test procedure
System suitability tests will be performed on both HPLC systems to determine the accuracy and precision of the system by injecting six injections of a solution contain-ing analyte at 100% of test concentration. The followcontain-ing parameters will be determined: plate count, tailing fac-tors, resolution, and reproducibility (percent RSD of re-tention time, peak area, and height for six injections).
1.9.2. Documentation
Print the chromatogram and record the data on the datasheet
1.9.3. Acceptance criteria
Retention factor (k): the peak of interest should be well resolved from other peaks and the void volume; gener-ally k should be ≥2.0. Resolution (Rs): Rs should be ≥2 between the peak of interest and the closest eluted peak, Intermediate Precision - Datasheet Electronic file name:
Relative % Purity (% area)
Instrument 1 Instrument 2
Operator 1, day 1 Operator 1, day 2 Operator 2, day 1 Operator 2, day 2 Mean (Instrument) Mean (Operators)
RSD% S1 + S1 S2 + S2 S3 + S3
Instruments Operators
Sample S1 S2 S3 S1 S2 S3
(50%) (100%) (150%) (50%) (100%) (150%)
Limit of Detection - Data Sheet Electronic file name:
Record sample data results: (e.g., concentration, S/N ratio, RSD%)
Limit of Quantitation - Data Sheet Electronic file name:
Injection precision for
retention time (min) RSD ≤1%
Injection precision for
peak area (n = 6) RSD ≤1%
Injection precision for
peak height RSD ≤1%
Resolution (Rs) Rs = ≥2.0
USP tailing factor (T) T = ≤2.0
Capacity factor (k) K = ≥2.0
Theoretical plates (N) N = ≥2000
which is potentially interfering (impurity, excipient, and degradation product). Reproducibility: RSD for peak area, height, and retention time will be 1% for six injec-tions. Tailing factor (T): T should be 2. Theoretical plates (N): ≥2000.3
1.10. Robustness
As defined by the USP, robustness measures the capac-ity of an analytical method to remain unaffected by small but deliberate variations in method parameters. Robustness provides some indication of the reliability of an analytical method during normal usage.
Parameters, which will be investigated, are percent or-ganic content in the mobile phase or gradient ramp, pH of the mobile phase, buffer concentration, temperature, and injection volume. These parameters may be evalu-ated one factor at a time or simultaneously as part of a factorial experiment.
The chromatography obtained for a sample containing representative impurities, when using modified parame-ter(s), will be compared to the chromatography obtained using the target parameters. The effects of the following changes in chromatographic conditions will be deter-mined: methanol content in mobile phase adjusted by ± 2%, mobile phase pH adjusted by ± 0.1 pH units, column
temperature adjusted by ± 5˚C. If these changes are within the limits that produce acceptable chromatography, they will be incorporated in the method procedure.9, 10
2. Appendices
List all appendices associated with this protocol. Each appendix needs to be labeled and paginated separately System Suitability – Data Sheet Electronic file name:
System Suitability Parameter
Acceptance Criteria
Results Criteria Met/
Not Met
HPLC 1 HPLC 2
Robustness - Data Sheet Electronic file name:
Explain / record sample data:
Article Acronym Listing
CFT: Cross-Functional Team EC: European Community
FDA: Food and Drug Administration HC: Health Canada
HPLC: High Performance Liquid Chromatography
ICH: International Conference on Harmonization
RSD: Relative Standard Deviation U.S.: United States
Appendix Document Title Total Pages No.
Analyst Name Dept. Validation Protocol Analyst Date
Activity Reference Signature
Comments:
Completed By: Signature: Date:
Appendix 1
______________________________________________________________________________
Method Validation Personnel Signature and Review WorksheetEquipment Last Next Software Validation
Name/Module # Calibration Date Calibration Date Name and Version Reference
Comments:
Completed By: Signature: Date:
Appendix 2
______________________________________________________________________________
Equipment and Software Used in Method Validation WorksheetDocument Edition/Version Material Name Supplier/ Expiration
Name/Ref. No. Number Lot Number Date
Comments:
Completed By: Signature: Date:
from the body of the document. The following informa-tion must be found on every page of each appendix: val-idation protocol number; valval-idation protocol title; ap-pendix number (e.g., 1, 2, 3, … or A, B, C, …); and page X of Y. ❏
Acknowledgements
I thank Abbott Laboratories and MediSense for permis-sion to publish this article. I also thank Dr. Alison Ingham (Health Canada) for his comments on the text.
About the Author
Ghulam Shabir is a Principal Scientist at Abbott Laboratories, MediSense UK. His group is respon-sible for materials characterization, analytical meth-ods development, and validation and equipment qualification. Ghulam is a Fellow of the Institute of Quality Assurance and a Companion of the Institute of Manufacturing with 17 years of broad-based ex-perience in the areas of production, quality control,
quality assurance, in-process control, R&D, and val-idation in the pharmaceutical industry. Ghulam has received many technical excellence industrial awards as well as academic awards for authoring ‘best scientific papers.’ Ghulam’s work has ap-peared in many publications. He has given several presentations at international conferences as well as having organized and moderated at sympo-siums. He holds a Master’s Degree in Chemistry and Pharmaceutical Sciences. He can be reached by phone at 44-1993-863099, by fax at 44-1235-467737, or by e-mail at [email protected].
References
1. International Conference on Harmonization (ICH), Q2A: Text on Validation of Analytical Procedures, March 1995. 2. International Conference on Harmonization (ICH), Q2B:
Val-idation of Analytical Procedures: Methodology, May 1997. 3. U.S. Center for Drug Evaluation and Research, Reviewer Guidance: Validation of Chromatographic Methods, Novem-ber 1994.
Appendix 3
______________________________________________________________________________
Document and Materials Used in Method Validation WorksheetComplete Pre-protocol Execution
Appendix 4
_____________________________________________________________________________
Analytical Test Method Procedure4. U.S. FDA, Guidance for Submitting Samples and Analytical Data for Methods Validation, Rockville, Md., USA, Center for Drugs and Biologics, Department of Health and Human Services, February 1987.
5. U.S. FDA DHHS, 21 CFR Parts 210 and 211, Current Good Manufacturing Practice of Certain Requirements for Finished Pharmaceuticals, Proposed Rule, May 1996. 6. Validation of Compendial Methods, <1225>, U.S.
copoeia 26-National Formulary 21, United States Pharma-copeial Convention, Rockville MD, 2003.
7. U.S. FDA, Guidance for Industry: Analytical Procedures and Methods Validation: Chemistry, Manufacturing and Controls Documentation, August 2000.
8. Drugs Directorate Guidelines, Acceptable Methods, Na-tional Health and Welfare, Health Protection Branch, Canada, July 1994. (This guidance is available from HC as a print copy, but is soon to be released on the website http://www.hc-sc.gc.ca/hpfb-dgpsa/tpd-dpt/).