13 January 2003
Some Empirical Evidence on New Regional Taxes and Charges in Indonesia
Blane D. Lewis∗
Research Triangle Institute, North Carolina, USA
Summary: This paper estimates that regional governments created just less than 1,000 new taxes and charges during the run up to and through fiscal year 2001.The available evidence indicates that about 40 percent of the newly formed revenue instruments were levied on goods or factors in the primary sector. An estimated 60 percent of the new taxes and charges were implemented directly by regional governments—that is, without central review and, therefore, in direct contradiction to law. Regional governments typically argue that they produce new taxes because of fiscal need. The empirical examination in this paper provides limited support for this claim, although weaknesses in the data prevent a firm conclusion on the matter. Revenue generated by new taxes and charges would appear to be negligible; even under the most optimistic of assumptions, any increase in regional own-source revenues that may have resulted from the creation of new taxes and charges would be very small relative to overall budgets. The instruments that regional governments have at their disposal—both traditional and new—are inadequate to the task of producing much tax revenue. Without access to more substantial tax bases, regional governments will remain unsuccessful in realizing significant own-source revenues and fiscal decentralization in Indonesia will continue to be an unbalanced affair.
1. Introduction and Background
It is widely recognized that Indonesia’s two-year-old experiment in fiscal decentralization has been very uneven in its approach to the assignment of regional expenditures and revenues. While the decentralization of service responsibility to sub-national governments has been significant, public revenues remain highly centralized. At the end of fiscal year 2001 (the first year of program implementation), regional governments accounted for approximately 30 percent of total public expenditures but collected only around five percent of all government tax revenues (Ministry of Finance, 2002). Although there is almost ways some fiscal
imbalance in the assignment of expenditures and revenues to sub-national units of governments in the context of decentralization programs, the extent of such in Indonesia would appear to be quite pronounced.
Among other things, the large fiscal imbalance in Indonesia suggests an important potential role for intergovernmental transfers. And transfers have indeed become significant in regional government budgets under decentralization. In the aggregate, various new revenue sharing and grant programs accounted for over three-quarters of total sub-national government revenues in fiscal year 2001. Own-source revenues make up most of the residual in regional budgets, approximately 15 percent of total regional fiscal resources.1
∗ The author is currently senior adviser to the Ministry of Finance (MOF) under a project financed by
the United States Agency for International Development (USAID). The views expressed here are those of the author and should not be attributed to either MOF or to USAID. The author would like to thank Paul Smoke for discussions, Mira Kestari and Treena Wu for research assistance, and Regional Autonomy Watch and the Directorate General of Fiscal Balance/MOF for access to data.
1See Lewis (2001) and Lewis (2002) for analyses of the current system of intergovernmental transfers
Sub-national units of government in Indonesia comprise provinces and districts (rural and urban local governments—kabupaten and kota). Currently, provinces have at least some authority over taxes related to motor vehicles, change of title of motor vehicles, fuel, and ground water extraction and use. Tariffs over these taxes are set at uniform rates across the country by the central government. Local governments exercise control over taxes concerning hotels, restaurants, entertainment, advertisement, street lighting, some (“class C”) mineral exploitation, and parking. Kabupaten and kota governments control the relevant tax tariffs below centrally specified ceilings.2 Both provinces and kabupaten/kota may collect user charges and fees of various sorts.
Regarding the recent assignment of regional government revenues, many observers have taken Indonesian policy-makers to task both for what they did as well as for what they did not do but should have. On the latter count, most analysts have argued that the center should have devolved to sub-national units at least a modicum of control over some more significant source(s) of revenue, such as the property tax and/or the personal income tax (the latter via the application of a regional supplemental rate on the national tax base), for example (Alm, Aten, and Bahl, 2001). In the event, control over property tax policy and/or administration was not decentralized.3 And neither was any other major source of revenue awarded to sub-national governments under decentralization. Instead, Indonesian policy-makers opted merely to expand the bases of some of the regions’ traditional taxes, as listed above4. In addition, and most importantly for the present purposes, the central government also decided to allow regional governments to create their own taxes and charges. More specifically, under certain conditions, provincial governments are now permitted to create new charges and
kabupaten/kota may establish both new taxes and charges. It is this authority to establish new revenue raising instruments at the regional level that has generated such disapproval among many analysts.
By law, regional governments must persuade their citizens and parliaments that the new taxes and/or charges that they wish to establish are needed before they can be formally adopted.5 And sub-national units must also convince the central government that the new revenue instruments satisfy certain “good tax” criteria. Central government provided the regions with such standards in the context of the law that gave the latter the authority to create new revenue instruments in the first instance. In addition, the law requires regional governments to submit their newly established taxes and charges to the center for formal review within a period of 15 days after the tax or charge has been ratified by regional by-law.6 The central government has the right to cancel any new revenue instrument that it judges unsatisfactory vis-à-vis the stated criteria; if the center decides to reject a particular new tax or charge it
2
By law, provinces must share 30 percent of the motor vehicle-based taxes and 70 percent of the fuel and ground water taxes with kabupaten/kota. The latter must share 10 percent of their total own-source tax revenues with villages.
3See Lewis (forthcoming) for an overview of the property tax in Indonesia and an examination of the
central government’s performance in administering the tax. 4
In addition, the tax on ground and surface water extraction and use was re-assigned from local governments to provinces. The only ostensibly new source of revenue for sub-national governments is the kabupaten/kota parking tax; this tax was, however, already being levied by many local
governments before current law came into effect..
5 Law No. 34/2000 regarding the Revision to Law 18/97 regarding Regional Taxes and Charges.
6The central government monitoring and review team comprises officials from the Ministries of
must do so within a period of one month after it has received the by-law from the regional government in question.
What has been the effect of regions’ recently awarded authority to establish new taxes and charges? The conventional wisdom in Indonesia appears to be that regional governments have responded rather too aggressively in creating new tax and charge instruments. And the central government has also been roundly blamed for being lax in its review of the new instruments and for allowing an excessive number of such to stand. Many observers have argued that the newly created revenues are mostly inappropriate and that they have had a significant and harmful effect in one respect or another (Ray, 2001; SMERU, 2001).
In response to criticisms regarding their alleged overly assertive formation of new taxes and charges, regional governments have mostly argued that they established the new revenues simply to assist in meeting new expenditure requirements under decentralization. Many regional officials in Indonesia complain that basic own-source revenues and
intergovernmental transfers together have proved inadequate in amount to fund their now augmented service responsibilities. Thus, regional governments claim that their motivation for creating new taxes and charges is a legitimate one of fiscal need.7
Of course, whether the new taxes and charges have actually resulted in substantial increases in regional own-source revenues is an altogether different question. Many analysts have noticed that own-source revenues have indeed increased under decentralization. And at least a few have posited that this increase in regional revenues is a direct result of newly formed taxes and charges. Obviously, this need not necessarily be the case; the rise in regional own-revenues might just as well have resulted, in part or in full, from a more intensive use of traditional own-sources.
This paper examines some of the issues raised above regarding newly created regional taxes and charges in Indonesia. The investigation has three specific purposes. First, the paper assesses the evidence regarding the number and kind of new taxes and charges established by regional governments. Second, the paper examines regional governments’ claim that fiscal need is a primary motivating force behind the creation of new revenue instruments. And third, the paper attempts to determine the revenue impact of the newly created regional taxes and charges.
The paper does not address equity and efficiency concerns related to new regional taxes and charges. Such issues merit investigation, of course. But an examination of the incidence or allocative effects of the new regional revenue instruments is beyond the scope of this analysis. We leave these important questions to future research.
The rest of the paper proceeds as follows. First, a general profile of regional government revenues before and after decentralization is presented. Second, the data employed in the paper are described and some preliminary information on the number and type of newly created regional taxes and charges is provided. Third, a simple econometric model for count data is developed and used to explore the extent to which the establishment of new local taxes
7
and charges is a function of fiscal need, among other possible determinants. In addition, this section of the paper derives a consistent estimate of the total number of new sub-national taxes created across all of Indonesia. Fourth, some empirical evidence regarding the revenue impact of new local taxes and charges is offered. Finally, the paper summarizes the results and derives some conclusions relevant for the continuing development of fiscal
decentralization policy in Indonesia.
2. Regional Government Revenues Before and After Decentralization
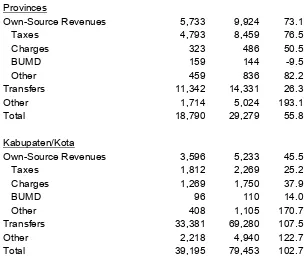
Table 1 provides a snapshot of regional government revenues just before and after fiscal decentralization began implementation. Apparently, both provinces and kabupaten/kota have realized quite significant increases in revenues under the government’s decentralization program. Provincial revenues rose by 56 percent while those for kabupaten and kota increased by 103 percent. For provinces, additions to own-source revenues were most
significant while increases in transfers played the most important role for kabupaten and kota. As the table shows, provincial own-source revenues increased by 76 percent and transfers grew by 26 percent. Kabupaten and kota own-source revenues and transfers expanded by 46 and 108 percent, respectively. The relevant point in the current context is that both provinces and kabupaten/kota experienced noteworthy additions to their own-source revenues under decentralization. An important question considered below is the extent to which newly created taxes and charges contributed to those increases.
Table 1: Regional Government Revenues (Rp Bln)
Percent
FY 2000* FY 2001 Increase Provinces
Own-Source Revenues 5,733 9,924 73.1
Taxes 4,793 8,459 76.5
Charges 323 486 50.5
BUMD 159 144 -9.5
Other 459 836 82.2
Transfers 11,342 14,331 26.3
Other 1,714 5,024 193.1
Total 18,790 29,279 55.8
Kabupaten/Kota
Own-Source Revenues 3,596 5,233 45.5
Taxes 1,812 2,269 25.2
Charges 1,269 1,750 37.9
BUMD 96 110 14.0
Other 408 1,105 170.7
Transfers 33,381 69,280 107.5
Other 2,218 4,940 122.7
Total 39,195 79,453 102.7
3. Data Sources and Some Preliminary Results
We draw on two main sources of information for this analysis. The first is a data set compiled by Regional Autonomy Watch (Komite Pemantauan Pelaksanaan Otonomi Daerah—
KPPOD). The KPPOD data focus on sub-national government by-laws that have some relevance to the business and economic environment, including those related to regional taxation, among other things. The by-laws included in the data set were issued, for the most part, during the period from FY 2000 through mid-FY 2002. In total, the data set comprises 3,068 entries and covers all 30 provinces and 231 kabupaten/kota.
The second information source is a comprehensive Ministry of Finance listing of regional government tax and charge by-laws reviewed by the central government over the same period. The central government data set includes by-laws related to both positive-list taxes (i.e. provincial and kabupaten/kota “traditional” taxes, as itemized in the introduction above) as well as newly created taxes and charges. The number of regional government by-laws enumerated in the MOF data set is 1,354. This list also provides information on the outcome of the review process, that is, whether or not the particular revenue instrument under
consideration was canceled or allowed to stand.
The above two sets of information were used to produce an inventory of all new (as opposed to traditional) tax and charge by-laws issued during the run up to and through FY 2001. Each entry in the data set includes the name of the by-law, the issuing regional government, the date of issuance, whether or not it was reviewed by the central government, and, if it was reviewed by the center, whether it was canceled or approved. These data cover all 30 provinces 231 kabupaten/kota8. Table 2 summarizes the pertinent information.
Table 2 Summary of KPPOD and Ministry of Finance Data
Provinces Kabupaten/Kota
(30) (231)
Issued Tax and Charge Perda 65 916
Perda Reviewed by Center 27 406
Perda Canceled by Center 10 113
New Taxes and Charges 55 803
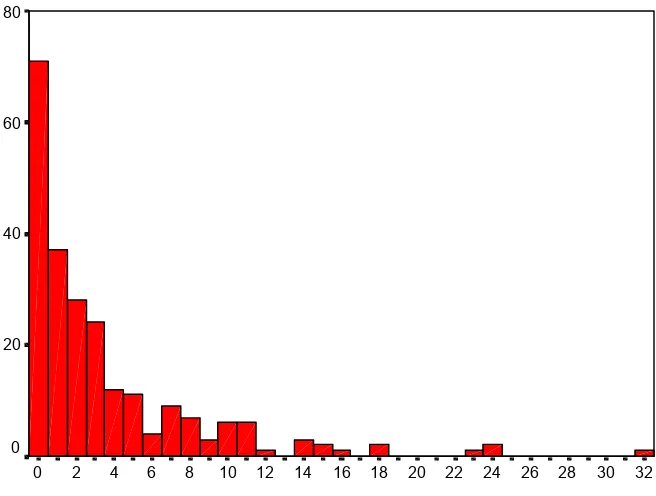
The figures in Table 2 mask a significant amount of variation across regional governments, of course. At the provincial level, sixteen governments did not create any new taxes and charges at all; of the fourteen that did, the number created ranged from one to 10. Among the 231 kabupaten and kota covered, 71 places issued no new tax and charge by-laws. Of the 160 local governments in the sample that created at least one new revenue instrument, the total number produced ranged from one to 32. The complete size distribution of newly created taxes and charges for provinces can be found in Figure 1 and that for the sample of kabupaten/kota is shown in Figure 2.
Figure 1: Size Distribution of New Provincial Taxes and Charges, FY 2000-FY 2001 (30 Provinces)
Number of New Taxes and Charges
10 9 8 7 6 5 4 3 2 1 0 20
10
0
Figure 2: Size Distribution of New Kabupaten and Kota Taxes and Charges, FY 2000-FY 2001 (231 Kabupaten/Kota)
Number of New Taxes and Charges
32 30 28 26 24 22 20 18 16 14 12 10 8 6 4 2 0 80
60
40
20
0
Table 3: New Taxes and Charges by Location (30 Provinces and 231 Kabupaten/Kota)
Propinsi Percent Kab/Kota Percent
Number of Total Number of Total
Sumatera 20 36.4 301 37.5
Java-Bali 8 14.5 244 30.4
Kalimantan 6 10.9 71 8.8
Sulawesi 12 21.8 125 15.6
Eastern 9 16.4 62 7.7
Total 55 100.0 803 100.0
We consider two different typologies of newly created taxes and charges. The first relates to whether the new revenue instrument is a tax or a charge (or something else). Table 4 provides some information on the tax or charge nature of new revenue instruments created by
(covered) regional governments during the first year of fiscal decentralization. As noted above, provincial governments were by law only allowed to create new charges. As such, not surprisingly, all new revenue instruments of provinces are charges. Kabupaten/kota are allowed to create both new taxes and charges. As the table shows, the vast majority of new revenue instruments created by kabupaten and kota were charges—90 percent of the total. Only 49, or six percent of the total, were taxes. Another 29, or four percent, were “other”. These are mostly “contributions”—essentially forced payments to local governments by businesses of one type or another. In general, care should be taken in interpreting these figures. Experience shows that sometimes revenues identified as charges by local governments are really taxes.
Table 4: Number of New Taxes and Charges by Type (30 Provinces and 231 Kabupaten/Kota)
Provinces Percent Kab/Kota Percent
Taxes 0 0.0 49 6.1
Charges 55 100.0 725 90.3
Other 0 0.0 29 3.6
Total 55 100.0 803 100.0
Primary 23 41.8 327 40.7
Secondary 0 0.0 87 10.8
Distribution 10 18.2 95 11.8
Services 11 20.0 168 20.9
Govt Admin 6 10.9 87 10.8
Other 5 9.1 39 4.9
Total 55 100.0 803 100.0
It may be useful to stress the point that while the data presented above cover all provinces in Indonesia, the figures for districts and municipalities are based just on the sample of 231 places. Clearly, this sample of local governments was not randomly drawn. As such, the results presented above may not be representative of districts and municipalities, in general. A method that may be used to adjust for the non-random nature of the data is considered next.
4. Explaining and Estimating the Number of New Taxes and Charges
A Simple Empirical Model to Explain the Number of New Taxes and Charges
The nature of the questions explored in this paper regarding the number of new taxes and charges suggests the use of an empirical model for count data. The Poisson model is the standard technique for analyzing such data.9 The most basic Poisson model is often criticized for its assumption that the mean and variance of the dependent variable under consideration (i.e. the count) are equal. A standard test for “overdispersion” indicates that this assumption is indeed weak in the current case.10 Below, we employ a Poisson model with “normal heterogeneity” to account for the evident overdispersion. In addition, we must also adjust for the fact that the sample of kabupaten/kota used in the analysis has not been drawn in a random manner. We use a “sample selection” model in order to make the necessary corrections. See Greene (2000) for a description of the basic methods.
As noted above, regional governments typically argue that they create new taxes and charges because they possess insufficient revenues to cover required expenditures. If this were true, then one might expect that the number of taxes and charges that regional governments create would be positively related to their expenditure requirements and/or negatively related to the resources that they have at their disposal, all other things being equal11. More specifically, it
9See Cameron and Trivedi (1998) for a recent review of econometric models based on count data.
10There are a number of such tests. The one used here is based on simple regression techniques. See
Cameron and Trivedi (1990) and Greene (1998) for a description of the method.
11
might be argued that the number of new revenue instruments that various regional
governments formed in the run up to and during fiscal year 2001 might be positively related to their relative expected expenditure requirements and negatively related to their relative expected revenues for the fiscal year.
Of particular concern to regional governments are expenditures on staff. As such, expected staff expenditures for FY 2001 are used to proxy expected expenditure requirements in the model here. Actual salary expenditures for FY 2001 were pretty well known to local governments before the fiscal year started (at least before increases in basic civil servant salaries were mandated) and therefore expected staff expenditure is defined to be equal to actual staff expenditure for the year. It is anticipated that, all other things being equal, larger expected staff expenditure requirements would lead to a greater number of new taxes and charges.
Local revenues comprise those from own-sources and transfers. Local governments typically base expectations regarding the amount of own-source revenues available in any fiscal year as a function of last year’s revenues. So their expected own-source revenues for FY 2001 would have been based on such revenues from FY 2000. Actual revenues from transfers for FY 2001 were known in approximate amount at least somewhat in advance. Therefore, total expected local government revenue is defined to be equal to (annualized) own-source
revenues from FY 2000 (plus an extra 10 %, as per common local government practice) plus actual FY 2001 transfers. It is hypothesized that local governments create relatively fewer new taxes and charges as expected revenue increases, all other things being equal.
Other variables used as regressors in the model include those for gross regional development product and poverty. It is expected that places with relatively larger gross regional output might create a greater number of new taxes and charges, ceteris paribus. And it is anticipated that local governments with relatively higher levels of poverty might create a smaller number of taxes and charges, all other things being equal.
In addition to the above, dummy variables for municipality status (KOTA) and for geographic region are included in the regression. Many observers in Indonesia seem to believe that municipalities have been more aggressive in creating new taxes and charges than kabupaten have been and that hypothesis is tested here. Regarding geographic region, a dummy variable is included to indicate whether the districts/municipalities is on Java-Bali (JAVA = 1) or not (JAVA = 0). Local governments in the sampled places on Java-Bali appear to have produced a fewer number of new taxes and charges than other sub-national governments (in per capita terms). The hypothesis that this holds in the more comprehensive model is considered here.
The variables described above are entered into the simple sample selection model for counts described above. Per capita log forms are used for expected staff expenditures (STAFF), not the most interesting measure to examine. Still, the number of new taxes and charges created in response to need might be relevant if individual instruments produce small, approximately equal amounts of revenue across places (in per capita terms), such as might be the case with nuisance taxes, for example. In any case, there are no data, as of yet, on the amount of revenue produced by
expected fiscal capacity (FISK), and gross regional development product (GRDP) and the poverty variable is operationalized as the incidence of poverty (POVERTY). Dummy variables are entered into the model as described above. The model can be consistently estimated either by two-step non-linear least squares procedures as in Terza (1994) and Greene (1994) or via full information maximum likelihood (FIML) techniques as in Greene (1998). All three estimating techniques were tried here with reasonably similar outcomes, although FIML estimation of the model seems to produce a somewhat better fit. The results reported just below are those based on the FIML methods.
Table 5: Regression Results
Panel A: Parameters of Probit Selection Model
Variable Coefficient SE t value
Constant 0.209 0.613 0.341
STAFF 0.141 0.069 2.060 **
FISK -0.134 0.064 -2.099 **
GRDP 0.042 0.041 1.022
POVERTY -0.004 0.002 -1.991 **
KOTA 0.132 0.081 1.622
JAVA -0.095 0.065 -1.460
Panel B: Parameters of the Poisson Probability
Variable Coefficient SE t value
Constant 5.733 6.135 0.935
STAFF 0.648 0.544 1.191
FISK -1.110 0.746 -1.487
GRDP 0.165 0.473 0.349
POVERTY -0.027 0.026 -1.058
KOTA -0.997 0.762 -1.309
JAVA -1.975 0.568 -3.480 **
Panel C: Combined Effect
Variable Coefficient SE t value
STAFF 0.790 0.549 1.438
FISK -1.244 0.750 -1.658 *
GRDP 0.207 0.476 0.435
POVERTY -0.031 0.026 -1.187
KOTA -0.865 0.767 -1.128
JAVA -2.071 0.574 -3.608 **
Chi-Squared Stat = 550.72737 Significance Level = 0.00000
* and ** indicate that the coefficient is statistically significant at the 0.05 and 0.10 levels, respectively.
Source: Author's own calculations.
latter inference12. In addition, the output reveals that, as expected, geography is an important determinant of the number of new revenue instruments created; apparently, local
governments on Java-Bali (JAVA) have indeed produced relatively fewer new taxes and charges than those places in other areas of the country, all things considered. None of the other variables considered is important in explaining the number of new revenue instruments.
An Estimate of the Total Number of New Taxes and Charges Created
An important reason for specifying and estimating the above model in the context of this paper is to derive a consistent estimate the mean level of new taxes and charges created by local governments. The sample selection techniques employed here adjust for the sample’s non-random character. The method corrects for the ‘truncation bias’ in the distribution of the number of new taxes and charges that results from the non-random sampling. The methods provide an estimate of the mean of the truncated distribution, that is, the mean that would have obtained if the sample had been randomly drawn from the population.
As can be deduced from Table 2 above, the mean number of newly created taxes and charges for the non-random sample of 231 districts/municipalities is 3.476. The sample selection methods estimate the mean of the number of new taxes created in the truncated distribution to be 2.804. This latter estimate would suggest that approximately 942 (2.804 times 336
regions) new taxes and charges might have been created in all districts/municipalities in the run up and through fiscal year 2001. As such, the information presented in Table 2 can be revised and augmented as follows.
Table 6: Estimated Number of New Taxes and Charges through FY 2001
Provinces Kabupaten/Kota Total
(30) (336)
Issued Tax and Charge Perda 65 1055 1120
Perda Reviewed by Center 27 406 433
Perda Canceled by Center 10 113 123
New Taxes and Charges 55 942 997
Percent Reviewed of Issued 41.5 38.5 38.7
Percent Canceled of Reviewed 37.0 27.8 28.4
As the table shows, an estimated total of 1,120 new taxes and charge by-laws (Perda) were issued by these regional governments up through FY 2001, including 65 for provinces and 1,055 for kabupaten/kota. Of these only 433, or about 39 percent of the total, were actually reviewed by the central government. The remainder were issued directly by regional
governments. Of those reviewed by the center, 123, or 28 percent of the total, were rejected as unsuitable for one reason or another. In total, through the end of fiscal year 2001, as many as 997 new taxes and charges may have been created by sub-national governments and not rejected by the center.
As noted above, the central government has been criticized by many observers for being lax in its role of reviewing regional by-laws. While it may be true that the center has been either
12 The lack of clear and significant results for these two variables may be at least partly a function of
careless or too lenient in its review and evaluation of submitted regional tax and charge by-laws, the more important point would seem to be that the center has not even had the chance to appraise the majority of newly created regional taxes and charges. Regional governments have, for the most part, acted unilaterally (and in direct contradiction to law) in creating new taxes and charges. It would appear that the central government has lost control of the
monitoring process to a rather significant degree.
5. Revenue Impact of New Taxes and Charges
This section of the paper considers the revenue impact of new taxes and charges. Ideally, this issue would be explored directly by examining the actual revenue generated by newly created taxes and charges across regional governments. Unfortunately, comprehensive revenue data on individual regional tax and charge instruments are not available. So, we are forced to employ second-best methods. We assess the extent to which the aggregate increase in regional government own-source revenues between fiscal years 2000 and 2001 is a function of revenue generated by regional governments which created new taxes and charges.
Table 7 provides information on the number, population, and increases in own-source revenue (from taxes, charges and other sources) of regional governments which did and did not create new taxes and charges, respectively. The table shows that provincial governments that created new taxes and charges, and which account for about 40 percent of the total population, account for only 14 percent of the total increase in own-source revenues between the two fiscal years in question. Covered kabupaten/kota that created new taxes and charges, and which make up about 70 percent of the covered population, account for about two-thirds of the total increase in covered local government own-source revenues. These figures suggest that new taxes and charges need not be that important in generating additional revenue.
Moreover, it is clear that any revenue generated by new regional taxes and charges would be small relative to total regional revenues. Assume for a moment that all revenue increases of issuing regional governments was a function of new taxes and charges. Under this
implausible assumption, the total new tax and charge revenue would have constituted just eight percent of issuing provinces’ total budgets and just under three percent of issuing kabupaten/kota total budgets. Since not all increases are due to new taxes and charges, these figures exaggerate the importance of new tax and charge revenue. It is hard to escape the conclusion that the issuance of new taxes and charge probably has not mattered much to the generation of own-source revenues, either in the aggregate, or in relation to overall regional government budgets.
The conclusion that new regional taxes and charges don’t produce much revenue is not really very surprising. As has been noted elsewhere (SMERU, 2001), many of the “new” taxes and charges created by regions under fiscal decentralization are merely those that existed prior to the reforms embodied in Law 18 of 1997. It is well known that many of those earlier taxes and charges generated very little revenue—this was, in fact, one of the arguments
Table 7: Number, Population, and PAD Increases for Perda Issuing and Non-Issuing Regional Governments (Rp Bln)
All Issuing Percent of Non-Issuing Percent of
Provinces Provinces Total Provinces Total
Number 30 14 46.7 16 53.3
Population (000) 203,528.76 83,129.17 40.8 120,399.59 59.2
PAD Inc (FY00-FY01) 4,206.45 608.88 14.5 3,597.56 85.5
Taxes 3,666.25 555.66 15.2 3,110.59 84.8
Charges 163.23 1.12 0.7 162.10 99.3
Other 376.97 52.10 13.8 324.87 86.2
All Issuing Percent of Non-Issuing Percent of
Kab/Kota Kab/Kota Total Kab/Kota Total
Number 231 160 69.3 71 30.7
Population (000) 151,237.41 105,455.67 69.7 45,781.75 30.3
PAD Inc (FY00-FY01) 1,307.72 874.43 66.9 433.29 33.1
Taxes 437.28 253.22 57.9 184.07 42.1
Charges 403.18 297.29 73.7 105.89 26.3
Other 456.78 322.03 70.5 134.75 29.5
6. Summary and Conclusions
Regional governments have been criticized for creating too many new taxes and charges under decentralization. And central government has been taken to task for giving sub-national governments the authority to create new revenue instruments in the first instance and for approving the implementation of too many new taxes and charges in the second. Many of the new regional taxes and charges have been judged as inappropriate by one standard or
another.13
Central government’s overall culpability in the creation of unsuitable regional taxes and charges is unknown. What is apparent, however, is that the center has only had the chance to review less than 40 percent of the new taxes and charges that have been created by sub-national governments. Regional governments have implemented the bulk of the new revenue instruments unilaterally. It may be true, of course, that the center has not adequately
evaluated those new taxes and charges it has considered but the larger point would appear to be that it seems to have lost control of the legal review process itself to a rather significant degree.
Regional governments have, in fact, created many new instruments. During the run-up to and through fiscal year 2001, provinces and kabupaten/kota created a total of 55 and (an
13As noted in the introduction, it has not been the intention of this paper to evaluate the newly created
estimated) 942 new taxes and charges, respectively. For both provinces and kabupaten/kota the main focus of new taxes and charges has been on primary sector (agriculture, livestock, fisheries, forestry, and mining) and the evidence offered above indicates that over 40 percent of the new revenue instruments are levied on goods or factors in that sector. New taxes and charges in services and the distribution sector (trade and transportation) have been of secondary importance. New taxation of the secondary sector—manufacturing and construction and the like—has been relatively insignificant overall.
Whether regional governments have created too many new taxes and charges is, in some sense, an arbitrary question. In any case, regional governments’ response to this criticism is that they have created new instruments because they are in need of greater fiscal resources. The empirical examination carried out in this paper provides only limited support for the hypothesis that the number of taxes and charges created by local governments is a function of relative fiscal need. Of course, what is really important is not so much the number of revenue instruments created but the actual revenue that they generate. The analysis here has abstracted from issues related to the revenue generation of individual taxes and charges. Regrettably, lack of data prevent a more in-depth analysis of these questions.
The extent to which new tax and charge instruments have led to meaningful amounts of new own-source revenues in the aggregate is also less than clear. The vast bulk of the increase in provincial government own-source revenues under decentralization (through fiscal year 2001) was generated by provinces that had not yet bothered to create new instruments. And while issuing kabupaten/kota have generated relatively greater amounts of the aggregate increase in local government own-source revenue, the extent to which the growth is directly due to new local taxes and charges is far from obvious. Even under the most optimistic of assumptions, any increase in own-source revenues that may have resulted from the creation of new taxes and charges would still represent a very small proportion of total regional budgets.
This latter point suggests the main conclusions relevant for the continuing development for fiscal decentralization policy in Indonesia. The instruments sub-national governments have at their disposal—both traditional and new—are inadequate to the task of producing much tax revenue. Without access to more substantial tax bases, regional governments will necessarily remain unsuccessful in generating significant amounts of own-source revenue. It is up to central government, of course, to provide that access.
One obvious solution to this problem for local governments would be to decentralize some authority over the property tax. For provinces (and also possibly for kabupaten/kota), the idea of establishing a supplemental tax on personal income has some merit. Proposals for both are currently being debated inside the Ministry of Finance.14 Experience suggests, however, that decentralizing the property tax to kabupaten/kota and/or creating a piggy-back income tax for regional governments will not come easily or quickly. As long as the status quo prevails, fiscal decentralization in Indonesia will remain an unbalanced affair.
14This is not the place to examine such proposals. See Lewis (forthcoming) for an analysis of the
References
Alm, J., Aten, R. and Bahl, R. (2001). “Can Indonesia Decentralise Successfully? Plans, Problems, and Prospects,” Bulletin of Indonesian Economic Studies 37 (1), pp. 83-102.
Cameron, A. and Trivedi, P. (1990). “Regression Based Tests for Overdispersion in the Poisson Model,” Journal of Econometrics, 46, pp 347-364.
Cameron, A. and Trivedi, P. (1998) The Analysis of Count Data. New York: Cambridge University Press.
Deuster, P. (2002). “Survey of Recent Developments,” Bulletin of Indonesian Economic Studies, 38 (1), pp. 5-37.
Devas, N, Kelly, R. (2001). “Regulation or Revenues? An analysis of Local Business Licenses, with a Case Study of the Single Business Permit Reform in Kenya,” Public Administration and Development 21(5): 381-391.
Greene, W. (1998). LIMDEP Version 7 user’s Manual Revised Edition (Plainview, New York: Econometric Software).
Greene, W., (2000) Econometric Analysis (Upper Saddle River, New Jersey: Prentice Hall International).
Lewis, B. (2001). “The New Indonesian Equalisation Transfer,” Bulletin of Indonesian Economic Studies 37(3): 325-43.
Lewis, B. (2002). “Indonesia,” in Intergovernmental Transfers in Asia; Smoke, P (ed.) Asian Development Bank: Manila; pp137-74.
Lewis, B. (forthcoming). “Property Taxation in Indonesia: Measuring and Explaining Administrative (Under-) Performance,” Public Administration and Development.
Ministry of Finance (2002), “Fiscal Decentralization: A Ministry of Finance Policy Agenda,” Draft Paper, Directorate General for Fiscal Balance, Ministry of Finance. Jakarta.
Ray, David (2001), “Inventory of Trade-Distorting Local Regulations,” USAID-PEG Project, Ministry of Industry and Trade. Jakarta.
Republic of Indonesia (2000), “Law No. 34/2000 regarding the Revision to Law 18/97 regarding Regional Taxes and Charges (Undang-Undang 34/2000 tentang Perubahan atas Undang-Undang 18/97 tentang Pajak Daerah dan Retribusi Daerah),” Jakarta.
Rider, Mark (2002). “Estimated Revenue Yield of Piggyback Personal Income Tax,” Mid-Term Report to the Directorate of Regional Revenue, Ministry of Finance, Republic of Indonesia. Jakarta.