*Corresponding e-mail: [email protected]
VERIFYING OF BETA CONVERGENCE FOR SOUTH EAST COUNTRIES OF ASIA
Michaela Blasko*
Department of Operation Research and Econometrics University of Economics in Bratislava, Slovakia
Husna Leila Yusran
Faculty of Economics, Trisakti University, Jakarta, Indonesia
ABSTRACT
Convergence means the process of balancing disparities in chosen indicators of homogeneous economic groups. -convergence is based on the assumption in which less developed economy grows faster than the advanced ones, resulting in higher speed of GDP per capita in less developed economy. In this article, convergence is verified based on dependency between the growth of real GDP per capita and the initial level of real GDP per capita (in PPP) and based on the modifications of this relationship using Least Squares Method for 9 countries in South East Asia with different samples from 2000 to 2015. To completely explain the dependency and calculation of consistent, minimal estimators of dummies are used and a structural parameter is created, to eliminate shocks and possible disparities between chosen countries. According to the results, convergence was proved only in the sample since 2004 until 2008 among the nine chosen countries of South East Asia.
Keywords: Beta convergence, GDP per capita, Compensation per capita,
JEL Classifications: C12, C21, E23, F62
INTRODUCTION
and traditions of the population may play an important role in observing, particularly when being formulated as rural economic units.
Definition of the Beta convergence is possible to express when poorer, less developed countries try to catch up with richer, more developed countries and converge to the same level of steady state, so these processes reduce disparities between two or more variables at a time and because process of convergence is mostly based on long run processes and cooperation between countries which are trying to create one homogenous economic group. This reason is necessary to analyze nominal and real convergence. The nominal convergence is joined with unite treaty or constituent for group of economies, that want to become one union. These criteria are general for each member economy and they are taken to comply in order to accelerate the process of integration of unity. Typical example of nominal convergence is European Union or United States of America. The real convergence has background in mathematical methodology and application for verifying convergence between already homogenous or similar economies. The most important convergence factor is the real Gross Domestic Product per capita in purchasing power parity (real GDP per capita).
Because of the existing real ideas of integration of South East Asia countries to one unity, we decided to verify Beta convergence of a period between 2000 and 2015 within these countries. This article uses two indicators: the real GDP per capita in PPP and compensation per employee in each sector of economies. There is not any condition of the existence of the same level of steady state for selected variables. Beta convergence is based on the assumption, where less developed economy grows faster than the advanced one, so GDP per capita in less developed economy increases faster. Calculation and definition are explained in methodology of the article and the main studied factor is parameter of convergence.
RESEARCH METHODS
61
Vietnam, excluded Myanmar - because it is not possible to look for homogenous data in this country) by dependency between logarithm of growth of real GDP per capita (PPP) - dependent variable and logarithm of GDP per capita in the initial time - explanatory variable per each analyzed period. The data were divided into five groups of period between 2000 and 2015 during which we apply testing of convergence: 2000 - 2004, 2004 - 2008, 2008 - 2012, 2012 - 2015, 2000-2015. The main intention is to obtain the great development of chosen countries during last fifteen years when policy system and abroad business have been transformed and changed. The second reason is because of the contribution which the year 2008 could bring since this year is known as official start year of world economic and business crises. The length of chosen period between 2000 and 2015 was chosen based on the availability of necessary database per each country from one source since homogenous source is preferable due to the same methodology used during the calculation and collection of information of indicators. The data were downloaded from website of World Bank, therefore, the consistency and credibility of used data were definitely ensured. The dependence between logarithm growth of real GDP per capita in PPP and logarithm of GDP per capita in the initial time is expressed using this formula
(1) where
- the range of years between the initial and the last observation value, - particular country,
- the rate of technological progress, we assume the same per each country, - parameter of convergence,
- the real GDP per capita in PPP in country in the initial year, - the real GDP per capita in PPP in country in the last year,
- the speed of convergence.
is the most important parameter for the verification of Beta convergence and this parameter has to be significant. Based on this parameter, the existence of convergence can be verified. Predicted value of parameter convergence is negative, based on formula - speed of convergence, which should be positive value. Negative parameter may occur just in some undeveloped countries of Central Africa.
The verification of Beta convergence is necessary to count with geographical and political disparities among chosen countries. Since the nine chosen countries have different kinds of political direction, only a calculation of similarly homogenous countries was made. This may have strong impact on the explanation of previous dependence, so based on this argument, an addition of model 1 dummies was made. Using this, disparities balances are possible. Model without dummies was not completely specified, which has important impact to express of random variable. The model without dummies may have treatment of breach of the presumption of randomness. Therefore, four dummies were created and countries were conjoined according their similarity of policy practice and business characteristics as:
first group: Indonesia, Malaysia, Thailand, second group: East Timor,
third group: Singapore,
fourth group: Cambodia, Laos, Philippines, Vietnam.
The model can incorporate k-1 variants, so a new model is explained as
(2) where
- chosen dummies,
- parameters of used dummies, k-1 variations of dummies were used.
63
Even of the new specification of the model, there still exists high probability of completing used model and doubts. The random variable is found in each period dependent on the previous random shocks - impaction of shocks from economic activities of each country. Because of high probability of existing correlation between the explanatory variables and random shocks, the parameter of convergence may be distorted. To avoid parameter's distortion, model 2 is expanded by adding a structural variable, which may aggregate the effect of the economic nature of each monitored country. This structural variable is constructed as a weighted summarization of the average growth in compensation per capita in the various sectors of the economy, the calculation consists of nine economic departments (Agriculture, Industry excluded Construction, Construction, Trade and services, Education, IT and services, Transportation, Government and Health and Finance). The structural parameter is possibly expressed as
(3) where
- the range of years between the initial and the last observation value, - particular country,
- the compensation per capita in country i for the last year, - the compensation per capita in country i for the initial year,
- the weight of economic structure of department j in country i.
The new modification of model is expressed as
(4)
where
- the structural variable,
Other variables have the same explanation as the model 2. The structural variable reveals how much country would grow if each of used sectors grew at the national average rate. If country i specializes in the agriculture and the aggregate agriculture sector does not grow over the period between T and 0, the low value of the structural variable of this country indicates that it should not grow very fast because of the agriculture sector has suffered from random shocks.
Basic assumptions of model in each of used models are verified. In the case of filled assumptions, significant dependency with correlated and homoskedastic residuals, which have normal distribution may explain right and truly relationships with a minimum, consistent and sustaining estimator, which is explained by Least Squares Method. Even that correlation is one of the basic assumptions. Panel data are used in whole sample of article, so potential Autocorrelation is not solved because this assumption can be ensured by easy layout of used data.
Homoskedastic residuals are verified by Breusch Pagan Godfrey test and its P-value for every model is verified as various shapes and dependencies of heteroskedasticity. For ensuring heteroskedastic residuals, he Weighted Least Squares Method is applied. Effective estimator is also possible to provide by White's estimation of parameters, which is resistant against heteroskedasticity. The application is necessary to construct particular weights, which depend on used model. In the case of model with one parameter 1 and model 2, the weight has only one explanatory variable. In the case of several explanatory variables 3, weights are constructed as their linear combination using auxiliary Breusch Pagan Godfrey equation, which is defined as
(5) where
- dependent variable - squares of residuals, - vector of level constant,
- vector of convergence parameters,
65
Application of auxiliary equation was calculated from the estimation of parameters and estimation of fitted values squares of residuals in which these fitted values had to be positive because of square roots of fitted values. These square roots calculated the weights. In the case of no positive fitted value, this was replaced by the corresponding actual square of residuals. Following this, heteroskedastic model was divided into series of calculated weights and estimated by Least Squares Method again. After application of this procedure, homoskedastic residuals model were obtained.
Last procedure was verification of normal distribution of residuals, which is provided by JarqueBera test and its P-value. If normal distribution is verified, information content of T-statistic of individual model parameters and F-statistic model are relevant and estimator is minimal. The most common procedure for provision of normal distribution is the change in specification or in functional form of the model. This methodises is not necessarily specified and is very commonly used and good known.
DATA
Data were downloaded from online database sources of The World Bank (http://data.worldbank.org/) and chosen period was between 2000 and 2015. Common verification was done by dividing sample of data into four shorter periods and whole sample:
2000 - 2004, 2004 - 2008, 2008 - 2012, 2012 - 2015, 2000 - 2015.
EMPIRICAL RESULTS
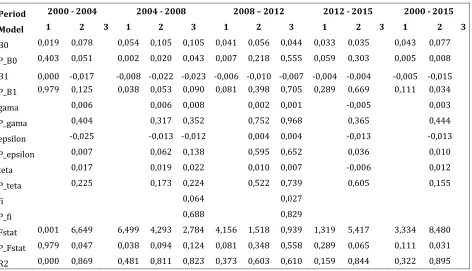
Verification of Beta convergence for chosen nine countries of South East Asia was tested by Least Square Method based on previous formulas 1, 2, and 4 between 2000 and 2015. Results of Beta convergence parameters and explanatory parameters for each model are shown in Table 1 for each sub-period and whole sample together with P-value of parameters, Coefficient of Determination, F-statistic and P-value of F-Statistic.
Table 1: Results of Beta Convergence
The most important parameter to verify convergence into the same steady level of the real GDP per capita in PPP is parameter of convergence . This parameter has to be significant, which in article is verified by P-value of parameter in 90% significant level. Based on results of this parameter, there is verified convergence per each model for period of 2004-2008. Thus, the results are interpreted only for this sample.
67
parameter is significant. The constant level is significant too. Coefficient of determination R2 is 0.4814, so the model of -convergence explains 48.14% of the total variability of the
growth of real GDP per capita in PPP among the chosen sample and model as whole is also significant. Basic assumptions of model are filled, model has homoskedastic and normal distributed residuals, because value of Breusch Godfrey Serial Correlation LM Test is 2.1198 and its P value is 0.1454, so there is no heteroskedastic residuals in the model. Because Jargue Bera test value shows 0.4193 and its P value is 0.8109, normal distribution is proven, so basic assumptions of model are filled. Because parameters are significant, also the whole model is significant and P-value of F-statistic is equals to 0.03814, there is verified Beta convergence between period since 2004 until 2008 for nine chosen countries in South East Asia. Thus, the chosen economies reach the same steady state and calculation of speed of convergence using formula is possible. Based on negative parameter of convergence, speed is positive with calculated speed of convergence equals to 0.75%. The real growth of GDP per capita in the sample since 2004 until 2008 for the chosen countries is in an average of 2.55% even in the fact, that some of them have higher growth such as Laos, Vietnam, Indonesia (more than 5%) , but countries such as Singapore and Thailand have less growth (Singapore has approximately 2% and Thailand has only between 0,5% and 1%). Thus, the average growth of real GDP per capita is close to the average growth of GDP per capita of USA. Because the calculated value of convergence speed in comparison with the average value is understated, the proven result of convergence in the one steady state of real GDP per capita for chosen countries is not ensured and further specification is necessary by model 2 and 4.
chosen sample and model as whole is also significant because F-statistic model is 4.2933 and its P-value is equal to 0.0936. Because coefficient of determination substantially increased and the model is better specified, deeper specification of model might be right. Homoskedastic model was verified again, value of Breusch Godfrey Serial Correlation LM Test is 3.4918 and its P-value is 0.1745, so there is no heteroskedastic residuals in the model. Based on Jargue-Bera test with value of 0.2244 and its P-value which is equal to 0,8675, normal distribution is proven - basic assumptions of model are filled. Only parameter is significant from used dummies and also whole model is significant, F-statistic is equal to 4.2933 and its P-value is 0.0936. It can be concluded that there is verified Beta convergence between period between 2004 and 2008 for nine chosen countries in South East Asia, so the chosen economies reach the same steady state level of real GDP per capita. Calculated speed of convergence based on formula shows positive result and value of convergence speed is 2.1162%. This value is close to average value of GDP growth for chosen countries 2.55% and also similar value of 2% speed of convergence of USA, so results are neither understated nor overvalued. Thus, the informative value of the model is usable. Following this conclusion of verifying and ensured verified convergence, the last model 4 is interpreted.
The last model (4) is an extension with incorporation of the structural variable Sit,
69
was first verified. Homoskedastic residuals and normal distribution in this model are also verified. Based on value of Breusch Godfrey Serial Correlation LM Test of 2.2879 and its P-value of 0.3186 and P-value of Jarque-Bera test equal 0.4603 and its P-P-value of 0.7944, model's assumptions are filled even in the fact that whole model is not significant. Other parameters used of explanatory variables are not significant, whole model is also not significant, so this model has information and theoretical character, which is not confirmed. It is predicted that there exists Beta convergence between period between 2004 and 2008 for nine chosen countries in South East Asia, with no impact by dummies or structural shocks in the chosen countries, but it is still inconclusive. If speed of convergence was calculated by formula , result would be almost the same with previous model equal to 2.19% and again close to 2% of average speed of convergence reached by for monitored nine countries, which show very trustworthy result of convergence speed.
CONCLUSION
The article explains the methodology of Beta convergence verification. This convergence approach is based on hypothesis, when poorer countries tent to grow faster per capita than richer.Based on results from three different models, there was proven concept of Beta convergence in sample between 2004 and 2008 of the chosen nine countries in South East Asia. The leading indicator is the parameter of convergence and based on this indicator, convergence was verified only for sample between 2004 and 2008. Other divided samples did not prove Beta convergence among chosen countries. Similarly, the existence of convergence among nine chosen countries on the whole sample from 2000 to 2015 was not verified. It is concluded that division of shorter period is more exact.
REFERENCES
Barro, J. R. and Sala-i-Martin, X. (2004). Economic Growth. 2nd ed. London: The MIT Press: Cambridge, Massachusetts. ISBN 0-262-02553-1.
Economic Outlook for Southeast Asia, China and India 2016. (2015). Real GDP growth of ASEAN, China and India. Enhancing Regional Ties. [online]:
http://www.oecd.org/dev/asia-pacific/SAEO2016_Overview%20with%20cover%20light.pdf.
Lim, K., L. and Mcaleer, M. (2000). Convergence and Catching Up in South-East Asia: A
comparative Analysis. [online]:
http://fmwww.bc.edu/RePEc/es2000/1844.pdf?q=gross-domestic-product-per-capita-in-asean-at-current-prices.
Severino, C., R. (2000). Diversity and Convergence in Southeast ASIA. Association of Southeast Asian Nations, 9th annual conference of the Harvard Project for Asian and International Relations. [online]: http://asean.org/?static_post=diversity-and-convergence-in-southeast-asia-28-august-2000.
Solow, M. R. (1956). A Contribution to the Theory of Economic Growth. London: The MIT Press: The Quarterly Journal of Economics, Vol. 70, No. 1.
Word Bank. (2016). Used data for verifying of Beta convergence. [online]: