International Journal of Science and
Engineering(IJSE)
Home page: http://ejournal.undip.ac.id/index.php/ijse
Techno-Economy Analysis A Small Scale Reverse Osmosis
System for Brackish Water Desalination
I.N.Widiasa, L.A.Yoshi#)
#)Departement of Chemical Engineering, Faculty of Engineering, Diponegoro University
Jl. Prof. Soedarto, SH, Tembalang-Semarang; Telp. +62-24-7460058; Fax. +62-24-76480675
Email: [email protected]
Abstract -This study aims to get the design process and the economics of small-scale desalination of brackish water in Indonesia which has interest in the range of 12-14%, electricity cost of $0.09-0.13/kWh, and groundwater tax regulation. The use of BWRO desalination system in Indonesia has been generally done at small scale. This study based on Bali island with electricity cost at $0.1/kWh and water tax at $0.37/m3. Techo economy evaluation was analysed for plant capacity of 150-1,00 m3/day, recovery of 40% with brackish water
water salinity of 5,000 ppm. Price of desalted water during first year a case study is $1.31/m3. It can be concluded that economic
evaluation based on NPV and IRR shows that it is worthed.
Keywords—Desalination, brackish water, techno-economy
Submission: February 10, 2016 Corrected : March 18, 2016 Accepted: April 1, 2016
Doi: 10.12777/ijse.10.2.51-57
[How to cite this article: Widiasa, I.N. and Yoshi, L.A. (2016). Techno-Economy Analysis A Small Scale Reverse Osmosis System for Brackish Water
Desalination, International Journal of Science and Engineering, 10(2),51-57. Doi: 10.12777/ijse.10.2.51-57]
I. INTRODUCTION
The development of business activities like hospitality, villas, restaurants, and shopping centers(Lamei et al, 2008; Widiasa and Susanto, 2016) as a result of tourism led to increased need for clean water. Availability of brackish water that can adequately meet the needs of clean water and using membrane technologyto process it.Membrane technology is able to lower the Total Dissolved Solid (TDS)or salinity of brackish water into clean water by separating contaminants in brackish water as solid particles, turbidity, cysts, bacteria, viruses, color, organic compounds, and dissolved solids (Widiasa and Susanto, 2016; Shenvi et al, 2015).
Membrane desalination technology has been widely used in many countries (Dore, 2004; Eltawil et al, 2009; Ghaffour et al, 2013; Jaber and Ahmed, 2004; Reddy and Ghaffour, 2007). In every location has a different cost desalination that caused economic parameter values like interest rate, energy (electricity cost), water tax, and capacity plant.
To prevent excessive brackish water exploration which will cause subsidence and seawater intrusion (Widiasa and Susanto, 2016) the government makes a policy of raw water which reached Rp 4,950/m3 (Regulation No. 1, 2011 Badung). Intake of raw water to the BWRO system calculated with the feed flow rate (m3/day) required to produce products in accordance with the capacity plant. In the design, system recovery of BWRO magnitude greatly affect to the desalination cost, especially for the purchase raw water cost.
which have long experience but for developing countries like Indonesia, which only recently using desalination technology,
economic analysis usually had not been properly
recorded.This study aims to construct the process and economic design of small-scale desalination of brackish water in Indonesia which is has different about regulation of water tax, interest rate and electricity costs.
II. MATERIAL AND METHOD
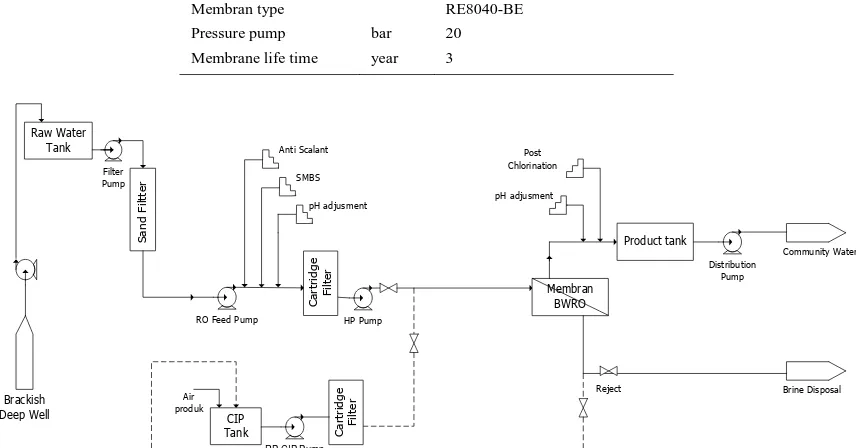
This was a Reverse Osmosis (RO) desalination case study plant and conducted in Bali Island. The caracteristics of process design and economic parameters were adjusted to Bali Island’s condition. Brackish water was used as feed water as Brackish Water Reverse Osmosis (BWRO) with TDS was 5,000 ppm. The plant was operated on small capcity using CSM membrane and simulated using CSM PRO 5 software from Toray Chemical Korea Inc. The control variabel in the simulation was the pressure pump that was needed to pump the feed to RO membrane. In details desalination process parameters are shown in Table 1.
Design process
Internat. J. Sci. Eng., Vol. 10(2)2016:51-57, April 2016, I.N.Widiasa and L.A.Yoshi
Table 1.Parameters process design desalination
Parameter Unit Value
Plant capacity (m) m3/day 150, 200, 300, 500, 750, 1000
Figure 1.Schematic of Brackish Water Desalination
Economic evaluation
The desalination cost was calculated as the total cost ($/year) and the cost of water per meter cubic ($/m3). The total cost was derived from the sum of water tax, capital, electricity, chemical, labor, membrane, cartridge, and maintenance. The cost calculationwas conducted using Microsoft Excel 2010. Economic calculations refer directly to the price of the field shown in Table 2 to set a real desalination cost. Equation (1)-(11) were conducted in order to find the desalination cost (Al Wazzan et al, 2002; Avlonitis et al, 2003; Ettoney et al, 2002; Shahabi et al, 2015):
Table 2. Values of Economic Parameter
Parameter Value Unit
Plant’s life time n 10 Year
b) Water tax regulation in Badung
1$= IDR 13.350
After the cost of desalination was obtained, further economic evaluation in terms of economic engineering principles was conducted with regard of installation cost, operation and maintenance costs (O&M). Economic paramaters as feasibility asessment of the economic shown on the Table 3 to get the value is more real.
Table 3. Parameter economic feasibility assessment
Describe Unit Value
Water price in first year $/m3 17,500 Increase water price $/2year 2,000 Increase water tax %/year 5 Increase electricity costs %/year 3 Increase chemical costs %/year 5 Increase cartridge costs %/year 5 Increase spare parts costs %/year 5 Increase labour costs %/year 8
The evaluation was done in terms of Net Present Value (NPV) and Internal Rate of Return. NPV is the difference between cash in flow and cash out flow by taking into account the time value of money. Time value of money or Present Value was used to determine the value of money at this time because the money generated will be received in the future. If NPV> 0 profitable investments and projects can be executed. NPV calculation:
(12) Where:
Co = money invested (negative)
C1,2, n = money generated in year-1,2, until n determinedby Present Value inflow equals outflow (NPV=0). IRR calculation:
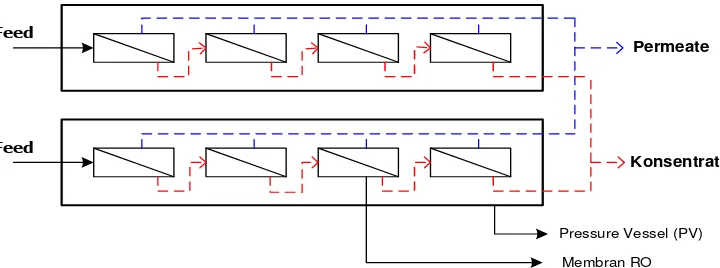
Design system brackish water desalination can be done in single stage or double stage. This aims to reach higher recovery (El-Zanati and Sherif, 2004; Fritzmann et al, 2007; Greenlee et al, 2008; Lamei et al, 2008; Vince et al, 2008; Shenvi et al, 2015) that serve in the figure 2 and 3. In the double stage system feedused for the second Pressure Vessel
(PV) is concentrate from the first PV. Based on simulation pressure pump is greater than the capacity of 150 m3/day that uses only seven pieces of membrane. This is due to the flow of concentrate recycle to feed water so that the concentration (TDS) feed water increases. The use of recycle streams is intended to achieve high recovery (70%) and achieve minimum feed flow rate is 2.73 m3/h (Toray Chemical Korea Inc, 2009).
Table 4. The effect of capacity plant to minimum number of membrane and energy consumption the total energy 2 kWh/m3 for pumping feed water to the RO membrane (Avlonitis et al, 2003; Fritzmann et al, 2007; arrangement based on the availability of space at desalination plant. In the simulation, capacity plant of 300 m3/day needs 12 pieces using 2 of PV and contains 6 membranesofevery
Internat. J. Sci. Eng., Vol. 10(2)2016:51-57, April 2016, I.N.Widiasa and L.A.Yoshi
Figure 3. Double stage design
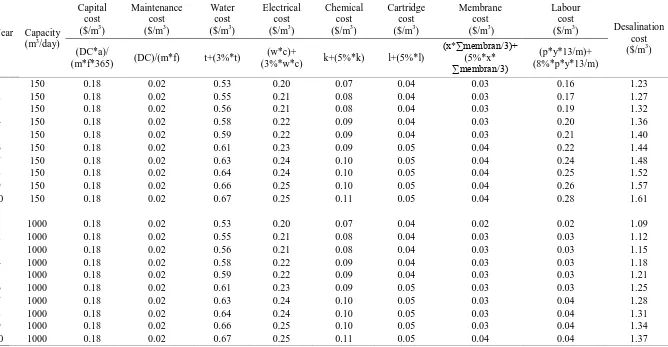
Desalination costs
The desalination cost is obtained from the sum of raw water cost, capital cost or investment cost, electricity cost, chemicals cost (pre and post treatment), maintenance cost, labor cost, cartridge filters cost. Table 5is shown of desalination costs in which the desalinationcost is influenced by capacity plant. In addition to the capacity plant also give an effect of labor cost as the operator. The larger capacityprovide much smaller of labour cost so that the cost of desalination obtained will be cheaper. Therefore, labor costs can be reduced by minimizing the amount of operator, especially for small capacity (Avlonitis et al, 2003; Greenlee et al, 2008; Lapunte, 2012; Karagianis and Soldatos, 2008; Jaber and Ahmed, 2007; Karagiannis and Soldatos, 2007; Lamei et al, 2008; Mezher et al, 20112008; Rayan and Khaled, 2002; Reddy and Ghaffour, 2007).
The amount of recovery in the brackish water desalination system would affect the costs incurred for raw water cost. Raw water cost is calculated according to the amount of feed used to produce water desalination (m3/day). The average recovery of brackish water desalination between 70-85% so the greater recovery is used the raw water cost will decrease and cause the desalination cost more affordable. The effect of recovery to the desalintion cost is shown in Figure 4.
Figure 4. The effect of recovery on the desalination cost in electricity cost of $0.1/kWh and interest of 13%
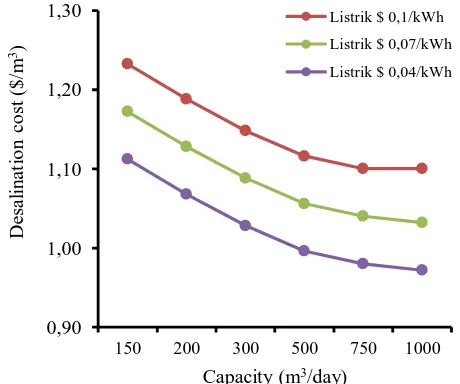
The elctricity cost in Indonesia reached $0.1/kWh (electricity adjusment, March 2016). Unlike in other countries that electricity costs of about $0.04-0.09/kWh (Ettouney, 2002; Fritzmann et al, 2008) so that electricity costs will impact the desalination cost is shown in Figure 5.
Figure 5. The effect of electricity cost on the desalination cost in recovery of 70% and interest of 13%
Table 5. Desalination costs
Year Capacity (m3/day)
Capital cost ($/m3)
Maintenance cost ($/m3)
Water cost ($/m3)
Electrical cost ($/m3)
Chemical cost ($/m3)
Cartridge cost ($/m3)
Membrane cost ($/m3)
Labour cost
($/m3) Desalination
cost ($/m3) (DC*a)/
(m*f*365) (DC)/(m*f) t+(3%*t)
(w*c)+
(3%*w*c) k+(5%*k) l+(5%*l)
(x*∑membran/3)+ (5%*x* ∑membran/3)
(p*y*13/m)+ (8%*p*y*13/m)
1 150 0.18 0.02 0.53 0.20 0.07 0.04 0.03 0.16 1.23
2 150 0.18 0.02 0.55 0.21 0.08 0.04 0.03 0.17 1.27
3 150 0.18 0.02 0.56 0.21 0.08 0.04 0.03 0.19 1.32
4 150 0.18 0.02 0.58 0.22 0.09 0.04 0.03 0.20 1.36
5 150 0.18 0.02 0.59 0.22 0.09 0.04 0.03 0.21 1.40
6 150 0.18 0.02 0.61 0.23 0.09 0.05 0.04 0.22 1.44
7 150 0.18 0.02 0.63 0.24 0.10 0.05 0.04 0.24 1.48
8 150 0.18 0.02 0.64 0.24 0.10 0.05 0.04 0.25 1.52
9 150 0.18 0.02 0.66 0.25 0.10 0.05 0.04 0.26 1.57
10 150 0.18 0.02 0.67 0.25 0.11 0.05 0.04 0.28 1.61
1 1000 0.18 0.02 0.53 0.20 0.07 0.04 0.02 0.02 1.09
2 1000 0.18 0.02 0.55 0.21 0.08 0.04 0.03 0.03 1.12
3 1000 0.18 0.02 0.56 0.21 0.08 0.04 0.03 0.03 1.15
4 1000 0.18 0.02 0.58 0.22 0.09 0.04 0.03 0.03 1.18
5 1000 0.18 0.02 0.59 0.22 0.09 0.04 0.03 0.03 1.21
6 1000 0.18 0.02 0.61 0.23 0.09 0.05 0.03 0.03 1.25
7 1000 0.18 0.02 0.63 0.24 0.10 0.05 0.03 0.04 1.28
8 1000 0.18 0.02 0.64 0.24 0.10 0.05 0.03 0.04 1.31
9 1000 0.18 0.02 0.66 0.25 0.10 0.05 0.03 0.04 1.34
Internat. J. Sci. Eng., Vol. 10(2)2016:51-57, April 2016, I.N.Widiasa and L.A.Yoshi
Figure 6. The effect of interest rate on the desalination cost in recovery of 70% and electricity cost of $0.1/kWh
Figure 7. The comparative desalination cost in single stage and double stagesystem
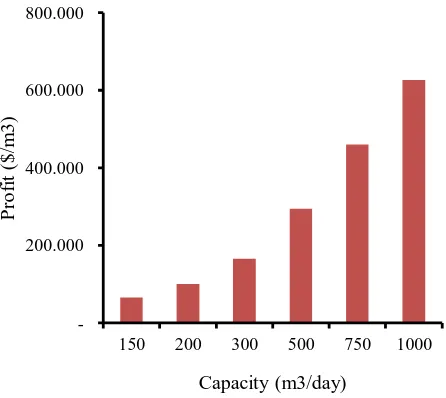
Figure 8. Profit desalination plant along 10 years
Desalination costs are evaluated based on Net Present Value (NPV) dan Internal Rate of Return (IRR) is presented
than fixed deposito and reksadana so that BWRO desalination is worthed. desalination on small capacity (150-1000 m3/day) recovery of 70% has a result that a brackish water desalination systems can be done in single stage or double stage system that caused by the avalaibality of space desalination plant. Price of water desalination of $1.31/m3 in first year and will rise to $0.15/m3 every two years. Desalination costs are evaluated based on the NPV and IRR provide results that installation is worthed.
REFERENCES
Al-Wazzan.Y.. Safar M.. Ebrahim.S.. Burney. N.. and Mesri. A. (2002). Desalting of subsurface water using spiral wound reverse osmosis (RO) system: technical and economic assessment. Desalination. 143: 21-28 Atikol.U. and Aubar. H. S. (2005). Estimation of water production cost in the
feasibility analysis of RO systems.Desalination. 184: 253-258.
Avlonitis. S. A..Kourumbas.K.. and Vlachakis. N. (2003). Energy consumption and membrane replacement cost for seawater RO desalination plantts. Desalination. 157: 151-158.
CSM RO System Design & CSM PRO program. Woongjin Chemical Co. Ltd Filter Design.
Dore. M. H. I. (2005). Forecasting the economics costs of desalination technology.Desalination. 172: 207-214.
Eltawil. M. A..Zhengming.Z.. and Yuan. L. (2009). A review of renewable energy technologies integrated with desalination systems. Renewable and sustainable energy reviews. 13: 2245-2262.
Elzanati.E. and Sherif.E. (2004).Development of a locally designed and manufactured small-scale reverse osmosis desalination system.Desalination. 165: 133-139.
Ettouney. H. M..El-Desseouky. H. T..Faibish. R. S..andGowin. P. J. (2002). Evaluating the economics of desalination.Heat transfer.32-39.
Fritzmann.C.. J.. Löwenberg.T..Wintgens. and T..
Melin.(2007). State-of-the-art of reverse osmosis desalination.Desalination. 216: 1–76.
Ghaffour.N..Missimer. T. M..and Amy. G. L. (2013). Technical review and evaluation of the economics of water desalination: Current and future challenges for better water supply sustainability. Desalination. 309:197-207.
Ghobeity.A. and Mitsos.A. (2014).Optimal design and operation of desalination systems new challenges and recent advances.Chemical Engineering. 6: 61-68.
Greenlee. L. F..Lawler. D. f.. Freeman. B. D..Marrot.B.. and Moulin. P. (2009). Reverse osmosis desalination: Water sources. technology. and
today’s challenges. Water research.43: 2317- 2348.
Jaber. I. S. and Ahmed. M. R. (2004). Technical and economic evaluation of brackish groundwater desalination by reverse osmosis (RO) process.Desalination. 165: 209-213.
Karagiannis. I. C. and Soldatos. P. G. (2008). Water desalination cost literature: review and assessment. Desalination. 223: 448-456.
Kesieme. U. K.. Milne. N.. Aral. H.. Cheng. C. Y.. and Duke. M. (2013). Economic analysis of desalination technologies in the context of carbon pricing. and opportunities for membrane distillation. Desalination. 323: 66–74.
Lamei.A..Zaag. P. V. D..andMünch. E. V. (2008). Basic cost equations to estimate unit production costs for RO desalination and long-distance piping to supply water to tourism-dominated arid coastal regions of
150 200 300 500 750 1000
Lapunte.E. (2012). Full cost in desalination: A case study the Segura River Basin. Desalination. 300: 40-45.
Loutatidou.S..Bushra. C..Prashanthi. R. M..and Hassan. A. A. 2014. Capital Cost Estimation of RO plantts: GCC countries versus Southern Europe. Desalination. 347: 103-111
Mezher.T..Fath. H.. Abbas. Z.. and Khaled. A.. (2011). Techno economic assessment and environmental impacts of desalination technologies.Desalination. 266: 263-273.
Regulation 1 of Water Tax in Badung. 2011
Tarif adjusment electricity cost. March 2016. PT. PLN (Persero)
Rayan. M. A..andKhaled. I.. (2002). Sea water desalination by reverse osmosis (case study).Desalination. 153: 245-251.
Reddy. K. V. and Ghaffour. (2007). Overview of the cost of desalinated water and costing methodologies.Desalination. 205: 340-353.
Shenvi. S. S..Isloor. A. M..and Ismail. A. F. (2015). A review on RO membrane technology: Developments and challenges. Desalination. 368: 10-26
Toray Chemical Korea Inc. Customer Satisfaction Membrane (CSM). 2009. Vince. F..Marechal. F..Aoustin. A.. and Bréant. P. Multi-objective
optimization of RO desalination plantts. Desalination. 222: 96–118. Widiasa. I.. and Susanto. A. A. 2016. Tekno-Ekonomi Sistem Membran
Terintegrasi untuk Pengolahan Air Baku Campuran Air Payau and Efluen STP. Prosiding Seminar Nasional Teknik Kimia “Kejuangan”. Yogyakarta. March 17. 2016. ISSN 1693-4393.