Full Terms & Conditions of access and use can be found at
http://www.tandfonline.com/action/journalInformation?journalCode=vjeb20
Journal of Education for Business
ISSN: 0883-2323 (Print) 1940-3356 (Online) Journal homepage: http://www.tandfonline.com/loi/vjeb20
The Effect of Evaluation Location on Peer
Evaluations
Curt J. Dommeyer
To cite this article: Curt J. Dommeyer (2006) The Effect of Evaluation Location on Peer Evaluations, Journal of Education for Business, 82:1, 21-26, DOI: 10.3200/JOEB.82.1.21-26 To link to this article: http://dx.doi.org/10.3200/JOEB.82.1.21-26
Published online: 07 Aug 2010.
Submit your article to this journal
Article views: 26
View related articles
ABSTRACT.A comparison of peer
evaluations conducted outside the
class-room to those conducted inside revealed
that the ones conducted outside were more
critical and less supportive of the students
being rated. Moreover, the evaluations
con-ducted outside the classroom provided
more copious and critical answers to an
open-ended question. It is suspected that
these results were due to the greater privacy
and time allotted to the evaluators outside
the classroom.
Key words: collaborative learning, peer
evaluation, rating assessment location
Copyright © 2006 Heldref Publications
roup projects are commonly used in business schools to provide a collaborative learning experience for stu-dents. Numerous advantages to group projects have been cited in the literature: (a) they can be more motivating and challenging than individual assignments (Denton, 1994; Dommeyer, 1986); (b) they provide an environment in which students can interact with and learn from each other (Freeman, 1996; Johnson & Johnson, 1984); and (c) they can reduce the number of reports that an instructor must grade (Dommeyer; Pfaff & Huddle-ston, 2003).
However, those who have studied group members’ experiences with group projects have found that a common complaint of group members is that they must deal with team members who do not contribute fairly to the team’s goals (McLaughlin & Fennick, 1987; Strong & Anderson, 1990; Williams, Beard, & Rymer, 1991). The team members who contribute less than their fair share are often referred to as social loafers or free riders (Beatty, Haas, & Sciglimpaglia, 1996; Brooks & Ammons, 2003; Grieb & Pharr, 2001).
Because instructors cannot see first-hand how each group member is con-tributing to the group’s goals, peer eval-uations have become a popular way to assess each team member’s contribution (Beatty et al., 1996). Research on the effects of peer evaluations reveals that
they can improve relationships among teammates, can result in a more even distribution of the workload, and can enhance the quality of the final group report (Chen & Hao, 2004; Cook, 1981; Druskat & Wolff, 1999). The prepon-derance of research on peer evaluations has focused on their development (Beat-ty et al.; Deeter-Schmelz & Ramsey, 1998; Haas, Haas, & Watruba, 1998; Johnson & Smith, 1997), validity (Clark, 1989), reliability (Clark; Falchikov, 1995; Macpherson, 1999), potential for bias (Haas et al., 1998; Fox, Ben-Nahum, & Yinon, 1989; Park & Kristol, 1976), timing (Brooks & Ammons, 2003; Druskat & Wolff, 1999) and frequency of use (Brooks & Ammons).
The Present Study
One feature of peer evaluations that apparently has been overlooked by previ-ous researchers is the location in which the evaluations are conducted (i.e., inside the classroom vs. outside of the class-room). With rare exceptions, the majori-ty of authors who have reported on their use of peer evaluations have failed to mention where they were conducted, suggesting for them that the location of the evaluations is an inconsequential aspect of the evaluations. Thus, no study to date has reported on the effect of loca-tion on peer evalualoca-tions. The purpose of the present study is to determine how
The Effect of Evaluation Location
on Peer Evaluations
CURT J. DOMMEYER
CALIFORNIA STATE UNIVERSITY, NORTHRIDGE NORTHRIDGE, CALIFORNIA
G
peer evaluations are affected by the loca-tion in which they are conducted.
Although administering peer evalua-tions inside the classroom may be conve-nient for both the instructor and the stu-dent, this location may affect how teammates are rated since teammates are often seated next to or near each other during the ratings. Consequently, raters may fear that their evaluations may be viewed by their teammates during the evaluations or when the forms are being returned to the professor. While some students may feel negatively about the performance of some of their teammates, they may be reluctant to divulge this neg-ative information if they fear that the confidentiality of the ratings will be com-promised. However, if students complete the evaluations outside of the classroom, they can do the evaluations in a private location without fear that their team-mates will see the evaluations. When evaluations are done privately, students should feel more willing to express their true feelings and might be more likely to provide ratings or comments that are crit-ical rather than supportive of their team-mates. With this reasoning in mind, I propose the following hypothesis:
H1: Peer evaluations conducted outside of the classroom will be more critical and less supportive of teammates than those conducted inside the classroom.
Another feature of peer evaluations conducted outside the classroom is that they are not constrained by any class-room time limits. Evaluations conducted outside the classroom are more likely to be conducted in an environment where the students have as much time as they want to reflect on their ratings and opin-ions. Thus, one might expect that evalu-ations conducted outside the classroom would be more complete and, in the case of open-ended questions, more copious. With this logic in mind, I proposed the following hypothesis:
H2: Peer evaluations conducted outside of the classroom will exhibit higher item completion rates and, in the case of open-ended questions, more copious answers than those conducted in the classroom.
METHOD
In the fall of 2003, the fall of 2004, and the spring of 2005, students in
upper division marketing research class-es at a large California state university were placed on teams of two or three students to conduct survey research pro-jects. The projects took the entire semester and accounted for 33% of each student’s grade. At the beginning of each semester, the instructor told all stu-dents that they were expected to make fair contributions to the team project and that peer evaluations would be used to assess individual contributions. The instructor also informed students that any team member who received poor peer evaluations would receive a grade on the project that would be below the team grade. Those in the fall terms com-pleted the peer evaluations inside the classroom (n= 131) while those in the spring term completed the peer evalua-tions outside of the classroom (n= 84). The form used to collect the peer eval-uations consisted of 45 descriptive phrases and one open-ended question. Some of the phrases described positive attributes (e.g., “was enthusiastic about working with me” and “had good ideas”) while others described negative attributes (e.g., “would not respond to my e-mails” and “made me feel frustrat-ed”). After reading each phrase, students rated each teammate on a 10-point scale, ranging from 1 (not very descriptive) to 10 (very descriptive). The open-ended question asked the students to explain how they felt about their teammate(s).
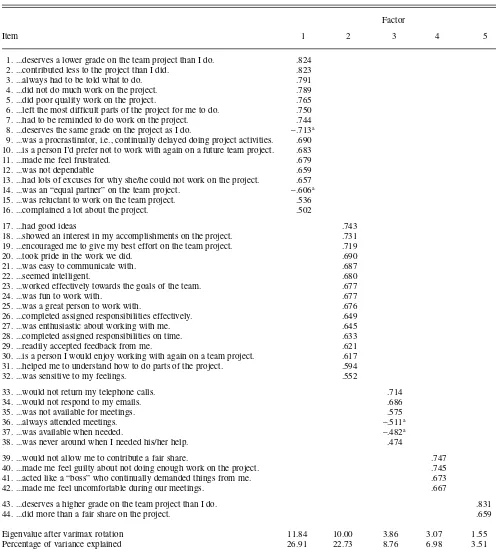
I applied factor analysis with varimax rotation to the data so that the 45 descriptive phrases could be summa-rized in a meaningful way. Each person on a two-person team evaluated his or her teammate. Consequently, the 57 respondents from two-person teams resulted in 57 peer evaluations. Each person on a three-person team submit-ted two peer evaluations, one for each of his or her two teammates. There were 158 respondents from three–person teams, yielding 316 peer evaluations. Thus, the factor analysis initially included a total of 373 peer evaluations. Because I applied the factor analysis only to peer evaluations that did not have any missing data, the factor analy-sis was based on 350 evaluations. The items comprising each factor are shown in Table 1 along with the factor load-ings. For the sake of parsimony, only the
highest factor loading for each item is shown in Table 1. One item was not cor-related strongly with any of the factors, so it was eliminated from the analysis.
The factor analysis revealed five sig-nificant factors (i.e., factors that have an eigenvalue greater than one). Factor 1 consists of 14 negative items with posi-tive loadings and two posiposi-tive items with negative loadings. A high score on this factor indicates that a person is a social loafer and not a team player. I labeled this factor Incompetent. Factor 2 consists of 16 items describing positive features, all of which have positive load-ings. A high score on this factor indi-cates that a person is a team player and very supportive of the team’s activities. I labeled this factor Supportive. Factor 3 consists of six items–four negative items with positive loadings and two positive items with negative loadings. A person scoring high on this factor is one who does not respond to e-mails or tele-phone calls and who is not available for meetings or team activities. I labeled this factor Unavailable. Factor 4 con-sists of four items that indicate that a person is domineering, controlling, and uncomfortable to work with. I labeled this factor Domineering. Finally, Factor 5 consists of two items, both of which indicate that a person is an outstanding team performer (i.e., one who does more than a fair share on the project). I labeled Factor 5 Super Worker.
I used the items comprising each of the factors to create the five scales dis-played in Table 2. Before a scale score was calculated, I reverse coded nega-tively loaded items so that a high score on a negative item was equivalent to a low score on a positive item and vice versa. I then derived a total scale score by simply adding each scale’s item scores. Once I determined a total scale score, I divided it by the number of items comprising the scale. Thus, each of the five scales in Table 2 could have an average score ranging anywhere from 1 (not very descriptive) to 10 (very descriptive). The scores on these scales indicate how a student felt about his or her teammate(s).
Because a student was on either a two-person or three-person team, I had to adjust some of the scale scores to take team size into consideration. If a student
was on a two-person team, the average scale scores that the student gave team-mates were determined as described in the previous paragraph. However, if a student was on a three-person team, the student gave two sets of scale scores
(i.e., one for each teammate). To obtain a single set of scale scores for students on three-person teams, I determined their final scale scores by averaging the scale scores they gave to each of their two teammates. Consequently, scores
for students on two-person teams indi-cate how the students felt about their teammates, while scores for a person on a three-person team reflect that stu-dent’s attitudes towards the two team-mates combined.
TABLE 1. Factor Loadings on Rating Items After Varimax Rotation (n= 350)
Factor
Item 1 2 3 4 5
1. ...deserves a lower grade on the team project than I do. .824 2. ...contributed less to the project than I did. .823
3. ...always had to be told what to do. .791
4. ...did not do much work on the project. .789
5. ...did poor quality work on the project. .765
6. ...left the most difficult parts of the project for me to do. .750 7. ...had to be reminded to do work on the project. .744 8. ...deserves the same grade on the project as I do. –.713a 9. ...was a procrastinator, i.e., continually delayed doing project activities. .690 10. ...is a person I’d prefer not to work with again on a future team project. .683
11. ...made me feel frustrated. .679
12. ...was not dependable .659
13. ...had lots of excuses for why she/he could not work on the project. .657 14. ...was an “equal partner” on the team project. –.606a 15. ...was reluctant to work on the team project. .536
16. ...complained a lot about the project. .502
17. ...had good ideas .743
18. ...showed an interest in my accomplishments on the project. .731 19. ...encouraged me to give my best effort on the team project. .719
20. ...took pride in the work we did. .690
21. ...was easy to communicate with. .687
22. ...seemed intelligent. .680
23. ...worked effectively towards the goals of the team. .677
24. ...was fun to work with. .677
25. ...was a great person to work with. .676
26. ...completed assigned responsibilities effectively. .649
27. ...was enthusiastic about working with me. .645
28. ...completed assigned responsibilities on time. .633
29. ...readily accepted feedback from me. .621
30. ...is a person I would enjoy working with again on a team project. .617 31. ...helped me to understand how to do parts of the project. .594
32. ...was sensitive to my feelings. .552
33. ...would not return my telephone calls. .714
34. ...would not respond to my emails. .686
35. ...was not available for meetings. .575
36. ...always attended meetings. –.511a
37. ...was available when needed. –.482a
38. ...was never around when I needed his/her help. .474
39. ...would not allow me to contribute a fair share. .747
40. ...made me feel guilty about not doing enough work on the project. .745
41. ...acted like a “boss” who continually demanded things from me. .673
42. ...made me feel uncomfortable during our meetings. .667
43. ...deserves a higher grade on the team project than I do. .831
44. ...did more than a fair share on the project. .659
Eigenvalue after varimax rotation 11.84 10.00 3.86 3.07 1.55
Percentage of variance explained 26.91 22.73 8.76 6.98 3.51
Note. Only the largest factor loading on each row is displayed. Factor scales: 1 = Incompetent; 2 = Supportive; 3 = Unavailable; 4 = Domineering; 5 = Super Worker. aItem was reverse coded when calculating total score on scale derived from this factor.
To assess the reliability of the five scales, I calculated Cronbach’s alpha for each of the scales (see Table 2). Four of the five scales have decent to excellent reliability coefficients. Only the Super Worker scale has a poor reliability coef-ficient. This is no doubt a result of the fact that this scale is comprised of only two items, and these two items are not highly correlated. I will examine aver-age scores on the Super Worker scale, but any conclusions based on this scale may be premature.
RESULTS
All statistical tests described in this section were conducted using a .10 alpha level.
In H1, I predicted that evaluations conducted outside of the classroom would be more critical and less support-ive than those done inside the class-room. I investigated this hypothesis by examining how the evaluation location affected both the scale scores and the responses to the open-ended question.
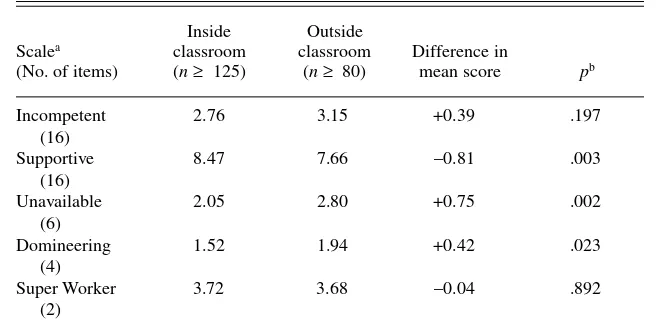
Average scores on the five scales for both those who evaluated their peers while inside the classroom and those who did the evaluations outside the classroom are displayed in Table 3. Although the two evaluation locations did not differ significantly on their aver-age scores on the Incompetent and Super Worker scales, evaluations con-ducted outside of the classroom resulted in significantly higher average scores on the Unavailable and Domineering scales than those conducted inside. Moreover, evaluations conducted out-side the classroom resulted in signifi-cantly lower average scores on the
Sup-portive scale. These latter three results support H1.
The open-ended question asked stu-dents to indicate how they felt about their teammate(s). A respondent’s answers fell into one of three categories: (a) all positive comments, (b) a mixture
of positive and negative comments, or (c) all negative comments. Table 4 reveals that the evaluation location had a significant effect on the types of com-ments made: evaluations conducted out-side the classroom were less likely to fall into the all positive category and more likely to fall into both the both positive and negative and all negative categories (p< .10). These results pro-vide additional support for H1.
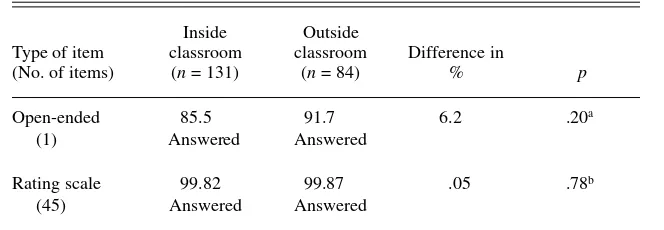
Because students conducting the evaluations outside the classroom are not subject to classroom time con-straints, in H2 I predicted that evalua-tions conducted outside the classroom would be more likely than those col-lected inside to exhibit higher item completion rates and to provide more copious answers to the open-ended question. The results, as displayed in Table 5, show that the location of the TABLE 2. Reliability Analysis for Scales Derived from Factor Analysis
Crobach’s α
Scale Items compromising scalea (n= 350)
Incompetent 1 to 16 .97
Supportive 17 to 32 .96
Unavailable 33 to 38 .89
Domineering 39 to 42 .77
Super worker 43 to 44 .53
aRefer to Table 1 to see items. Items 8, 14, 36, and 37 were reverse coded when calculating the scale
score because each item has a negative factor loading.
TABLE 3. The Effect of Evaluation Location on Mean Scale Scores
Inside Outside
Scalea classroom classroom Difference in
(No. of items) (n≥ 125) (n≥ 80) mean score pb
Incompetent 2.76 3.15 +0.39 .197
(16)
Supportive 8.47 7.66 –0.81 .003
(16)
Unavailable 2.05 2.80 +0.75 .002
(6)
Domineering 1.52 1.94 +0.42 .023
(4)
Super Worker 3.72 3.68 –0.04 .892
(2)
aRefer to table 1 to see items. Items 8, 14, 36, and 37 were reverse coded when calculating the
scale score because each item has a negative factor loading. bDetermined with the
independent-samples ttest.
TABLE 4. The Effect of Evaluation Location on Response to the Open-Ended Question in Percentages
Inside classroom Outside classroom
Type of comment (n= 112) (n= 77)
All positive statements 69.6 54.5
Both positive and
negative statements 12.5 22.1
All negative statements 17.9 23.4
Total 100 100
Note.χ2(2,N= 189) = 4.88,p= .087.
evaluations had no significant effect on the item completion rates. However, response to the open-ended question revealed that those doing the evalua-tions outside the classroom provided, on average, more words to their answers than those providing their answers inside the classroom, 50.75 word average outside versus 37.65 word average inside,t(187) = 2.00,p< .025. These latter results provide partial support for H2.
DISCUSSION
Although this is a small study, the results suggest that location has an effect on peer evaluations. The evalua-tions conducted outside the classroom were more critical and less supportive of teammates than were those conduct-ed inside the classroom, and the evalua-tions conducted outside the classroom resulted in more copious answers to the open-ended question. These results probably occurred because of the greater privacy and time afforded to the students when they did the evaluations outside the classroom. But it is really unclear how students conducted the evaluations outside the classroom. Did they really do them privately? It is pos-sible that some outside evaluations were actually completed while the students were in the company of their team-mates. One must also wonder if, in fact, students had more time to conduct the evaluations when they were done out-side the classroom. If the typical student is taking several courses, working 30 or more hours a week, and having an active social life, he or she may feel
more time pressure outside the class-room than in it.
To have a better understanding of how location affects peer evaluations, future researchers might inquire on their survey instruments how students are feeling during the evaluations. Do stu-dents fear that their teammates may see evaluations? Do they feel pressured for time? Are their evaluations independent of the evaluations they receive from their teammates? Do they care about the evaluations? Do they think the evalua-tions will accurately reflect each team-mate’s contribution to the project? Answers to these types of questions will provide a better understanding of the location’s effect on the evaluations.
While this study shows that location affects peer evaluations, it does not reveal a strong effect. Of the three scales that showed a significant difference, none of the differences in mean scores between the two locations exceed a value of .81 on a 10–point scale (see Table 3). Consequently, instructors can be assured that, regardless of which location they use to gather the peer eval-uations, the results they get will be fair-ly close to each other. However, it is not clear at this point which location is gen-erating the more valid evaluations. I sus-pect that the evaluations conducted out-side the classroom are less susceptible to peer interference and time con-straints, but these assumptions need to be verified.
It may be unnecessary to conduct peer evaluations outside of the class-room if instructors can provide condi-tions inside the classroom that allay any fears and time problems that students
may experience. When conducting eval-uations inside the classroom, the instructor, for example, could do the fol-lowing to put the students at ease: (a) tell students that the only person who will be allowed to view the evaluations is the instructor; (b) prior to administer-ing the evaluations, tell students to sit far away from any of their teammates; (c) give students ample time to provide their evaluations; and (d) have students place the peer evaluations in a sealed envelope prior to submitting them to the instructor. If all of these conditions are met, one would think that the evalua-tions conducted inside the classroom would be very similar to those collected outside of it.
Future researchers may wish to examine how peer evaluations are affected by other factors that, up until this time, have been largely overlooked. For example, how are peer evaluations affected by confidentiality procedures? Should students be allowed to read how other students have rated them? If stu-dents know that their peer ratings are not confidential, will this knowledge affect the ratings they give their team-mates? Future researchers may also wish to investigate how peer evaluations are affected by the manner in which the evaluations are to be used. Some instructors, for example, use peer evalu-ations to reward good performers and to punish poor performers, while others use the evaluations only to punish poor performers. How do students want the peer evaluations to be used and how does their use affect the evaluations? Classroom experiments that manipulate the confidentiality and use of peer rat-ings could answer these questions.
NOTE
The author thanks the JEBeditor and reviewers for their constructive and supportive comments. He also thanks his wife, Susan, for entering the data in the computer program and for assisting him with word processing.
Correspondence concerning this article should be addressed to Curt Dommeyer, Department of Mar-keting, College of Business and Economics, 18111 Nordhoff Street, Northridge, California 91330.
E-mail: curt.dommeyer@csun.edu
REFERENCES
Beatty, J. R., Haas, R. W., & Sciglimpaglia, D. (1996). Using peer evaluations to assess indi-vidual performances in group class projects.
Journal of Marketing Education, 18(2), 17–27.
TABLE 5. The Effect of Evaluation Location on Item Completion Rate in Percentages
Inside Outside
Type of item classroom classroom Difference in
(No. of items) (n= 131) (n= 84) % p
Open-ended 85.5 91.7 6.2 .20a
(1) Answered Answered
Rating scale 99.82 99.87 .05 .78b
(45) Answered Answered
aDetermined with the Fisher’s Exact Test. bDetermined with the independent-samples ttest.
Brooks, C. M., & Ammons, J. L. (2003). Free rid-ing in group projects and the effects of timrid-ing, frequency, and specificity of criteria in peer assessments. Journal of Education for Busi-ness, 78, 268–272.
Chen, Y., & Hao, L. (2004). Students’ perceptions of peer evaluation: An expectancy perspective.
Journal of Education for Business, 79,
275–282.
Clark, G. L. (1989). Peer evaluations: An empiri-cal test of their validity and reliability. Journal of Marketing Education, 11(3), 41–58. Cook, R. W. (1981). An investigation of student
peer evaluation on group project performance.
Journal of Marketing Education, 3(1), 50–52. Deeter-Schmelz, D. R., & Ramsey, R. (1998).
Stu-dent team performance: A method for class-room assessment. Journal of Marketing Educa-tion, 20,85–93.
Denton, H. G. (1994). Simulating design in the world of industry and commerce: Observations from a series of case studies in the United King-dom. Journal of Technology Education, 6(1),
1045–1064.
Dommeyer, C. J. (1986). A comparison of the individual proposal and the team project in the marketing research class. Journal of Marketing Education, 8(1), 30–38.
Druskat, V. U., & Wolff, S. B. (1999). Effects and timing of developmental peer appraisals in self-managing work groups. Journal of Applied Psy-chology, 84(1), 58–74.
Falchikov, N. (1995). Peer feedback marking: Developing peer assessment. Innovations in Education & Training International, 32(2), 175–187.
Fox, S., Ben-Nahum, Z., & Yinon, Y. (1989). Per-ceived similarity and accuracy of peer evalua-tions. Journal of Applied Psychology, 74(5), 781–786.
Freeman, K. A. (1996). Attitudes toward work in project groups as predictors of academic
per-formance. Small Group Research, 27(2),
265–282.
Grieb, T., & Pharr, S. W. (2001, Fall). Managing free-rider behavior in teams. Journal of the Academy of Business Education, 2(Fall), 37–47. Haas, A. L., Haas, R. W., & Wotruba, T. R. (1998). The use of self-ratings and peer ratings to eval-uate performances of student group members.
Journal of Marketing Education, 20(3), 200–209.
Johnson, D. W., & Johnson, R. T. (1984). Struc-turing groups for cooperative learning. The Organizational Behavior Teaching Review, 9(4), 8–17.
Johnson, C. B., & Smith, F. I. (1997). Assessment of a complex peer evaluation instrument for team learning and group processes. Accounting Education, 2, 21–40.
Macpherson, K. (1999). The development of crit-ical thinking skills in undergraduate superviso-ry management units: Efficacy of student peer
assessment. Assessment and Evaluation in
Higher Education, 24, 273–284.
McLaughlin, M., & Fennick, R. (1987). Collabo-rative writing: Student interaction and response,
Teaching English in the Two-Year College, 14, 214–216.
Park, R. C., & Kristol, D. S. (1976). Student peer evaluations. Journal of Chemical Education,
53,177–178.
Pfaff, E., & Huddleston, P. (2003). Does it matter if I hate teamwork? What impacts student atti-tudes toward teamwork. Journal of Marketing Education, 25,37–45.
Strong, J. T., & Anderson, R. E. (1990). Free-riding in group projects: Control mechanisms and pre-liminary data. Journal of Marketing Education, 12,61–67.
Williams, D. L., Beard, J. D., & Rymer, J. (1991). Team projects: Achieving their full potential. Journal of Marketing Education, 13(2), 45–53.