Piece Rates
Evidence from the Midwest Logging Industry
M. Ryan Haley
a b s t r a c t
Using rm-level payroll data from the Midwest logging industry, I com-pute a worker’s productivity response to a change in piece-rate pay, an elasticity of effort, using an empirical specication developed in Paarsch and Shearer (1999). Maximum-likelihood estimation of an agency-based structural econometric model of worker choice yields elasticities ranging from 0.413 to 1.507. These estimates are smaller than, but qualitatively similar to, those reported in Paarsch and Shearer, suggesting that their model has perhaps more general applicability than their British Columbia tree-planting example.
I. Introduction
Recently, researchers contributing to the human-resource literature have written a number of papers in which the incentive effects thought to be inherent in pay-for-productivity mechanisms are identied and estimated. One such paper, Paarsch and Shearer (1999), investigates the incentive effects of piece-rate pay using a rich rm-level data set from the British Columbia tree-planting industry. Paarsch and Shearer frame their inquiry by rst considering reduced-form regression tech-niques that yielded negative elasticity estimates, a counter-intuitive result suggesting
M. Ryan Haley is an economics graduate student at the University of Iowa. This is a revised version of research contained in his second-year paper submitted in partial fulllment of the requirements for the Ph.D. in the economics department at the University of Iowa. The author would like to thank Harry J. Paarsch, Charles H. Whiteman, Bruce Shearer, John Pencavel, and an anonymous referee for their helpful comments and useful suggestions. He is also grateful to Craig Barnes and the many foresters, loggers, and rm representatives who were kind enough to aid in his data-collection efforts. The data used in this article can be obtained beginning April 2004 through March 2007 from M. Ryan Haley, Department of Economics, University of Iowa, Iowa City, Iowa 52242.
[Submitted June 2001; accepted May 2002]
ISSN 022-166XÓ2003 by the Board of Regents of the University of Wisconsin System
the importance of controlling for variables that affect both piece rates and productiv-ity such as job-site conditions. Since job-site conditions were unobservable, Paarsch and Shearer, following Grossman and Hart (1983), constructed a decision theoretic structural econometric model that accounted for the relationship between planting conditions and piece rates, thus permitting consistent estimation of an elasticity of effort.
A common objection to the use of rm-level data is that the results are not general. I examine the sensitivity of the results of Paarsch and Shearer by applying their model to data gathered from the logging industry of the Midwest United States. My results are qualitatively similar to those of Paarsch and Shearer, suggesting their model is somewhat more general than a case study. Quantitatively my results differ: Loggers respond more modestly to changes in the piece rate than do tree planters. In the next section I discuss briey the Midwest logging industry and the unique rm-level data set I have constructed. In Section III, I describe the reduced-form regression model initially employed by Paarsch and Shearer, and then highlight its failure to estimate an elasticity of effort. In Section IV, I outline an alternative: The nonlinear structural econometric model developed in Paarsch and Shearer, which I estimate and discuss in Sections V and VI.
II. Planting Seedlings and Harvesting Trees
In the Paarsch and Shearer paper, workers are paid a per-tree-planted piece rate, a payment scheme aimed at increasing productivity by directly linking worker effort and earnings. In the United States, most notably in the South and the Midwest, logging rms employ a labor-intensive logging technology, commonly called a ‘‘strip cutter,’’ that ts well into this same pay-for-productivity framework. Strip cutters are of particular relevance for a comparison study not only because of how they are paid, which is by per-log piece rate, but because their output is easily measured, they work independently, they are not unionized, and they each use the same production process.
The strip cutter, like a tree planter, performs simple yet physically demanding tasks: he fells, limbs, tops, measures, crosscuts, stacks, and counts. Felling refers to cutting the tree down and ‘‘limbing’’ is the process of severing the limbs ush with the trunk. When the logger has limbed to where the tree is approximately 3.5 inches thick, the unmarketable crown is cut off, or, in the parlance of a lumberman, the tree is ‘‘topped.’’ Next the logger measures the limbless trunk into 100-inch lengths and crosscuts at the corresponding points. Finally, the logger stacks the logs into small piles. The only tools needed to successfully complete these tasks are a chain saw, a crude measuring device (usually a slender sapling that has been relieved of its bark), and physical effort.
A. Data
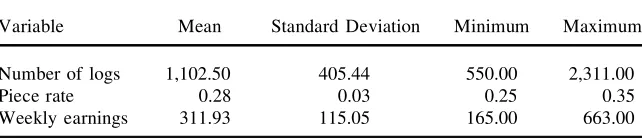
Table 1
Summary Statistics: Weekly Earnings above Minimum-Wage Weekly Earnings
Variable Mean Standard Deviation Minimum Maximum
Number of logs 1,102.50 405.44 550.00 2,311.00
Piece rate 0.28 0.03 0.25 0.35
Weekly earnings 311.93 115.05 165.00 663.00
Sample size5231.
are measured in cents per 100-inch log and the number of such logs is the measure of productivity. The panel spans 18 months, beginning the rst week of 1997 and ending the last week of May 1998, with a short discontinuity from late January to early March 1997 due to heavy snowfall. Observing eleven workers over ten separate contracts yielded 310 observations. Paarsch and Shearer truncated their data at the daily minimum wage; similarly, I eliminated all observations with weekly earnings less than $165.1 Additionally, workers observed fewer than seven times were
dis-carded because estimating worker-specic effects would be unreliable in such cir-cumstances. After these screens, 231 observations for seven workers over eight tracts remain; in Table 1, I summarize these data.
III. Reduced-Form Regression Estimates
A natural empirical specication for estimating the elasticity of mean output with respect to changes in the piece rate is the following log-log regression model:
(1) logYit5bi01b1logrit1Uit
whereYitis weekly production of 100-inch logs for workerion tractt,ritis worker
i’s piece rate on tractt,bi0is a (possibly worker-specic) constant term, andUitis a mean-zero innovation term assumed to be uncorrelated with the piece rate. Within this frameworkb1represents the elasticity of mean output with respect to the piece
1. For the rst half of the sample the minimum wage was $4.75; during the second half of the sample (starting 1 September 1997) the minimum wage was raised by theFair Labor Standards Actto $5.15. However, the 1997 change brought with it a ‘‘subminimum’’ wage for workers less than 20 years of age equal to $4.25, applicable for the rst 90 days of employment. I chose a 35-hour week as per discussions with rm representatives. The calculation is as follows:
353
1
$5.151$4.25 2 1$4.75
Table 2
Regression Results
(a) Without Individual-Speci c Effects (b) With Individual-Speci c Effects
Independent Variable (a) (b)
Constant 6.473 6.219
(0.255) (0.230)
Logarithm of piece rate 20.373 20.380
(0.201) (0.178)
Maximum individual-specic effect 0.445
(0.057)
Minimum individual-specic effect 0.004
(0.118)
R-squared 0.014 0.312
Standard errors are in parentheses below the point estimate. Sample size5231.
rate. In Table 2, I summarize the regression results. Elasticity estimates obtained with and without individual-specic indicator variables (20.380 and20.373) are similar in sign, magnitude, and signicance to their counterparts reported in Paarsch and Shearer (20.893 and20.858). However, all these estimates are counter-intu-itive: Productivity should not fall when piece rates rise. What can explain this?
Paarsch and Shearer argue that the piece rate is a function of job-site conditions; discussions with ofcials from both the tree-planting (Paarsch and Shearer) and strip-cutting (myself) industries veried this dependence. In fact, a site is viewed before setting the piece rate to ensure that working conditions are reected in the pay sched-ule. For example, logging in dense undergrowth or in timber with high limb retention requires more effort per log than harvesting in a well-maintained plantation; the piece rate must adapt to these realities. Failing this, workers may be reluctant to accept logging contracts. Specication 1 fails to control for this relationship, hence violating the weak exogeneity of the covariates, a standard regression assumption.2
Paarsch and Shearer address this problem by formalizing the interaction between job-site conditions and piece rates within a decision theoretic model of worker effort.
IV. Theoretical Model
Given that a logger has decided to work on a particular harvesting site, how much effort should he expend? Assume the logger has preferences over
2. In particular, omitted tract characteristics (which show up inUit) are correlated with the piece rate,
two quantities: Earnings Wand effort E. Let him maximize some utility function
Here, worker aptitude is captured byk.
Assume a logger produces logs Yaccording to a Leontief production technology consisting of his labor, a chain saw, and an effort level. Mimicking job-site condi-tions is a productivity shock S which is distributed lognormal with meanm and variances2. Generally,
Y5ESmin(labor,saw) Choosing units appropriately,
Y5ES
The timing of the model is as follows:
1) The rm views a tract, evaluates conditions such as terrain, species, density, and quality, then bids;
2) The rm offers a contract consisting of average cutting conditionsmt, vari-ability in cutting conditionss2
t, and a piece ratert; 3) The worker accepts or rejects the contract;
4) If the worker accepts, he is assigned to a subsection of the tract;
5) The worker inspects his work area and chooses an effort level; and
6) Finally, the rm observes the worker’s output and pays him according to the conditions of the contract.
The denitions above imply the logger is behaving as if he is solving
max,E.U(W,E)5W2
kEh
h
subject to W 5rES
The solution, in the notation of Paarsch and Shearer, is an optimally chosen value
eofEas a function of the realized values of the productivity shockS:
(2) e5
1
rsk
2
g
g5 1
h21
Then use Equation 2 to write
(3) y5
1
rk
2
g
V. Identication and Estimation Strategies
To estimate the empirical specication, I follow Paarsch and Shearer by rst considering a log-log version of Equation 3:
logy5glogr2glogk1(g11)logs
or, in terms of random variables, worker-specic indexi, and tract-specic indext, (4) log Yit 5glogrt2glogki1(g11)log Sit
Rewriting Equation 4 as
(5) log Yit 5glogrt2glogki1mt(g11)1(g11)(logSit2mt)
means that if the model is correct, the error termUitin Equation 1 comprises the tract-specic effectmt(g11) (which is correlated withrt) and the random component (g11)(log Sit 2mt). Because there is perfect collinearity between the vector of piece rates and the set of tract-specic indicators (deriving from the fact that piece rates do not vary on a specic tract), estimation based on Equation 5 cannot sepa-rately identify the effects of different piece rates and different tracts. Since themts are a necessary part of the model, and since they are unobservable, an identifying restriction is needed. Paarsch and Shearer note that there is additional information to be exploited in the fact that the least-able worker accepts contracts. Combining the logarithm of the expected-utility constraint of this least-able worker,
u¯5E(S
allowsmt(g11) to be written in terms of the other parameters of the problem:
(6) mt(g11)5logu¯2
(g11)2s2
t
2 2(g11)logrt1glogkh1log(g11) Substituting Equation 6 into Equation 5 yields an equation that identies the marginal effect of the different piece rates:
(7) Y*it 5log(g11)1g(logkh2logki)2
thevariabilityofY*it; it is by exploiting this nonlinear dependence that an elasticity
deriving the likelihood function is straightforward.
Note thatY*it requires a measure of reservation utility. While Paarsch and Shearer use zero-effort welfare payments, I am constrained to nd an alternative because Midwest welfare laws prohibit effort subsidies. Instead, I assume that zero-effort subsidies ‘‘exist’’ in the same proportion to the minimum wage in both locales. This ratio equals ($27.05/ $48.00) per day in Canada, suggesting that a zero-effort subsidy, if one existed in the Midwest, would be approximately $92.98 per week.3
A. Calculations and Results
Following Paarsch and Shearer I rst estimated a version of Equation 7 with all the
kisset equal to a common valuek; the restricted parameter set is then {g,s1, . . . ,
s8}.4The tract-specic moments and the elasticitygare estimated using the method
of maximum likelihood; the results are collected in Table 3, Column a. Of the eight tracts, only the minimum, maximum, and average tract-specic variances are in-cluded. The estimate ofgis 2.364, suggesting an elastic worker response to changes in the piece rate.
Estimation of the full parameter set, {g,ki¹h,sj:i51, 2, . . . ,7;j51, 2, . . . , 8}, which controls for worker-specic effects, produces a lower elasticity estimate equal to 1.507, suggesting that a 1 percent increase in the piece rate above its mean results in a 1.507 percent increase in productivity.5In terms of logs, raising the piece
rate 1 cent above its mean of 28 cents results in 36 more logs being harvested. Paarsch and Shearer report a similar effect: controlling for individual-spec ic abil-ities reduces their estimate from 5.876 to 2.135. Additionally, both studies show a signicant increase in the logarithm of the likelihood function, suggesting that the individual effects are jointly signicant; in Table 3, Column b, I summarize these results.
3. Note that the ratio of prices obviates the need to distinguish between currencies. The calculation is as follows:
$27.05 $48.00<
$92.98 $165.00
4. This assumption reduces Equation 7 to Equation 5 in Paarsch and Shearer. Note also that, given these parameter estimates, Equation 6 could be used to estimate [mt(g11)2glogk] fort51, 2, . . . , 8.
Then, if desired, one of themtscould be normalized (say, to zero); this permits recovery of an estimate
ofkthat can then be used in Equation 6 to estimate the remainingmts.
Table 3
Parameter Estimates and Sensitivity Analysis (a) Without Individual-Speci c Effects (b) With Individual-Speci c Effects (c) Sensitivity Analysis Estimates
Parameter (a) (b) (c)
g 2.364 1.507 0.413
(0.089) (0.362) (0.204)
Maximums 0.131 0.206 0.366
Minimums 0.074 0.072 0.127
Averages 0.101 0.128 0.227
Maximum individual-specic effect 0.421 1.535
Minimum individual-specic effect 0.010 0.037
Average individual-specic effect 0.159 0.580
Log-likelihood function 281.070 227.160 227.160
Standard errors are in parentheses below the point estimate. Sample size5231.
B. Prediction
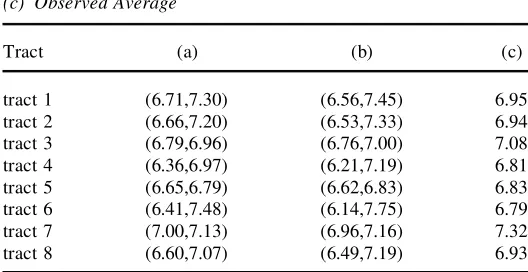
In order to evaluate the model’s performance I predict the average weekly output of logs for each contract using the parameter estimates from the structural model. In Table 4, I compare the actual mean productivity per contract to the corresponding 95 percent and 99 percent prediction intervals. At the 95 percent level, ve of the eight intervals contain the observed mean; at the 99 percent level six of the eight intervals contain the observed mean. These prediction results contrast with those reported by Paarsch and Shearer where only seven and nine of the 31 contracts contained the observed mean for the 95 percent and 99 percent prediction intervals. This difference may be due in part to the larger sample size found in Paarsch and Shearer.
C. Rent
Table 4
Prediction Results: Logarithm of Average Productivity of 100-inch Logs
(a) 95 Percent Condence Intervals (b) 99 Percent Condence Intervals (c) Observed Average
Tract (a) (b) (c)
tract 1 (6.71,7.30) (6.56,7.45) 6.95
tract 2 (6.66,7.20) (6.53,7.33) 6.94
tract 3 (6.79,6.96) (6.76,7.00) 7.08
tract 4 (6.36,6.97) (6.21,7.19) 6.81
tract 5 (6.65,6.79) (6.62,6.83) 6.83
tract 6 (6.41,7.48) (6.14,7.75) 6.79
tract 7 (7.00,7.13) (6.96,7.16) 7.32
tract 8 (6.60,7.07) (6.49,7.19) 6.93
Sample size5231.
D. Sensitivity Analysis
By appealing to the inverse relationship between the reservation level of utility and the elasticity estimate, a strategy for approximating a lower bound on the elasticity emerges. This can be accomplished by using the minimum wage as the measure of alternative utility. Using this strategy, Paarsch and Shearer estimate the lower bound on the elasticity for tree planters to be 0.767. Assuming weekly minimum earnings to be $165 per week, I estimate a lower bound equal to 0.413, suggesting that a 1 percent increase in the piece rate above its mean results inat least a 0.413 percent increase in production of logs; further details are collected in Table 3, Column c.
VI. Discussion and Conclusion
Since harvesting trees is considerably more dangerous (both in frequency and sever-ity of injury) than planting trees, a logger will be more apprehensive about increasing his pace than will a tree planter for a given increase in the piece rate.
References
Grossman, Sanford, and Oliver Hart. 1983. ‘‘An Analysis of the Principal Agent Prob-lem.’’Econometrica 51(1):7– 45.