Full Terms & Conditions of access and use can be found at
http://www.tandfonline.com/action/journalInformation?journalCode=cbie20
Download by: [Universitas Maritim Raja Ali Haji] Date: 18 January 2016, At: 19:30
Bulletin of Indonesian Economic Studies
ISSN: 0007-4918 (Print) 1472-7234 (Online) Journal homepage: http://www.tandfonline.com/loi/cbie20
Survey of recent developments
Thee Kian Wie & Siwage Dharma Negara
To cite this article: Thee Kian Wie & Siwage Dharma Negara (2010) Survey of recent developments, Bulletin of Indonesian Economic Studies, 46:3, 279-308, DOI: 10.1080/00074918.2010.522500
To link to this article: http://dx.doi.org/10.1080/00074918.2010.522500
Published online: 23 Nov 2010.
Submit your article to this journal
Article views: 240
View related articles
ISSN 0007-4918 print/ISSN 1472-7234 online/10/030279-30 © 2010 Indonesia Project ANU DOI: 10.1080/00074918.2010.522500
* The authors thank Heath McMichael for contributing box 1 of this article. The views expressed in the box are the author’s alone and have no oficial status or endorsement.
SURVEY OF RECENT DEVELOPMENTS
Thee Kian Wie and Siwage Dharma Negara*
Indonesian Institute of Sciences (LIPI), Jakarta
SUMMARY
Little has happened to dispel concern that reform momentum is dissipating. New National Economic and Innovation Committees to help accelerate development will probably achieve little: resolving many key economic policy issues is straightforward technically, so the real obstacle to doing so is lack of political will and leadership.
It appears that economic growth has stabilised rather than continuing to accel-erate. Investment is still strong, but iscal policy is no longer providing a stimu -lus. Soeharto-era attachment to small budget deicits remains evident in the 2011 budget, which persists in spending heavily on subsidies at the expense of invest-ment in sorely needed infrastructure. The demand for net exports had temporarily constrained growth, but by Q2 2010 this was no longer the case. Manufacturing has been in the doldrums, partly because of surging export commodity prices and vol-umes, but its recent growth seems more promising. International reserves continue to accumulate because of the commitment of Bank Indonesia (BI) to avoiding rupiah appreciation, which makes monetary policy dificult and costly to implement. BI has responded by allowing some appreciation, an acceleration of inlation and a small increase in the interest rate on its certiicates of deposit, and by forcing banks to place more funds with it at low or zero interest. At last it has begun to tighten monetary policy, but this is likely to increase capital inlow, despite the introduction of a new capital control. The incompatibility of BI’s monetary and exchange rate policies will therefore continue to cause problems. Rapid rice price inlation, however, is not the fault of the central bank, but a consequence of the policy of preventing Indonesia from participating more fully in the world rice market.
Oficial indicators suggest that the banking sector is in good condition. One con -cern is that interest margins are too high, which seems to be attributable to inef-iciency in government-owned banks. If pressure to prevent or roll back increased foreign ownership of Indonesian banks is successful, this is likely to make the banking system even less eficient. Indonesia continues to have dificulty compet -ing for foreign investment with comparator countries such as Thailand, Vietnam and Brazil: much remains to be done to improve the climate for doing business. The government appears to be pondering more serious approaches to tackling the problem of Jakarta’s congestion, although conlicting signals on this have emerged. Solutions are seen in expansion of transport infrastructure and improvement of its management, and in the introduction of electronic tolling on main roads.
POLITICAL DEVELOPMENTS New and continuing disappointments
Little has happened in recent months to overcome the disappointment of those who had hoped that the overwhelming election victory of President Susilo Bam-bang Yudhoyono (SBY) in 2009 would encourage him to move much more deci-sively to reform the way government is run in Indonesia (Tomsa 2010, in this issue). Events of the last 12 months have in fact reinforced fears that his second term of ofice will be less reform-oriented than his irst, not least because of his seemingly close relationship with his former minister, Aburizal Bakrie – one of Indonesia’s richest individuals and chair of the powerful Golkar Party. Bakrie is perhaps best known to the wider public as the man behind the company whose drilling operations are alleged to have triggered the emergence of a mud vol-cano that has devastated the lives of thousands of families in East Java (box 1). Although the plight of the victims of this disaster has largely receded from the public gaze, several high-proile intellectuals have quietly protested at the com-pany’s apparent indifference to it by returning, or refusing to accept, ‘Bakrie Awards’ from The Freedom Institute, established and funded by Aburizal Bakrie. These include the respected professor of philosophy, Franz Magnis-Suseno; Goenawan Mohamad, author and former editor of Tempo magazine; and, more
recently, renowned poet Sitor Situmorang and Soeharto-era education minister Daoed Yusuf (Tempo Weekly, 9–15 August 2010).
Those who had applauded the president’s anti-corruption drive were also dismayed at the pardons or reduced prison terms given to several senior gov-ernment oficials convicted of corruption, including one freed on ‘humanitarian grounds’ because of alleged poor health. Critics noted that such treatment would considerably lessen the deterrent effect of convictions, thus setting back the ight against corruption.
The National Economic and Innovation Committees
Perhaps to allay doubts about his resolve to achieve signiicant progress in his second term, on 20 May 2010 Yudhoyono signed Presidential Regulations 31 and 32/2010 establishing a National Economic Committee (Komite Ekonomi Nasional, KEN) and a National Innovation Committee (Komite Inovasi Nasional, KIN) to support the cabinet in its efforts to accelerate economic development (Jakarta Post, 16/6/2010). KEN brings together some 24 experts in various economic ields, including several high-proile business people. It is chaired by Chairul Tanjung, a prominent entrepreneur, and the respected academic economist Chatib Basri is deputy chair.
KIN has 30 members, including several university rectors and the heads of the Indonesian Institute of Sciences and the Agency for the Assessment and Appli-cation of Technology. Its chair is Professor Zuhal, the research and technology minister under former President Habibie. Although its membership also includes prominent business people, this second committee contains a greater proportion of academics. Both committees are expected to undertake detailed analyses of policy issues, and to provide recommendations on them to the government.
KEN is required to make recommendations in eight areas: the overall design of the current state budget; a ‘grand design’ for ‘economic connectivity’ at the national level; how to achieve 7% economic growth that is ‘inclusive’, ‘balanced’
Box 1 The Lapindo MudfLow: a disasTer in sLow MoTion
The disastrous BP oil spill in the Gulf of Mexico in early 2010 featured prominently in news broadcasting around the world for weeks, contrasting starkly with the all but forgotten Lapindo mudlow in Sidoarjo, East Java (McMichael 2009). Whereas the US government has held BP fully accountable and forced it to take responsibility for solving the problem, the Indonesian government has been unwilling to hold PT Lapindo Brantas to its obligation under Presidential Decree 48/2008 to compensate the victims in full. More than four years after mud began oozing from its hydrocarbon well site, questions surrounding the environmental impact, victim compensation and the broader economic ramiications continue to mount. According to the government’s Mudlow Handling Agency (Badan Penanggulangan Lumpur Sidoarjo, BPLS), the rate of mud extrusion has declined from 100,000 m3 to 10,000 m3 per day since the beginning of 2010.a Nevertheless, incidents such as the sudden subsidence of a house into a sink hole (Jawa Pos, 3/6/2010) suggest continuing geological instability. There are fears that a subterranean chamber may have developed under the affected area as a result of the extrusion of mud (Jawa Pos, 27/5/2010), although this is discounted by BPLS. The US Geological Service has promised the Indonesian Vulcanology Service the loan of seismological apparatus that might be able to throw some light on the cause and possible longevity of the mudlow.
The composition of the mud being channelled into the Porong River is another worry, with French and Japanese authorities believed to be concerned about chemical residue levels in prawn imports from hatcheries in East Java, many of which are located along the coast to the east of the mudlow.b The oficial response appears confused. While the East Java provincial government is believed to harbour plans to establish oil palm plantations on silt deposited around the mouth of the Porong River, President Yudhoyono suggested on a recent visit to Sidoarjo that the mudlow should be promoted as a tourist attraction.
While most of the land for new transport links to the west of the mud volcano has been acquired, speculation is delaying the purchase of the remaining land needed for work to start. Meanwhile, the secondary road through the town of Porong to the south of the mudlow is heavily congested, and the bridge over the Porong River is deteriorating. It is estimated that although Rp 10.5 trillion is required for relocation of the transport corridor to the west,c plus Rp 15 trillion for resettlement of affected communities,d the national government spent only Rp 1.1 trillion in 2008 and a further Rp 1.14 trillion in 2009 on rehabilitation work (Jakarta Post, 30/5/2010). Of the 13,000 households affected, around 7,000 have received partial compensation (in the form of money, goods and housing);e but only 20% of the total compensation promised by Lapindo Brantas has actually been paid. Despite a wealth of independent expert opinion to the contrary, the company, controlled by the family of Golkar Party chair Aburizal Bakrie, continues to deny responsibility for the disaster, maintaining that the mudlow is a natural calamity (Jakarta Post, 30/7/2010). Its efforts to inluence public debate on the issue suffered a setback recently with the failure in July 2010 of its executives to win the election for district head (bupati) and deputy head of Sidoarjo (Jakarta Post, 31/7/2010). The question of legal liability remains unresolved, notwithstanding rejection of early appeals against the company in the Supreme Court in May 2009.
One local observer has claimed that the mudlow caused the loss of 300,000 jobs and led to a 1% downturn in provincial GDP (Radar Surabaya, 29/5/08), while the impact on property values in the Sidoarjo area has been catastrophic (BI 2007). Nevertheless, East Java’s GDP growth is presently close to the national average at around 6% p.a., and business conidence appears strong. Foreign investors Nestlé and Holcim recently announced plans to expand their production facilities in the province (Indonesia Today, 7/9/2010).
Heath McMichael Department of Foreign Affairs and Trade, Canberra
aInterview: Mr Sofian Hadi, BPLS, Surabaya, 9 July 2010.
b Interview: Mr Johan Suryadarma, Indonesian Frozen Seafood Association, Surabaya, 8 July 2010. c Interview: Professor Soebagyo, former member, Sidoarjo Mudlow Council of Experts, Sura
-baya, 12 July 2010.
d Interview: Mr Hadi Prasetyo, East Java Development Planning Agency, Surabaya, 13 July 2010. e Interview: Mr Dan Phelps, US Consulate-General, Surabaya, 9 July 2010.
and environmentally friendly; more effective poverty reduction; job creation and unemployment reduction; food and water security; energy security; and domestic sources of inance (GOI 2010a). In relation to the budget, the president empha-sised reduction of Indonesia’s foreign debt in the long run, even though this is already low by international standards, and although the interest rate on non-commercial debt is signiicantly lower than that on domestic borrowing. In rela-tion to connectivity, SBY’s emphasis was on expediting the movement of output to the domestic market by improving national logistics; surprisingly, he did not mention the importance of also moving export products speedily and eficiently to and through the ports, and of reducing the cost of bringing inputs to factories. From the outset KEN was greeted with scepticism, given concern about the integrity of some members and the populist leanings of others. From a differ-ent perspective, the committee is reminiscdiffer-ent of the National Economic Council (Dewan Ekonomi Nasional, DEN) established by former President Abdurrah-man Wahid, which also advised the government on economic policy issues. DEN was ineffective because the president and his ministers simply disregarded its suggestions. Like DEN, KEN is an advisory body with no policy-making author-ity, and it will not be surprising if it, too, proves to have little impact. Several of the most important current economic policy issues are relatively straightforward in a technical economic sense, and the only obstacle to their resolution is political will and leadership. It seems doubtful that a committee with no political power will be able to overcome such obstacles. Thus it is reasonable to infer that KEN has been established as a means of further delaying hard decisions, rather than of discovering what the right decisions are. Like the ‘irst 100 days’ plan of the second SBY administration (Patunru and Von Luebke 2010: 24–7), this commit-tee’s establishment seems a cosmetic exercise, whose purpose is not to achieve anything concrete, but rather to create the impression that the president is com-mitted to doing so.
KIN has been asked to provide recommendations on how to strengthen the ‘national innovation system’ and develop a ‘national innovation culture’. The thinking behind this is discussed by Zuhal (2009), who argues in favour of achiev-ing the ‘synergy of the triple helix’ – involvachiev-ing the business sector as the party that stands to beneit from innovations by the academic community (universities and research institutes), with the government as the facilitator and regulator of this process. He sees an effective national innovation system as intensifying the circulation and exchange of knowledge between private irms and state-owned enterprises (SOEs) on the one hand and universities and research institutes on the other. Yet experience in highly innovative countries such as South Korea and Taiwan has shown that these industry–academia linkages have not involved the respective governments at all (Eom and Lee 2009).
There is considerable overlap with KEN, as KIN is expected to give priority to innovations in the ields of food, water and energy security. In addition, it is required to focus on a disjointed collection of ields including biotechnology, man-ufacturing, infrastructure technology, transport, the defence industry, processing technology for agriculture and isheries, and management of natural disasters. More generally, it is expected to contribute to the development of lifestyles that are more environmentally friendly, to fostering intellectual curiosity, to ighting infectious diseases, and to encouraging entrepreneurship with a view to creating
job opportunities. It does not seem unreasonable to describe this as a scattergun approach.
Given KIN’s diverse membership of academics, senior government oficials and entrepreneurs, few of whom appear to have signiicant experience with innovation, it is doubtful that KIN will generate much by way of feasible and meaningful recommendations. Indeed, the premise that it is ‘necessary for inno-vation to be undertaken in a planned, integrated and coordinated manner within a uniied national innovation system’ – a view that is in keeping with the regula-tory propensities of senior oficials dating back to their time in the New Order administration – is extremely dubious. It is hard to imagine any empirical basis for such an assertion. In reality, most innovation is the outcome of unconnected individuals and irms striving to ind less costly ways to do things and new and useful things to do, notwithstanding a small number of counter-examples from the public sector.
MACROECONOMIC DEVELOPMENTS Growth
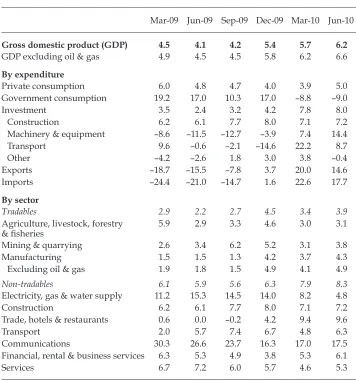
Indonesia’s GDP growth remains robust, despite concern about volatility in global inancial markets as European countries struggle with debt problems. Year-on-year (y-o-y) GDP growth has accelerated continuously since Q2 2009 to reach 6.2% in Q2 2010 (table 1a). On the basis of its performance in the last two quarters, the economy seems likely to surpass the 2010 budget’s projected growth rate of 5.8%.
The increase in GDP through Q2 2010 relects increasingly strong contributions from private consumption expenditure and investment. Since private consump-tion accounts for a little under 60% of GDP, it has contributed strongly to overall GDP growth, even though its growth rate has been below that of GDP for the last three quarters. Government consumption declined markedly in the irst two quarters of 2010, in strong contrast to its rapid growth in the preceding 12 months. The impact of this on GDP growth was slight, however, because this component of aggregate demand is relatively small. Investment growth was much more robust in the irst two quarters of 2010 than previously. Growth of construction spending – by far the major component of investment – has been consistently high, but there has been a strong upturn of investment in the smaller compo-nents – machinery and equipment, and transport. This suggests that investors have become more conident about Indonesia’s prospects since its economy came through the global inancial crisis (GFC) largely unscathed. Baird and Wihardja (2010: 147) noted that y-o-y growth of imports began to exceed that of exports in Q1 2010. This was also the case in Q2, so that net export growth has continued to contribute negatively to GDP growth.
One explanation for this is appreciation of the rupiah (igure 1), which makes Indonesia’s products less competitive, thus encouraging imports and discourag-ing exports. Real appreciation of the rupiah appears to be due mainly to high prices for commodity-based exports; the widening gap between the real and the nominal exchange rates relects Indonesia’s high inlation relative to its trading partners. A further explanation is that accelerating growth generates increases in the demand for imported goods. Despite the switch in growth rates of imports and exports, the absolute level of exports is still considerably higher, while Indonesia’s
international reserves are very high and continuing to rise. These data therefore provide no cause for concern.
On the production side, the non-tradables sector continued to grow faster than tradables – indeed, more than twice as fast in the year to Q2 2010. Non-tradables growth was robust in all sub-sectors in the irst half of 2010, although there was signiicant deceleration in the utilities component. Annual growth of the electricity, gas and water supply sector had declined by more than two-thirds in Q2 2010 from a year earlier, which is disappointing given the enormous potential for further expansion in these ields. There is considerable public concern about the poor qual-ity of these services – particularly the unreliabilqual-ity of electricqual-ity supplies and the low safety standards applying to canisters used to deliver liquid petroleum gas to households. Explosions have been widely reported in recent months, with dozens
TABLE 1a Components of GDP Growth (2000 prices; % year on year)
Mar-09 Jun-09 Sep-09 Dec-09 Mar-10 Jun-10
Gross domestic product (GDP) 4.5 4.1 4.2 5.4 5.7 6.2
GDP excluding oil & gas 4.9 4.5 4.5 5.8 6.2 6.6
By expenditure
Private consumption 6.0 4.8 4.7 4.0 3.9 5.0
Government consumption 19.2 17.0 10.3 17.0 –8.8 –9.0
Investment 3.5 2.4 3.2 4.2 7.8 8.0
Construction 6.2 6.1 7.7 8.0 7.1 7.2
Machinery & equipment –8.6 –11.5 –12.7 –3.9 7.4 14.4
Transport 9.6 –0.6 –2.1 –14.6 22.2 8.7
Other –4.2 –2.6 1.8 3.0 3.8 –0.4
Exports –18.7 –15.5 –7.8 3.7 20.0 14.6
Imports –24.4 –21.0 –14.7 1.6 22.6 17.7
By sector
Tradables 2.9 2.2 2.7 4.5 3.4 3.9
Agriculture, livestock, forestry
& isheries 5.9 2.9 3.3 4.6 3.0 3.1
Mining & quarrying 2.6 3.4 6.2 5.2 3.1 3.8
Manufacturing 1.5 1.5 1.3 4.2 3.7 4.3
Excluding oil & gas 1.9 1.8 1.5 4.9 4.1 4.9
Non-tradables 6.1 5.9 5.6 6.3 7.9 8.3
Electricity, gas & water supply 11.2 15.3 14.5 14.0 8.2 4.8
Construction 6.2 6.1 7.7 8.0 7.1 7.2
Trade, hotels & restaurants 0.6 0.0 –0.2 4.2 9.4 9.6
Transport 2.0 5.7 7.4 6.7 4.8 6.3
Communications 30.3 26.6 23.7 16.3 17.0 17.5
Financial, rental & business services 6.3 5.3 4.9 3.8 5.3 6.1
Services 6.7 7.2 6.0 5.7 4.6 5.3
Source: CEIC Asia Database.
killed or injured by faulty gas equipment (Kompas, 9/8/2010). Strong non-tradables growth was attributable to the continuing robust performance of the construction, transport and communications sectors, boosted by a remarkable turnaround in the fortunes of the trade, hotels and restaurants sector – probably because fears about the GFC have receded. Growth of the cellular phone business has slowed some-what, resulting in steady deceleration of growth in the communications sector throughout 2009 to the new, lower (but still double-digit) level observed since Q4 2009. Such a slowdown was a predictable consequence of the ill–considered deci-sions of the Business Competition Supervisory Commission (Komisi Pengawas Persaingan Usaha, KPPU) in November 2007 in relation to competition and price-setting in this sector (Kong and Ramayandi 2008: 26).
Growth of tradables continues at a modest rate, although it is noteworthy that manufacturing, excluding oil and gas, grew by almost 5% y-o-y in Q2 2010, a much higher rate than had been recorded through most of 2009. This accelera-tion suggests improved prospects for the manufacturing sector, and is consist-ent with the recconsist-ent faster growth of investmconsist-ent in machinery and equipmconsist-ent. Indonesia has to some extent regained competitiveness in low–medium skilled labour-intensive manufacturing industries following rapid wage growth in China and Vietnam since 2008.
Focusing on the corresponding seasonally adjusted quarter-on-quarter (q-o-q) growth rates allows us to discern the most recent trends more clearly. These data
FIGURE 1 Real and Nominal Effective Exchange Rate of the Rupiaha (January 2009 = 100)
Jan-2009 May-2009 Sep-2009 Jan-2010 May-2010
40 60 80 100 120 140
REER NEER
a The nominal effective exchange rate (NEER) index represents the ratio of an index of the rupiah’s nominal exchange rate to a geometric weighted average of nominal exchange rates for the curren-cies of trading partner countries. The real effective exchange rate (REER) index adjusts the nominal effective exchange rate index for relative movements in the consumer price indices of the home country and trading partner countries. Increases indicate appreciation. See <http://www.imfstatis-tics.org/imf/IFSExcha.htm>.
Source: Authors’ calculations based on IMF data kindly supplied by the World Bank.
conirm that the economy has regained its growth momentum – achieving a signiicant improvement in the growth rate since mid-2009 – but also that the rate has stabilised over the last three quarters (table 1b). In other words, perfor-mance is consolidating rather than continuing to improve. This stability masks considerable volatility in the disaggregated q-o-q growth rates. Private consump-tion growth was steady in the irst half of 2010, while government consumpconsump-tion declined signiicantly. This suggests that the government now sees less need to support economic growth through iscal policy – probably because the minimal impact of the GFC on Indonesia has increased policy makers’ conidence in the economy. But despite the return to reasonably rapid growth, there is still a need
TABLE 1b Components of GDP Growth (2000 prices; seasonally adjusted; % quarter on quarter)
Mar-09 Jun-09 Sep-09 Dec-09 Mar-10 Jun-10
Gross domestic product (GDP) 1.1 1.1 1.3 1.6 1.5 1.6
GDP excluding oil & gas 1.2 1.2 1.4 1.7 1.6 1.6
By expenditure
Private consumption 1.7 0.4 1.2 0.7 1.5 1.4
Government consumption 7.1 1.5 –0.4 0.4 –4.8 –2.0
Not seasonally adjusted –28.7 23.7 –0.4 33.2 –44.4 23.5
Investment –1.2 0.6 2.8 1.9 2.3 0.8
Construction 1.8 1.6 2.1 1.8 1.5 1.8
Machinery & equipment –11.1 –1.4 8.1 1.4 –0.7 5.1
Transport –16.1 4.2 6.6 –3.5 4.9 –4.1
Other –2.9 2.5 3.2 0.2 –2.3 –1.5
Exports –14.7 5.9 7.1 7.2 –1.2 1.1
Imports –14.6 4.8 4.6 8.2 3.3 0.7
By sector
Tradables 0.9 0.7 0.9 1.1 0.8 0.9
Agriculture, livestock, forestry
& isheries 1.3 0.6 0.9 1.0 0.7 0.9
Mining & quarrying 1.2 0.7 2.4 0.4 –0.4 0.7
Manufacturing 0.9 0.8 0.9 1.4 0.5 1.3
Excluding oil & gas 1.2 1.1 1.1 1.2 1.1 1.2
Non-tradables 0.7 1.7 1.7 2.0 2.2 2.2
Electricity, gas & water supply 3.7 3.7 1.8 2.4 1.0 1.6
Construction 1.8 1.6 2.1 1.8 1.5 1.8
Trade, hotels & restaurants –3.5 2.0 2.4 3.3 1.4 2.3
Transport 2.4 1.8 1.3 1.2 0.6 3.1
Communications 4.0 5.0 5.5 1.0 4.6 5.5
Financial, rental & business services 0.8 0.6 1.4 0.9 2.3 1.3
Services 1.9 1.7 0.9 1.2 1.0 2.0
Source: CEIC Asia Database.
for considerably more spending on infrastructure – not to provide a short-term iscal stimulus, but rather to increase economic capacity in the future. Ideally, slow or negative growth in government consumption would be accompanied, therefore, by an acceleration of government investment in infrastructure.
The seasonally adjusted q-o-q data on investment are quite volatile, with the most recent growth rate falling to one-third of its March quarter level. Construc-tion growth has been relatively stable through the June quarter, but there was a huge jump in the growth rate for machinery and equipment, and an even larger movement – but in the opposite direction – for transport. The quarterly growth of imports has been less volatile than that of exports, and by Q2 2010 exports were again growing more rapidly than imports. No clear patterns emerge from the data on quarterly growth by sector, except that most of the increase in growth overall is attributable to increases in the growth rate of non-tradables. Surprisingly, the acceleration of non-oil and gas manufacturing growth evident in the yearly ig-ures is not apparent in the quarterly data.
Weak performance of the manufacturing sector
This and several previous surveys have noted slower growth in the tradables sector (deined to include agriculture, livestock, forestry, isheries, mining and manufacturing) than in non-tradables since the Asian inancial crisis (AFC). Table 2 summarises this phenomenon, focusing on the growth rates of key sec-tors in two periods, 1984–97 (pre-AFC) and 2000–09 (post-AFC).1 As is well known, average GDP growth has been somewhat slower in the latter period, but the truly remarkable feature of these data is the dramatic decline in growth of the manufacturing sector, from 11.6% p.a. before the AFC to only 4.5% after it. Manufacturing was the major engine of economic growth in the earlier period (although it was well supported by the construction sector from the late 1980s). Manufacturing growth was concentrated in low-skill, labour-intensive, export-oriented industries (Thee 2001), the expansion of which contributed greatly to the observed decline in poverty, by providing vastly expanded job opportunities for low-productivity workers. The severe decline in growth of this kind of manu-facturing is now hampering the government’s efforts to reduce poverty further (Rahardja and Ing 2010).
It has been argued that the major challenge facing the manufacturing sector is to develop institutional arrangements that ensure a reasonably predictable and stable commercial environment (Bird and Hill 2006: 356–7) in order to attract more investment. Earlier, other writers recommended that the manufacturing sector should emphasise the development of industrial technological capabili-ties (ITCs) to complement its traditional reliance on abundant and cheap labour and natural resources (HIID 1995; Lall and Rao 1995). This view relected a con-cern that the initial impetus generated by policy reforms in the 1980s – which signiicantly reduced the anti-export bias of the trade regime – could not be sus-tained. Despite these recommendations, it was later found that Indonesia’s manu-factured exports, unlike those of South Korea and Taiwan, continued to rely on cheap labour rather than improved ITCs, relecting a lack of innovative capability
1 The other non-tradables sectors are very small relative to construction and trade, so are not shown in the table.
(Thee and Pangestu 1998). Moreover, in the wake of the AFC, many manufactur-ing irms had neither the funds nor the inclination to try to raise their competitive-ness by investing in ITCs.
Given Indonesia’s natural resource wealth, changes in world commodity prices are also important in determining the performance of manufacturing. The drastic decline in oil prices in the mid-1980s resulted in real depreciation of the rupiah, providing a strong competitive stimulus to the production of all other tradables
TABLE 2 GDP Growth by Key Sectors Before and After the Asian Financial Crisis (AFC)a
(% p.a.)
Tradables Non-tradables
GDP Agriculture Mining Manufacturing Construction Trade
Pre-AFC
1984 7.0 4.2 6.3 22.1 –4.4 3.4
1985 2.5 4.3 –9.6 11.2 2.6 5.0
1986 5.9 2.6 5.4 9.3 2.2 8.1
1987 4.9 2.1 0.4 10.6 4.2 7.2
1988 5.8 4.9 –2.9 12.0 9.5 9.1
1989 7.5 3.3 4.9 9.2 11.8 10.7
1990 7.2 2.0 5.2 12.5 13.5 7.1
1991 7.0 1.6 10.2 10.1 11.3 5.4
1992 6.5 6.7 –1.9 9.7 10.8 7.3
1993 8.5 –4.3 3.8 15.7 14.4 9.6
1994 7.5 0.6 5.6 12.4 14.9 7.6
1995 8.2 4.4 6.7 10.9 12.9 7.9
1996 7.8 3.1 6.3 11.6 12.8 8.2
1997 4.7 1.0 2.1 5.3 7.4 5.8
Average 6.5 2.6 3.0 11.6 8.8 7.3
Post-AFC
2000 5.0 0.9 5.2 5.4 5.6 7.7
2001 3.6 3.3 0.3 3.3 4.6 4.0
2002 4.5 3.5 1.0 5.3 5.5 4.3
2003 4.8 3.8 –1.4 5.3 6.1 5.5
2004 5.0 2.8 –4.5 6.4 7.5 5.7
2005 5.7 2.7 3.2 4.6 7.5 8.3
2006 5.5 3.4 1.7 4.6 8.3 6.4
2007 6.4 3.5 1.9 4.7 8.5 8.9
2008 6.0 4.8 0.7 3.7 7.5 6.9
2009 4.6 4.1 4.4 2.1 7.1 1.1
Average 5.1 3.3 1.3 4.5 6.8 5.9
a ‘Agriculture’ includes agriculture, livestock, forestry and isheries. ‘Trade’ includes wholesale and retail trade, hotels and restaurants.
Sources: CEIC Asia Database.
and helping to generate the rapid growth of labour-intensive manufacturing. A similar process has been happening – but in reverse – since the AFC, although now a wider range of commodity prices is at work. The share of tradables in GDP (in nominal terms) has been quite stable (at around 51–56%) over the last decade, even though their value has grown much more slowly than that of non-tradables, implying that the prices of tradables have been increasing relative to those of non-tradables. This can be seen, for example, in the fact that the prices and total values of exports of commodities such as crude palm oil and coal – now two of Indonesia’s major commodity exports – have increased dramatically since the turn of the century, reversing the real depreciation in the 1980s caused by falling oil prices, and putting pressure on manufactured exports such as garments and textiles, and electronics (Basri and Rahardja 2010).
The budget
In circumstances in which a iscal stimulus would have been appropriate, both revenue and spending fell short of planned levels in the revised budget for 2009. Since the shortfall was greater for expenditures, the budget deicit was much smaller than planned (table 3). The stimulus was therefore weaker than intended. In 2010 it is hoped to turn this around, with revenue projected to increase by 17% and spending by 20% (not shown in the table); this would result in a much larger deicit than in 2009, but a very manageable one. The government is optimistic that the business climate has returned to normal, which should permit a large rise in tax revenue. Whether it can overcome obstacles to increasing its own spending remains to be seen, however.
On 16 August 2010 the president announced the proposed budget for 2011. Some observers felt that the projected deicit of 1.7% of GDP was too conserva-tive, and would have preferred to see a larger public spending boost for the econ-omy that might generate higher growth and reduce unemployment more rapidly. Indeed, the assumed 6.3% growth rate for 2011 does not appear particularly ambi-tious. But it seems that the ‘balanced-budget mentality’ that characterised policy making in the Soeharto era – and which was perfectly compatible with rapid eco-nomic growth – still has considerable attraction for the government, even though it is now prepared to run relatively small deicits.
Within total planned expenditure of Rp 1,202 trillion, the government has allo-cated some Rp 122 trillion for capital expenditure, which would represent a 28% increase on the 2010 budget. Most of this expenditure is intended to improve basic infrastructure. It encompasses some of the larger items included in the National Medium-term Development Plan for 2010–14, such as increasing electricity gen-eration capacity by 3,000 MW per year (including 5,000 MW from geothermal power plants), building 19,370 km of roads, and developing integrated inter-island and inter-mode transport networks (Tuwo 2010).
It is notable that capital spending came in 3.4% over the revised budget tar-get in 2009, and that the revised 2010 tartar-get, if achieved, would represent a fur-ther 25% increase over the 2009 outcome. Clearly the government is trying hard to increase infrastructure spending. But according to Vice President Boediono, Indonesia needs to spend at least Rp 2,000 trillion on infrastructure develop-ment in the next ive years, whereas the governdevelop-ment’s own iscal capacity can only cover about one-ifth of that amount. The big challenge, therefore, is for the
TABLE 3 Budgets for 2009, 2010 and 2011 (Rp trillion)
2009 2010 2011
Revised Actual Realised
(%) Revised Proposed Change (%)
REVENUES & GRANTS 871.0 848.9 97 992.5 1,086.3 9.5 Domestic revenues 870.0 847.2 97 990.6 1,082.6 9.3
Tax 651.9 620.0 95 743.4 839.5 12.9
Domestic 631.9 601.3 95 720.8 816.4 13.3
Income tax 340.2 317.6 93 362.2 414.5 14.4
VAT 203.1 193.1 95 263.0 309.3 17.6
Other 88.6 90.6 102 95.6 92.6 -3.1
International trade taxes 20.0 18.7 94 22.6 23.1 2.2
Non-tax 218.1 227.2 104 247.2 243.1 –1.7
Natural resource revenues 138.7 139.0 100 164.7 158.2 –3.9 Proits of state-owned enterprises 28.6 26.0 91 29.5 26.6 –9.8 Revenue from public service centres 5.9 8.4 142 9.5 14.9 56.8
Other 44.9 53.8 120 43.5 43.4 –0.2
Grants 1.0 1.7 170 1.9 3.7 94.7
EXPENDITURES 1,000.8 937.4 94 1,127.2 1,202.0 6.6 Central government 691.5 628.8 91 782.6 823.6 5.2
Personnel 133.7 127.7 96 162.7 180.6 11.0
Material 85.5 80.7 94 112.6 131.5 16.8
Capital 73.4 75.9 103 95.0 121.7 28.1
Interest 109.6 93.8 86 105.7 116.4 10.1
Subsidies 158.1 138.0 87 202.3 184.8 –8.7
Energy 99.9 94.5 95 144.0 133.8 –7.1
Fuel 52.4 45.0 86 88.9 92.8 4.4
Electricity 47.5 49.5 104 55.1 41.0 –25.6
Non-energy 58.2 43.5 75 58.3 51.0 –12.5
Grants expenditure 0.0 0.0 0.2 0.8 300.0
Social expenditure 77.9 73.8 95 71.2 61.5 –13.6
Other 53.3 38.9 73 32.9 26.3 –20.1
Transfers to regions 309.3 308.6 100 344.6 378.4 9.8
DEFICIT 129.8 88.5 68 134.7 115.7 –14.1
(% of GDP) 2.4 1.6 66 2.2 1.7
FINANCING 129.8 112.6 87 133.7 115.7 –13.5
Domestic inancing 142.6 125.0 88 133.9 118.7 –11.4 Foreign inancing (net) –12.7 –12.4 98 –0.2 –3.0 1,400.0
BASIC ASSUMPTIONS
Nominal GDP 5,425 5,613 6,254 7,007
GDP growth (%) 4.3 4.5 5.8 6.3
Inlation (%) 4.5 2.8 5.3 5.3
Exchange rate (average Rp/$) 10,500 10,408 9,200 9,300 SBI interest rate (average %) 7.5 6.6 6.5 6.5
Crude oil price (average $/barrel) 61 62 80 80
Oil production (average ’000 barrels/ day)
960 950 965 970
Source: MOF (2010).
government to attract substantial private sector funds to ill this gap (Kompas, 30/9/2010).
It is a matter for concern that investment in infrastructure has still to return to levels recorded before the AFC. In 1997, total public and private investment in public infrastructure was around 7% of GDP. Since 2000, however, Indonesia has typically allocated less than 4% of its GDP to infrastructure development (Armas 2010). The government’s own iscal capacity for infrastructure spend-ing has been heavily constrained, while private investment in infrastructure has virtually come to a halt for various reasons. Dificulty in getting access to the land required is frequently cited as the main obstacle, but this is a political rather than a legal problem. The government has the power of eminent domain, which enables it to seize land required for such purposes (and requires it fully to compensate those involved). The problem appears to lie either in the abil-ity of inluential individuals to hold out for excessive compensation, or in the unwillingness of governments to pay fair market value. Moreover, it is very dif-icult to attract private sector participation in infrastructure development when coordination between different levels of government is poor and policy uncer-tainty remains high.
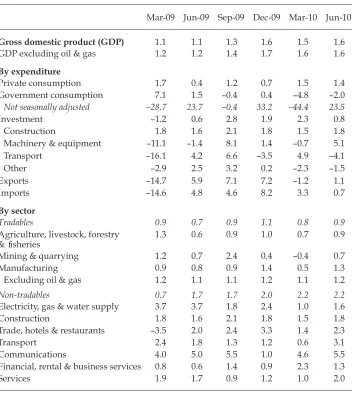
The most obvious way to accommodate increased spending on infrastructure would be to reduce wasteful and inequitable subsidies, especially for energy use. Figure 2 compares the costs of these subsidies with expenditure on infrastruc-ture. Energy subsidies amounted to 13% of total government spending in 2010, while spending on infrastructure was only around 8%, so there is ample room to increase infrastructure spending signiicantly without increasing the deicit, sim-ply by re-allocating funds away from energy subsidies.
FIGURE 2 Spending on Infrastructure and Energy Subsidiesa (% of total expenditures)
2009 2010 2011
0 4 8 12 16
Infrastructure Energy subsidies
a All capital spending in the budget is assumed to be on infrastructure.
Source: MOF (2010).
Total expenditure on subsidies is projected to fall by nearly 9% in 2011 (table 3), with reductions in both electricity and non-energy subsidies (including those on fertiliser and rice). On the other hand, given the increase in the international crude oil price, from an average of $62/barrel in 2009 to around $75 in Q3 2010, and the government’s reluctance for political reasons to raise the domestic prices of petroleum products, the fuel subsidy has been adjusted upward from Rp 69 tril-lion originally to Rp 89 triltril-lion in the revised 2010 budget – an increase of almost 100% over the 2009 outcome. In the budget for 2011 this subsidy is projected to reach Rp 93 trillion, based on an assumed average world crude oil price of around $80 per barrel.
The rather modest planned decline in total subsidies is not encouraging in view of the government’s professed intention, in its medium-term development strategy, to remove subsidies. Indeed, this is proving to be politically dificult. In March 2010 the government said it intended to eliminate fuel and electricity sub-sidies by 2014. It planned to raise electricity tariffs by 15% in stages during 2010 and 2011, but in September it yielded to demands by the parliament to annul its plans to increase tariffs further in 2011 (Jakarta Globe, 25/9/2010). This decision was a setback to the state electricity company (Perusahaan Listrik Negara, PLN), which badly needs tariff increases, since the subsidy it receives from the govern-ment will be reduced by 25% in 2011.
This development is a further reminder of the high level of uncertainty about Indonesia’s energy policies and, in particular, of how readily the government tends to give in to political pressure. In July 2010 it increased the basic electric-ity tariff in order to reduce the energy subsidy. The increase was 18% for house-holds (excluding small customers), 12–16% for non-manufacturing businesses and 6–15% for manufacturers. The Indonesian Textile Producers Association responded by threatening that around 160,000–240,000 workers from the textiles and garments industries would be laid off unless the government revised the tar-iff increase (Kompas, 16/7/2010). This was almost certainly a gross exaggeration, as a World Bank (2010) report showed that electricity bills comprised only about 5% of the total production costs of most medium and large manufacturing irms, including those in labour-intensive industries such as textiles and garments. The impact of the tariff hike on the business sector would probably therefore be rela-tively mild. Regrettably, the government responded to the threat by ordering PLN to settle this issue through negotiations with the business sector.
The textile association’s response is shortsighted, because all irms suffer to some extent from the unreliability of electricity supplies. PLN is highly unlikely to be able to improve its service in an environment of increasing costs and decreas-ing subsidies. Unfortunately, the government has yet to convince the public that increases in electricity tariffs are a necessary condition for inancing proper main-tenance and new investment by PLN.
Balance of payments, monetary policy and inlation Balance of payments
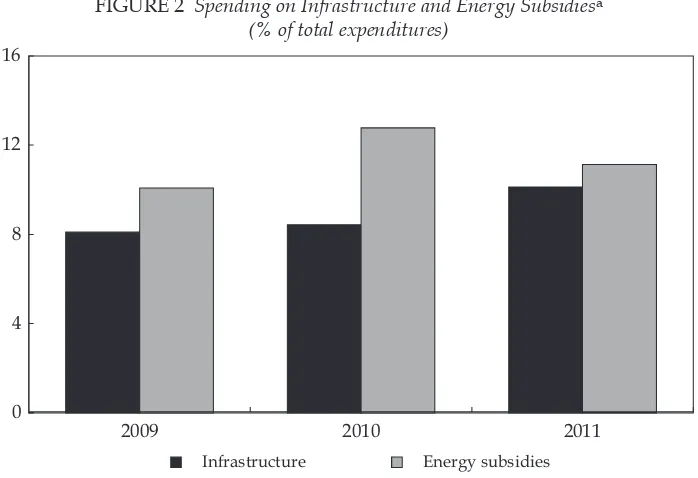
The absolute values of most items in the current account of Indonesia’s balance of payments show fairly consistent upward trends in 2009–10 (table 4). The igures for the merchandise trade balance – being the difference between numbers of sim-ilar size – are of course quite volatile, so large quarterly changes in them have little
economic signiicance. The declines in the current account in the irst two quarters of 2010 relect imports growing more rapidly than exports, as already noted.
By contrast, there is much greater volatility in the inancial account. Foreign direct investment was more than three times higher in the irst half of 2010 than in the same period of 2009. Portfolio investment increased even more dramatically from mid-2009 through to Q1 2010, before falling sharply in Q2. Not too much should be made of this, however, because other investment changed by almost as much in the opposite direction owing to a large decline in foreign debt repay-ments relative to loan disburserepay-ments.
The aggregate inancial account data reveal a signiicant inlow in every quarter shown in the table except Q2 2009, when the low was negative. The strong inan-cial account is in line with credit rating agencies’ increasingly optimistic assess-ments of Indonesia’s fundamentals and outlook. Because of Indonesia’s quick recovery from the GFC, the Japan Credit Rating Agency upgraded its sovereign rating from BB+ to BBB– with stable outlook, or investment grade, on 13 July 2010
TABLE 4 Balance of Payments ($ billion per quarter)
Mar-09 Jun-09 Sep-09 Dec-09 Mar-10 Jun-10
Current account 2.5 2.5 2.2 3.6 2.1 1.8
Exports 24.2 28.1 31.3 35.9 35.0 37.8
–Non-oil & gas 20.5 23.8 25.6 29.1 28.5 30.8
–Oil & gas 3.6 4.4 5.7 6.8 6.5 7.0
Imports 17.3 19.8 22.8 24.5 26.6 28.8
–Non-oil & gas 15.2 17.3 19.0 20.8 22.1 23.8
–Oil & gas 2.1 2.4 3.8 3.7 4.5 5.0
Merchandise trade balance 6.9 8.4 8.5 11.4 8.4 9.0
–Non-oil & gas 5.3 6.4 6.6 8.4 6.5 7.0
–Oil & gas 1.6 1.9 1.8 3.0 2.0 1.9
Services –2.7 –3.3 –3.5 –4.5 –3.6 –3.7
Income –2.7 –3.8 –4.1 –4.6 –3.9 –4.6
Current transfers 1.1 1.2 1.2 1.3 1.2 1.2
Capital & inancial account 1.6 –1.8 2.5 1.3 4.3 3.3
Capital account 0.0 0.0 0.0 0.0 0.0 0.0
Financial account 1.6 –1.9 2.5 1.3 4.3 3.3
–Direct investment 0.5 0.4 0.5 0.6 1.7 1.2
–Portfolio investment 2.0 1.9 3.0 3.5 6.2 1.1
–Other investment –0.8 –4.1 –1.0 –2.9 –3.6 1.0
Errors & omissions –0.1 0.4 –1.1 –0.9 0.3 0.3 Overall balance 4.0 1.1 3.5 4.0 6.6 5.4 Memo item
Reserve assets($ billion) 54.8 57.6 62.3 66.1 71.8 76.3
Source: CEIC Asia Database.
(Jakarta Post, 14/7/2010). Other agencies, including Moody’s, Fitch, and Standard and Poor’s, have also upgraded Indonesia’s sovereign rating (BI 2010a). Improved ratings mean a lower country risk premium and thus reduced costs of inancing for both public and private sector investments.
Exchange rate and monetary policies
With both the current account and the capital and inancial account in surplus, the balance of payments overall has also been in surplus, so Indonesia’s reserve assets have been increasing steadily, reaching nearly $87 billion by September 2010 (BI 2010a). It is misleading to portray this as an indication of sound economic performance, however. Rather, it should be seen as the logical consequence of the central bank’s policy of attempting to assist producers of tradables (exports and import substitutes) by preventing or reducing appreciation of the rupiah. This policy of continuously purchasing foreign exchange has important consequences for the conduct of monetary policy.
Bank Indonesia’s foreign exchange purchases result in an increase in the sup-ply of base money that needs to be sterilised to avoid having an inlationary impact. For this reason, Bank Indonesia (BI) has also been issuing large quantities of its certiicates of deposit (SBIs), the effect of which is to decrease the supply of base money. But the interest rate paid on SBIs is considerably higher than the rate received on US government securities, so the more BI invests in international reserves, the greater its losses from this negative spread. Aware of the problem, BI naturally seeks to reduce these losses. One way to do so is to allow at least some nominal appreciation of the currency, so that the exchange rate falls below the ‘ideal’ level (Wahyuni 2010).2 Another is to issue smaller quantities of SBIs, result-ing in less than complete sterilisation of foreign exchange purchases. This means that the supply of base money begins to rise more rapidly, which in turn leads to an increasing rate of inlation. Higher inlation results in real exchange rate appreciation, but provided the nominal exchange rate is held roughly constant, this does not attract the same level of criticism from tradables producers or the government as does nominal appreciation. A third means by which the central bank can reduce its losses is to undertake sterilisation by forcing banks to increase their zero- or low-interest deposits at BI – that is, their ‘required reserves’ – as an alternative to inducing them to hold SBIs bearing market interest rates.
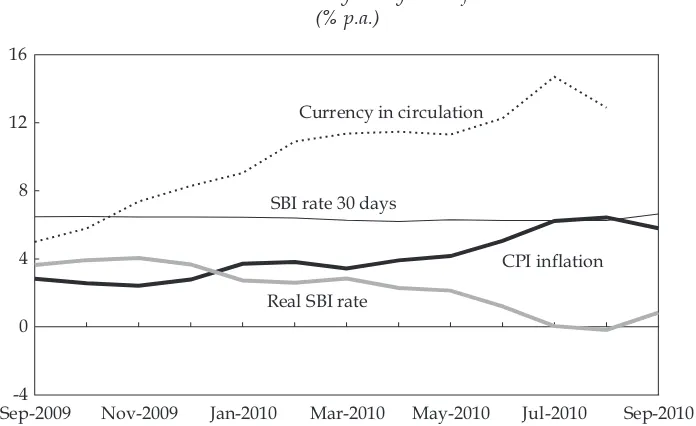
Consumer price index (CPI) inlation has been accelerating almost continuously since November 2009 (igure 3). Despite this, BI chose not to tighten its monetary policy – perhaps judging the increase in inlation to be transitory. The growth rate of base money (proxied by currency in circulation in igure 3) was allowed to rise steadily as BI backed away from sterilising its purchases of foreign exchange. The nominal interest rate on SBIs actually declined slightly, while increasing inlation
2 Our interview with senior staff of BI revealed that the central bank would prefer to keep the exchange rate in the range Rp 9,000–9,200/$. More recently, the inance minister voiced concern that the rupiah had appreciated to below Rp 9,000/$ (Kompas, 9/8/2010). Although numerous commentators are reported to favour Rp 9,000/$ as the lower limit of acceptability, this level is essentially arbitrary. Those who are concerned about the com-petitiveness of Indonesian tradables seem unaware that this depends on the real, not the nominal, exchange rate.
caused the real rate to decline so far as to become slightly negative in August 2010. In short, unnoticed by most commentators, monetary policy became increasingly loose during this period. More recently, however, with the inlation rate having broken out of the 4–6% target band for 2010, BI appears to have decided to tighten its policy. The rate on 30-day SBIs was increased from 6.26% in August to 6.64% in September – that is, from slightly below the so-called ‘policy rate’ of 6.5% to slightly above it – helping to achieve a signiicant deceleration of money growth.3 Although there is no one-to-one correspondence between money growth and inlation in the short term, the inlation rate did fall back slightly in September.4
Of course, increasing the SBI rate encourages additional capital inlow by widening the differential between domestic and international rates. A senior BI oficial we interviewed expressed concern about the ‘destabilising’ effect of ‘hot’ short-term capital inlows that result from foreign investors looking for quick
3 This provides further conirmation that the ‘policy’ rate is a iction, since it does not ap-ply to any instrument in the market (Kuncoro, Widodo and McLeod 2009: 160–1). 4 BI is considering redenomination of the currency, in view of the inconvenience of hav-ing to undertake transactions, calculations and book-keephav-ing in thousands or millions of rupiah. One new rupiah would be equal in value to, say, 1,000 of the current rupiah, and the public would be free to exchange old for new at this rate over a period of perhaps three years (BI 2010b). The key to success will be to persuade the public that this will not harm them inancially.
FIGURE 3 Monetary Policy and Inlationa (% p.a.)
Sep-2009-4 Nov-2009 Jan-2010 Mar-2010 May-2010 Jul-2010 Sep-2010 0
4 8 12 16
Currency in circulation
SBI rate 30 days
CPI inflation
Real SBI rate
a Currency in circulation is used as the indicator of money supply in preference to base money because of the distorting impact of occasional changes in banks’ minimum reserve requirements on the effective supply of base money; currency is the major component (about 75%) of base money. The growth rate shown has been smoothed based on the 3-month moving average values to clarify the underlying trend. The real SBI (Bank Indonesia Certiicate) rate is approximated by the nominal rate less the contemporaneous CPI inlation rate.
Source: CEIC Asia Database.
speculative gains from buying and selling SBIs. In order to limit this specula-tive behaviour, BI had imposed a mild capital control from June 2010 by requir-ing investors to hold SBIs for at least one month. What is actually happenrequir-ing, however, is not buying and selling of SBIs, but buying and holding. In its attempt to help tradables producers, BI has been unwittingly providing a very attractive arbitrage opportunity to investors, at its own expense. The gain to investors con-tinues as long as they hold SBIs, because of the domestic–foreign interest rate dif-ferential. The ‘problem’ is not one of destabilisation, therefore, but of intensiied pressure for appreciation of the currency, and the cost to BI of trying to prevent this. Moreover, although appreciation creates problems for tradables producers, it is beneicial to the Indonesian people as a whole, precisely because of its down-ward impact on tradables prices.
By mid-August 2010, investors’ holdings of one-month SBIs had fallen to zero from Rp 37 trillion in June. But during the same period, their holdings of six-month SBIs had increased almost as much, from Rp 74 trillion in June to Rp 105 trillion as of 13 August 2010 (Reuters, 20/8/2010); BI did not offer any one-month
SBIs in its auction on 8 September. The limited capital control therefore appears to be having little or no impact on investors’ appetite for rupiah-denominated assets, so BI is still faced with the huge cost of its exchange rate policy. Accordingly, the newly appointed governor, Darmin Nasution, has announced that BI wants to reduce the use of the interest rate as its instrument to control ‘excess liquidity in the banking sector’ (Kompas, 18/9/2010), and so would increase the commercial banks’ minimum reserve requirement from 5% to 8% by 1 November 2010; this is expected to reduce ‘excess liquidity’ by Rp 350–370 trillion. By ‘excess liquidity’ the governor was actually referring to the banks’ holdings of SBIs, rather than to the recent excessive growth of base money discussed above.5 His announce-ment made no announce-mention of the fact that BI’s own policy of accumulating foreign exchange reserves was the indirect cause of the banks’ heavy investment in SBIs, or that the increase in reserves was intended to cut the cost to itself of this policy.
In addition to increasing the minimum reserve requirement, BI will also require commercial banks to raise their loan-to-deposit ratios (LDRs) to within the range 78–100% by 1 March 2011; those failing to do so will be penalised by having to meet even higher minimum reserve requirements. This is portrayed as an attempt to get the banks to lend more of their deposits to the business sector, which seems surprising, because bank lending has been growing at an annual rate approaching 20%, or about 14% in real terms – more than twice the growth rate of the economy. It would seem very risky to ask the banks to do more. But low LDRs are largely the result of banks investing heavily in SBIs – having been induced to do so by the attractive interest rates offered by the central bank itself – so this new policy also needs to be interpreted in terms of BI’s desire to stem the losses from having an exchange rate policy that is incompatible with its monetary policy.
Food prices
The overall change in the CPI is of course a weighted average of changes in a large number of individual prices. The price indices for most of the components
5 BI usually uses the term ‘liquidity’ to refer to banks’ reserves, which are a component of base money. SBIs are not.
of the CPI basket have been increasing quite slowly, while the index for pro-cessed food and beverages has been rising a little faster than the CPI. Prices of unprocessed foods have been increasing much more rapidly. Within this group the inlation of prices of cereals (mainly rice), cassava and related products has been extremely rapid – of the order of 20% or more per annum in Q3 2010. This is due to prolonged rain in many areas, which has seriously disrupted supply, and has seen rice traders hoarding their stocks in anticipation of the high prices that result from a poor harvest. In an attempt to control rice price escalation, Bulog, the national logistics agency, conducted market operations from the beginning of the Ramadhan (fasting) month in early August. The supply of cheap rice to the market had only a temporary impact, however (Kompas, 13/8/2010), owing to a lack of rice in Bulog’s own warehouses with which to conduct such operations. In August the price of rice was higher in Indonesia than in neighbouring countries. The local price of IR 64-II, a medium-quality rice, was $569 per tonne, while rice of similar quality in Thailand and Vietnam was priced at only around $425 and $372, respectively (Kompas, 27/8/2010). This difference is due to Indonesian gov-ernment restrictions on rice imports. In other words, rice prices have been much higher than necessary as a consequence of government policy. It was precisely to reduce the risks posed by unexpected negative shocks to domestic rice produc-tion that Dawe (2008) argued in favour of Indonesia diversifying its sources of supply by engaging fully with the world rice market.
Capital and foreign exchange markets
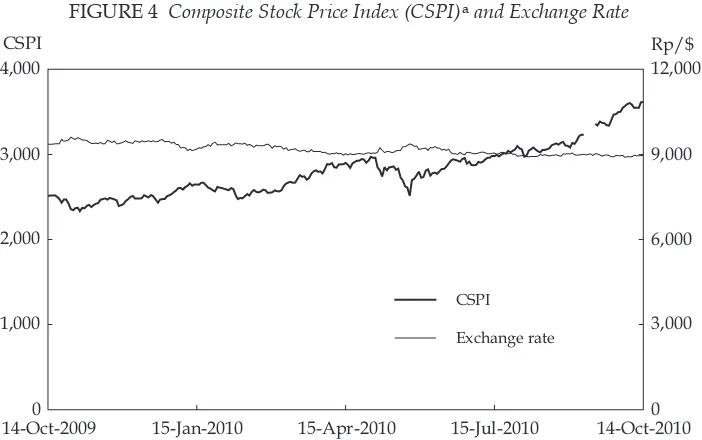
With most developed economies still to recover from the GFC, some develop-ing economies have become attractive markets for global investors. In the case of Indonesia, strong commodity prices and the increasing size of the domestic market, combined with political stability and earlier market-friendly reforms, have generated positive sentiment among foreign investors. The stock market has therefore performed strongly in the 12-month period shown in igure 4, despite a temporary setback in May 2010 in response to reformist inance minister Sri Mulyani’s departure from the cabinet (Baird and Wihardja 2010: 144–6). The IDX (Indonesia Stock Exchange) composite index quickly recovered these losses, increasing by 22% from the previous peak at the end of April through mid-October 2010, and by 44% year on year, such that market capitalisation reached Rp 2,919 trillion (approximately $325 billion) by the end of September. Foreign portfolio investment contributed signiicantly to these gains, with net purchases by foreign investors amounting to Rp 18 trillion (about $2 billion) in the 12 months to August 2010. BI’s policy of keeping the nominal exchange rate roughly constant while maintaining SBI interest rates high relative to rates offshore has made investing in Indonesian assets – including equities – highly attractive. Furthermore, its intro-duction of the requirement that investors hold their investments in SBIs for at least 28 days has prompted a shift into other assets, such as equities.
Strong foreign investor conidence in the capital market is necessarily relected in the foreign exchange market, although the outcome is distorted by central bank intervention. Contrary to its concern about ‘destabilising’ short-term capital inlows, BI has been able to keep the exchange rate remarkably stable (igure 4). The rupiah appreciated by about 4% against the dollar in the year to mid-October 2010, in part because the dollar weakened against other currencies owing to the
continuing pessimistic outlook for the US economy. US interest rates are very low by historical standards, which has encouraged ‘carry trade’: that is, borrowing dollars cheaply overseas and investing them in emerging market assets, resulting in massive capital inlows into emerging economies (Singh 2010).
BANKING SECTOR
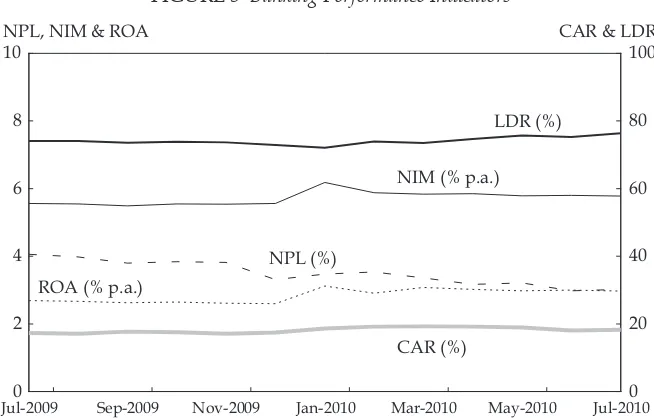
On the surface at least, the banking sector seems to be performing well. The aggre-gate reported capital adequacy ratio (CAR) remains well above the regulatory minimum (8%), and the percentage of non-performing loans (NPLs) declined sig-niicantly over the year to July 2010 (igure 5). The banks’ return on assets (ROA) increased somewhat during the same period, relecting a very small rise in the net interest margin (NIM). Moreover, lending growth has been increasing steadily, reaching 21.2% (y-o-y) by September 2010 (BI 2010a). However, with the memory of the Bank Century iasco still fresh (Baird and Wihardja 2010: 144), these tradi-tional bank health indicators need to be interpreted with caution. Bank Century had been ‘crippled at birth’, yet had been permitted by BI (which is responsible for bank supervision) to continue reporting a healthy balance sheet even though it was carrying some large assets that were clearly of little or no value (Nasution 2010). Despite the drawn-out and highly politicised inquiry into the case in the parliament, BI as an institution was virtually ignored, and seems to have avoided any consequences from its failure to enforce its own rules – despite the huge cost (of the order of $700 million) to the Indonesian people.
The LDR increased slightly during the 12-month period. When bank regula-tors in other countries irst began to focus on this ratio decades ago, the reason was a concern that sometimes it became dangerously high. This relected the
FIGURE 4 Composite Stock Price Index (CSPI)a and Exchange Rate
14-Oct-2009 15-Jan-2010 15-Apr-2010 15-Jul-2010 14-Oct-2010
0 1,000 2,000 3,000 4,000
0 3,000 6,000 9,000 12,000
CSPI
Exchange rate
CSPI Rp/$
a The stock exchange was closed for Lebaran (the week following the fasting month), 8–14 September.
Source: Indonesia Stock Exchange; Paciic Exchange Rate Service.
tendency of banks at the time to rely on funds purchased in the wholesale market, rather than on customers’ deposits, to fund their lending. The problem was that purchased funds were far more volatile, and many banks failed when market conditions changed and these short-term funds were suddenly withdrawn. In Indonesia today, however, the concern of the regulator is that the ratio is too low: that banks are not using enough of their deposits to lend to the business commu-nity. This is a macroeconomic, not a prudential, concern (that is, a concern about the contribution of the banking system to growth, rather than about the stability of the system). BI’s dubious rationale for trying to force an increase in the LDR has already been discussed above.
Indonesia’s banking sector has a considerably higher average NIM than do its regional counterparts, suggesting that it is relatively ineficient (table 5): the wide margin implies a high cost of the banking intermediation function relative to what is achieved elsewhere. One factor that will make this problem even worse is BI’s decision to increase the minimum reserve requirement for commercial banks, which increases the banks’ effective cost of funding by obliging them to place more funds at zero or low interest rates at the central bank, rather than using them for loans. The banks can be expected to pass this additional cost on to their customers by way of some combination of higher lending rates and lower deposit rates. Anticipating an increase in lending rates, BI also plans to require banks to announce their prime lending rate – the lending rate applied to prime (lowest-risk) customers – to the public (Kompas, 18/9/2010). It is hard to believe, however, that this would have much of an impact.
A recent World Bank study (World Bank/IFC 2009: 23–4) described Indonesia’s banking sector as a ‘medium concentration oligopoly’, because although there are
Jul-20090 Sep-2009 Nov-2009 Jan-2010 Mar-2010 May-2010 Jul-2010 2
4 6 8 10
0 20 40 60 80 100
NPL, NIM & ROA CAR & LDR
NIM (% p.a.)
NPL (%) ROA (% p.a.)
CAR (%)
LDR (%) FIGURE 5 Banking Performance Indicators
a NPL = non-performing loans; NIM = net interest margin; ROA = return on assets; CAR = capital adequacy ratio; LDR = loan-to-deposit ratio.
Source: CEIC Asia Database.
121 banks, a small number of them account for the bulk of total assets (igure 6). The 10 largest account for 64% of the total, and the top four alone for a little less than half (46%). Yet even the largest bank accounts for only about 14% of total assets, and the smallest of the top 10 for just over 2%. The vast majority of banks have only a tiny market share. Nevertheless, a senior economist at BI argued in an interview that this ‘oligopolistic’ structure may make it possible for the big players to engage in tacit collusion in order to keep their interest margins high.
If that is true, BI should perhaps be doing more to promote vigorous competi-tion, but its policy preferences appear to pull in the opposite direction. In 2004 BI launched its Arsitektur Perbankan Indonesia (Indonesia Banking Architecture) program, aimed at revitalising the country’s banking structure. In effect, the plan
FIGURE 6 Shares of Total Assets of the 10 Largest Banks, September 2009a (%)
Citibank BII Permata Panin Danamon CIMB Niaga BNI BCA BRI Mandiri
0 2 4 6 8 10 12 14 16
a Mandiri, BRI (Bank Rakyat Indonesia) and BNI (Bank Negara Indonesia) are state owned.
Source: BI (2009).
TABLE 5 Net Interest Margin (NIM) in ASEAN Countries, 2009 (% p.a.)
Country NIM
Indonesia 5.9
Philippines 3.9
Thailand 3.4
Vietnam 3.4
Malaysia 3.0
Singapore 1.8
Source: Kompas, 20/9/2010, <http://cetak.kompas.com/read/2010/09/20/03394699/eisiensi.perbankan. rendah>.
called for a bureaucratically driven restructuring of the industry that would result in a small number of large banks that would dominate, and a large number of small ones with a very limited scope of operations. The idea of encouraging all banks to compete with each other, and allowing the structure of the industry to be determined by the outcome of this competition, had no part in this plan. Rather, the emphasis was to be on mergers and take-overs of banks so as to reduce their number, despite the fact, still true, that ‘Indonesia needs more good banks, not speciic numbers of banks’ (Kenward 2004: 27).
An examination of net interest margins within Indonesia’s banking sector may shed light on the reasons for Indonesia’s low regional ranking on this indicator. The margins differ signiicantly across ownership types (table 6). The NIMs of foreign and joint foreign–domestic banks are much lower than the average NIM for all banks, while those of the small (non-foreign exchange) domestic banks and banks owned by the provincial governments are much higher. The state banks are somewhat above the average, and the larger (foreign exchange) domestic banks somewhat below it. In the top 10 group mentioned above, seven are either foreign or joint foreign–domestic, and the other three are state owned: Bank Mandiri, BRI (Bank Rakyat Indonesia, the Indonesian People’s Bank) and BNI (Bank Negara Indonesia, the State Bank of Indonesia). On this basis, it is hard to avoid the con-clusion that Indonesia’s high NIM is to a large extent a consequence of ineficient management of the provincial and state banks, which face much weaker incen-tives to perform well by virtue of having governments as their dominant share-holder.
Take-overs of domestic institutions by foreigners (table 7) have led to debate recently about the impact on the real sector of the increasing foreign ownership of banks. This has put political pressure on BI to limit foreign control in the bank-ing sector, even though it is clear from the law on Bank Indonesia that this is not its function: as its own website clearly states, ‘Bank Indonesia has one single overarching objective: to establish and maintain rupiah stability’. Nevertheless, the newly appointed governor has stated that he is committed to reforming the national banking architecture, and that one element to be reformed relates to for-eign ownership. At present there is no explicit regulation of this, so it has been relatively easy for foreign investors to gain majority control of domestic banks.
TABLE 6 Net Interest Margin of Indonesian Banks by Ownership Group, July 2010 (% p.a.)
Ownership Group NIM
Private domestic: non-foreign exchange (all small) 9.5
Provincial government 9.0
State 6.3
Private domestic: foreign exchange 5.3
Joint 3.8
Foreign 3.5
All banks 5.8
Source: CEIC Asia Database.
But it is not obvious why foreign owners or foreign banks should be treated differently. Indeed, the majority of fully or partly foreign-owned banks appear to be relatively well managed and eficient, which is precisely what the real sector requires. In any case, the degree of foreign ownership needs to be kept in proper perspective. As table 7 shows, most of the domestic banks taken over by foreign-ers account for only tiny shares of total banking system assets.
THE INVESTMENT CLIMATE
Given that Japan is one of Indonesia’s larger sources of foreign direct investment, it is possible to gauge the attractiveness of Indonesia as an investment destination from a survey, conducted annually by the Japan Bank for International Cooperation (JBIC), of Japanese manufacturing companies with offshore operations (JBIC 2008, 2009). Among other things, this survey ranks countries on the basis of respondents’ perceptions of medium-term prospects for their operations in each country (table 8). The survey results suggest that two factors dominate these perceptions: country size and geographic proximity. The world’s ive largest countries by population, and eight of the 19 largest (excluding Japan itself), made up the 10 most promis-ing in most years of the survey, and the other two – South Korea and Taiwan – are Japan’s closest neighbours; Malaysia also appeared on the list in 2004 and 2009.
TABLE 7 Foreign Ownership in Previously Domestically Owned Banks
Bank Foreign Owner Foreign
Share
Total Assetsa
% Rp trillion %
CIMB Niaga CIMB Group Sdn Bhd, Malaysia 77.0 100.7 4.29
Danamon Temasek Holdings, Singapore 67.9 98.0 4.17
Panin ANZ Bank, Australia 35.0 72.2 3.07
Permata Standard Chartered Bank, UK 44.5 56.8 2.42
BII Maybank, Malaysia 54.3 54.5 2.32
Buana UOB, Singapore 91.0 22.4 0.95
Ekonomi Raharja HSBC, Hong Kong 99.0 21.2 0.90
BTPN Texas Paciic, US 71.6 19.3 0.82
ANK Commonwealth Bank of Australia 83.0 10.9 0.46
Bumiputera Che Abdul Daim, Malaysia 58.3 6.5 0.28
Mestika Dharma RHB Capital Berhad, Malaysia 80.0 5.3 0.23
Nusantara Tokyo Mitsubishi, Japan 75.4 4.0 0.17
Halim Internasional ICBC, China 90.0 3.5 0.15
Swadesi Bank of India 76.0 1.5 0.06
Indomonex Bank of India 76.0 n.a. n.a.
Total 476.8 20.31
Total for all banks 2,348.0 100.00
a Based on 2009 audited reports. ‘n.a.’ = not available.
Sources: Indonesia Stock Exchange; BI (2009).