J. SE Asian Appl. Geol., Jan–Jun 2013, Vol. 5(1), pp. 41–49
ASSESSMENT OF OPTIMUM YIELD OF
GROUNDWATER WITHDRAWAL IN THE
YOGYAKARTA CITY, INDONESIA
Doni Prakasa Eka Putra∗1, Muhammad Iqbal1, Heru Hendrayana1, and Thomas Triadi Putranto2
1Geological Engineering Department, Faculty of Engineering, Gadjah Mada University, Yogyakarta, Indonesia 2Institute of Hydrogeology, RWTH Aachen, Germany
Abstract
The high demand of clean water supply and ground-water usages in Yogyakarta City, Indonesia has caused the lowering of groundwater table of about 3 m in average since 1984. This condition is caused by the increase number of groundwater pumping in this city relate to the rising of the urban population, eco-nomics condition, education and cultural activities, change of land use and increase number of hotels on this famous tourism city in Indonesia. Therefore, it became necessary to assess the optimum yield from the groundwater system beneath this city which can still preserve the recent level of shallow groundwater. This is important because most of the people in this city depends their daily water supply from shallow dug well. In order to assess the safe yield, a ground-water modeling is conducted. The data used on this modeling was taken from previous research and also primary data collected during this research such as; aquifer geometry, aquifer characteristics, shallow groundwater level, water usage/pumping wells dis-charge, river discharge and surface water level, and climate data. Prediction of the impact of ground-water pumping was made by increasing the ground-water usage/pumping wells discharge on several scenarios. The result of this modeling shows that the optimum yield of the aquifer beneath Yogyakarta City area is about 125,000 m3/day.
Keywords: Optimum yield, groundwater usage,
∗Corresponding author: D. P. E. Putra, Department of
Geological Engineering, Faculty of Engineering, Gadjah Mada University, Jl. Grafika 2 Yogyakarta, 55281, Indone-sia. E-mail: putra [email protected]
groundwater table, pumping, urban population, shallow dug well.
1 Introduction
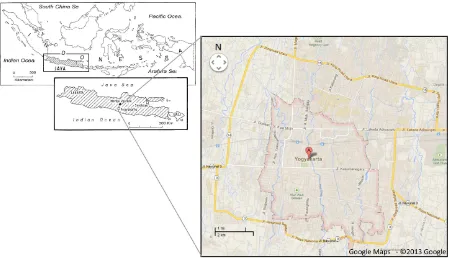
Figure 1: The location of the study area.
2 Literature study
In term of groundwater basin, Yogyakarta City is located in the central part of the Yogyakarta-Sleman Groundwater Basin, which is a part of groundwater-province from Merapi-Stratovulcan (Hendrayana, 1993). The Yogyakarta-Sleman Groundwater basin is mainly composed by the quarternary fluvial-volcanoclastic sediments. The term fluvial relate to the streams/rivers deposition pro-cess, and the term volcanoclastic is used be-cause these quarternary sediments are largely attributable to Merapi Volcano deposits. Ra-hardjo et al. (1977) named these quarternary fluvial-volcanoclastic sediments as Young Mer-api Alluviums. MacDonald and Partners (1984) differentiated the Young Merapi Alluviums into two types of Formation; Yogyakarta and Sleman Formation. The Yogyakarta Formation forms the surface outcrop throughout most of the lowland area of the Yogyakarta Basin from the Merapi Middle Slopes to the coast. It con-stitutes the upper part of the former Younger Merapi Volcanics. On the other hand, The Sle-man Formation is designated as a lower part of the former younger merapi alluviums. The
for-mation extends from the Merapi Upper Slopes to south of Bantul. This quarternary sediment succession built an aquifer system, which is named as Merapi Aquifer System (MacDonald and Partners, 1984; Hendrayana, 1993).
ASSESSMENT OF OPTIMUM YIELD OF GROUNDWATER WITHDRAWAL IN THE YOGYAKARTA CITY
of Merapi Volcano, andesitic-siliciclastic sedi-ments are dominant. In the upper aquifer, sand and gravels are to be more prevalent in the top 10 to 25 m (MacDonald and Partners, 1984). But regionally, the lower aquifer consists of coarser deposits than the upper aquifer (Hendrayana, 1993). The thickness of the Merapi Aquifer System is distributed differently depend on the geological condition. Regionally, it increases from north-boundary of the aquifers to the cen-tral part of Yogyakarta City, and then decreases when exceeding the Yogyakarta graben.
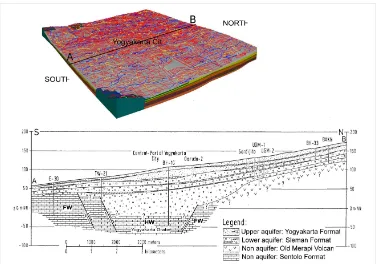
Putra (2007) mention that the results of the lithostratigraphy correlation from borehole data within the study area show there are ac-tually five quarternary layers or successions, which built the multilayer aquifers of the Mer-api Aquifer System beneath Yogyakarta City (Figure 2). Each layer consists of a heteroge-neous composite of gravel, sand, clayey sand, and clay facies, and they are separated by lat-erally uncontinuous sandy silt to clay layers. The laterally uncontinuous semi-permeable to impermeable layers make incomplete separa-tion between the aquifers and cause hydraulic windows. As a consequence, the aquifers of this multilayer system are connected directly to each other in some places. The existence of hydraulic windows in the aquifer system in the study area can have an important role. The hydraulic windows allow mixing process of groundwater from different aquifers. Its mean that groundwater withdrawal in the lower aquifer system can also affected the upper aquifer and vice versa.
According to the constructed hydrogeologi-cal section (Figure 2), the thickness distribution of the Merapi Aquifer System is controlled by the basement morphology. The thickness of the system increases slowly from northern-part of the study area (+50 m) to the north footwall (FW) of Yogyakarta graben (+80 m) and then increases abruptly in the central-part of Yogyakarta City (+150 m), attributable to the hangingwall (HW) of Yogyakarta graben. When exceeded Yogyakarta graben, the thick-ness of the system decreases, abruptly in the south footwall of Yogyakarta graben (+50 m) and then decreases continuously to the
southern-part of the study area (+30 m). From the total thicknesses of the system, thicknessess of the upper aquifer in the study area varies from about 25 m in the northern-part of the study area to about 45 m in the centralpart of Yogyakarta City and then decreases to about 10 m in the southern-part. The upper aquifer is composed mainly of middle to coarse sands and gravels. According to MacDonald and Partners (1971), the average hydraulic conduc-tivity of this upper aquifer under Yogyakarta City is reported as about 7.8 m/d (Putra, 2007). The storativity of the aquifer under the Yo-gyakarta city ranges from 0.03 to 0.20, and based on the measurement from Alpin Con-sult (1989), the average specific yield of the upper aquifer is reported to be about 20%. The thicknessess of the lower aquifer in the study area ranges between 20 m (southern-part of the study area) and 105 m (central-part of the study area), and is composed mainly by coarse sand with gravels and blocks, lenses of breccia and also lava layers.
3 Theoritical background
Considering a unit volume of porous media in the study area, the law of conservation of mass for a steady state condition is applied. It re-quires that the rate of fluid mass flowing into the aquifer system must be equal to the rate of fluid mass flowing out of the aquifer system. The equation of continuity that translates this law into mathematical form can be written as (Freeze and Cherry 1979):
∂
x,y, andx the Cartesian coordinates,
Kx,Ky,Kz the hydraulic conductivity
compo-nents and
h the hydraulic head.
Figure 2: Concept of aquifer system underlying Yogyakarta City area (Putra, 2007).
groundwater problems in a hydrogeology sci-ence (Spitz and Moreno, 1996). It has an abil-ity to tie data and physical principles into com-prehensive and effective representations of the study area. The calculation will be ended as soon as the highest difference in heads from two iteration steps falls below the error tolerance.
4 Methodology
There are actually three main sections in order to achieve the objectives of this research; (1) un-derstanding the natural system, (2) developing the hydrogeological model (conceptual model), and (3) applying the numerical groundwater flow model. Figure 3 shows the methodologi-cal step of this research.
The study background about hydrogeology and numerical models in this research was firstly developed by understanding the natural system which contained many different tasks. Literature reviews were undertaken by compil-ing published hydrogeological and numerical modelling guidelines and analyzing the previ-ous reports about geology, hydrogeology, hy-drology of Yogyakarta and numerical models
which were already created in the past. The outcomes of the literature reviews led to the preliminary understanding of the natural sys-tem and enable us to define the step of data ac-quisition for the site investigation. Then, the principal task on data acquisition was combin-ing different data sources to obtain homoge-nous data set from several sources.
ap-ASSESSMENT OF OPTIMUM YIELD OF GROUNDWATER WITHDRAWAL IN THE YOGYAKARTA CITY
plying some existing hydrological equations, as explained below.
Regarding the climate condition, the average annual rainfall in Yogyakarta City is about 2450 mm/year, with the annual mean temperature in Yogyakarta City is about 27.3◦C (Iqbal, 2013). The estimation of the groundwater recharge was conducted based on simple water balance equation:
U=P−Etr−Ro (2)
where:
U Groundwater recharge (mm/year)
P Annual Precipitation (mm/year)
ETr Evapotranspiration Real (mm/year)
Ro Surface Runoff (mm/year)
ETr was calculated by applying TURC (1954) Equation (Singh, 1989), as written below:
ETr= s P
Tm Annual mean temperature (◦C)
A Watershed (km2)
Surface runoff was calculated by applying em-pirical runoff equation from Department of Agriculture of India (1990) which is proven to be suitable for Java Island – Indonesia (Institut Teknologi Bandung, 2001). The run off estima-tion based on this method is written as the fol-lowing below:
Ro= 1.511×P 1.44
Tm1.34×A0.0613 (4) Applying the above equations, the ground-water recharge in the research area is found to be about 400 mm/year.
The numerical model is based on a program code which solves the groundwater equations. It has the general purpose to simulate a vari-ety of specific hydrogeological model by vary-ing input data. In this study, Visual Modflow software was used to solve the numerical prob-lem. The program uses finite difference analysis to solve the groundwater flow equation in both saturated and unsaturated conditions. This study was focused on the simulation of ground-water flow model under saturated condition in both non time-dependent (steady state) models. Prediction of the optimum yield was conducted by comparing the effect of several groundwater abstraction values to the recent groundwater ta-ble condition.
Numerical models consist of governing equa-tion, boundary conditions and initial con-ditions. Correct selection of the boundary conditions is a critical step in model design. In steady-state simulations, the boundaries largely determine the flow pattern. The model boundaries within the model domain selected for this model include few assumptions which are necessary to simplify the model numer-ically. Some assumptions have to be made for the model. The main assumptions are as follow: (1) the water table in the north and south boundaries is assume to be constant with time, (2) recharge rates used are assumed net long-term values, (3) the river stages are de-rived based on surface topography and field observations, (4) Hydraulic conductivities used are partly estimated and averaged over a large area based on pumping test well and field ob-servations, (5) topographical information is sufficiently accurate, and (6) Interpolation and extrapolation of data is acceptable.
5 Results
Figure 3: Flowchart of this research methodology.
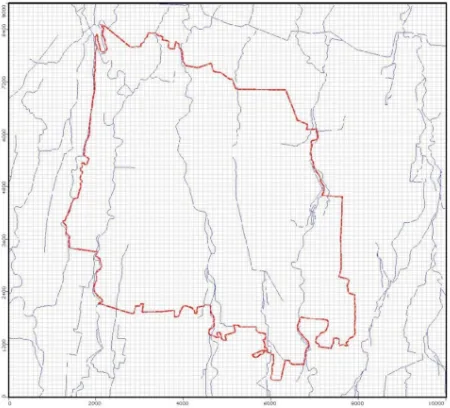
Figure 4: Discretization of the model area.
the hydrostratigraphic unit. Regular grid sizes are used in the model in order capture the full model domain and provde sufficient details and numerical stability in the areas of interest. Grid size measure 100m x 100m. The model consists of 7 layers which are bounded on top layer by topographical surface and on bottom layer by tertiary rocks (Sentolo Formation).
The hydrogeological boundaries in the
cur-rent model are constant heads, recharge, and rivers boundaries as shown in Figure 5. The boundary of constant heads assigned to the northern and southern boundary of the model to represent constant water table boundaries. Recharge is assigned to be about 400 mm/year for whole area. Recharge to the model is es-sentially from rainfall infiltration; however in the model recharge to the aquifer system can also occur when the groundwater level is lower than the river stage. There are five river bound-aries apply to the model; Bedog river, Winongo river, Code river, Gadjah Wong river and Tam-bak Bayan river. The surface water stages were measured in the upstream and downstream during dry and wet season of 2012 (Table 1).
ASSESSMENT OF OPTIMUM YIELD OF GROUNDWATER WITHDRAWAL IN THE YOGYAKARTA CITY
Table 1: Rivers condition in Yogyakarta city area.
River Bedog Winongo Code Gajahwong Tambak Bayan US DS US DS US DS US DS US DS River stage (m) 131 62 130 67 130 73 136 60 135 67 Riverbed bottom (m) 130.2 61 126.5 66 127 71 134.5 58.7 133 66.1 Note: US = upstream; DS = downstream
Figure 5: Boundaries assigned for the ground-water model.
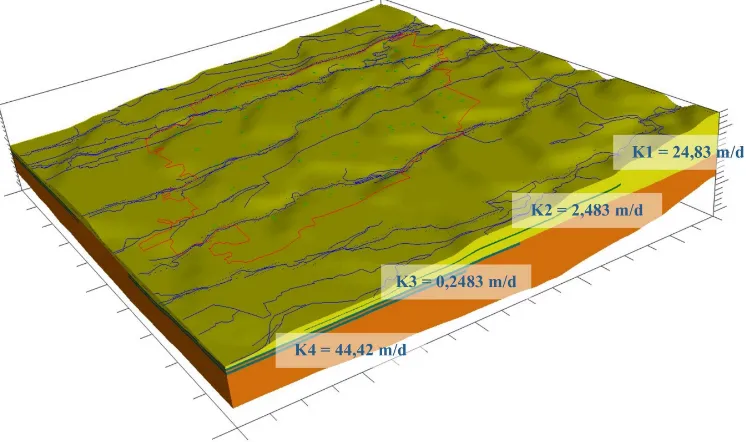
vertical hydraulic parameters assigned same as the horizontal conductivity values. Aquifer storage parameters are not required in steady-state simulation. Result of the modeling is shown in Figure 7.
Due to understand the effect of groundwater withdrawals to the changes of water table in Yo-gyakarta city, a series of predictive sensitivity analysis are conducted in addition to the recent groundwater withdrawal scenario. The predic-tive sensitivity scenarios include:
Base case: groundwater withdrawals 43,472 m3/day
Scenario 1: groundwater withdrawals 125,712 m3/day
Scenario 2: groundwater withdrawals 377,136 m3/day
Figure 7: Simulated water table of Yogyakarta city.
Scenario 3: groundwater withdrawals 628,560 m3/day
Scenario 4: groundwater withdrawals 758,592 m3/day
Scenario 5: groundwater withdrawals 1,137,888 m3/day
Figure 6: Hydraulic conductivity zones applied in the model.
Figure 8: Total groundwater withdrawals ver-sus decrease of water table.
6 Discussion and conclusion
Commonly, the optimum yield is calculated based on their effect to the drawdown of water table. The allowable drawdown of water table is up to 60% from the total thickness of aquifer. Considering that most of the people in the Yo-gyakarta City are still depends their water sup-ply from shallow dug wells, it is wise if the op-timum yield is calculated based on the common deep of dug wells (less than 12 m or about 25– 30% from the total thickness of upper aquifer).
Based on the results of modelling, ground-water withdrawals of about 125,712 m3/day from the aquifer of Yogyakarta City is already cause the decrease of water table to 3 m deeper
than the recent condition (maximum draw-down). Therefore, for the case of Yogyakarta City, it can be concluded that the optimum yield of aquifer beneath this city should be about 125,000 m3/day. This conclusion can be argued as the similar maximum drawdown are also oc-cur for groundwater withdrawals up to 628,250 m3/day, however it should be bear on mind that there are some limitations to the model, such as a constant head in the north and south boundaries which in the future may be change due to the expansion of city and human activi-ties.
References
Freeze, R.A., and Cherry J.A. (1979) Groundwater, 604 p, Prentice-Hall, Inc., Englewood Cliffs, NJ. Hendrayana, H. (1993) Hydrogeologie und
Ground-wassergewinnung Im Yogyakarta Becken, In-donesien, Dissertation, RWTH-Aachen.
Institut Teknologi Bandung (2001) Penelitian Cekungan Air Bawah Tanah Mojokerto, Jawa Timur, Dinas Pertambangan dan Energi Propinsi Jawa Timur.
Iqbal, M. (2013) Pemodelan Aliran Airtanah di Wilayah Kota Yogyakarta, Skripsi, Jurusan Teknik Geologi, Fakultas Teknik, Universitas Gadjah Mada.
ASSESSMENT OF OPTIMUM YIELD OF GROUNDWATER WITHDRAWAL IN THE YOGYAKARTA CITY
General of Water Resources Development Project, Government of The Republic of Indonesia. MacDonald and Partners (1984) Greater
Yo-gyakarta Groundwater Resources Study Volume 3: Groundwater, 116 p, Directorate General of Water Resources Development Project (P2AT), Ministry of Public Works, Government of The Republic of Indonesia.
Putra, D.P.E (2007) The Impact of Urbanization on Groundwater Quality, A Case Study in Yo-gyakarta City – Indonesia, Mitteilungen zur Inge-nieurgeologie und Hydrogeologie, Heft 96, 148 S, Okt 2007, Herausgegeben vom Lehrstuhl fuer
In-genieurgeologie und Hydrogeologie, Univ.-Prof. Dr. R. Azzam, RWTH Aachen, Germany
Rahardjo, W., Sukandarrumidi and Rosidi, H.M.D. (1977) Geological map of Yogyakarta Quadrangle, Geological Survey of Indonesia, Bandung. Singh, V.P. (1989) Hydrologic Systems Volume 2:
Watershed Modeling, 320 p, Prentice-Hall Inc, New Jersey.