INTERNATIONAL CONFERENCE
THE 36
THINDONESIAN POSTGRADUATE PROGRAMS FORUM
THE ROLE OF HIGHER EDUCATION IN MAINSTREAMING
DISASTER MITIGATON RESEARCH TOWARDS SUSTAINABLE
DEVELOPMENT
Keynote Speaker
Prof Dr. Ir. H. Gusti Muhammad Hatta
Dr. Syamsul Maarif, S.IP, M.Si
Editors :
Ir. Prakoso
Yasuo Tanaka, BRUNSFIELD Prof.,
Prof. Dr.-Ing. Joern Birkmann
Prof. Dr. Philip Stokoe
PROCEEDING
INTERNATIONAL CONFERENCE
THE 36
THINDONESIAN POSTGRADUATE PROGRAMS FORUM
THE ROLE OF HIGHER EDUCATION IN MAINSTREAMING
DISASTER MITIGATON RESEARCH TOWARDS SUSTAINABLE
DEVELOPMENT
Keynote Speaker : Prof Dr. Ir. H. Gusti Muhammad Hatta Dr. Syamsul Maarif, S.IP, M.Si
Editors : Ir. Prakoso
Yasuo Tanaka, BRUNSFIELD Prof., Prof. Dr.-Ing. Joern Birkmann Prof. Dr. Philip Stokoe
Head Of Organizing Comittee : Dr. Ir. Muhammad Dirhamsyah, MT Vice Of Organizing Comittee : Dr. Khairul Munadi, ST. M.Eng Secretary Of Organizing Comittee : Sri Adelila Sari, M.Si, Ph.D
Dr. Safrida, S.Pd, M.Si
Cover Design and Layout : Dr. Ing. T.Budi Aulia Dipl. Ing Enny Irmawati Hasan, ST
Publisher : Program Studi Magister Ilmu Kebencanaan Universitas Syiah Kuala
Address : Hyogo Prefecture Building Universitas Syiah Kuala, Jln.Hamzah Fansuri No.3 Darussalam, Banda Aceh 23000, Indonesia
Welcome message From Rector
On December 2004, Earthquake and tsunami killed 220,000 people. 585,000 people
lost their houses and damage estimated was US$4,5 billion in Aceh and Nias Islands. On
March 2005, 1,000 people perished by earthquake, 50,000 people displaced and damage
estimated was US$390 million at Nias Islands and Aceh. Until nowadays there are various
disaster happen in many places in Indonesia. This is the time for higher education
institutions to play their role to make our place and communities more resilient.
In 2004, at Syiah Kuala University, there are 113 staff and 243 families perished and
330 house damages. It proves that we need knowledge to make us stronger and knowledge
can be our investment to make sustainable developmentcan be betterplanned. Our
investment of disaster area has started since 2005, when we established Unsyiah for Aceh
Reconstruction(UAR) and followed the establishment of Tsunami and Disaster Mitigation
Research Center (TDMRC) as the combination of the two centers (Tsunami Research
Center and Mitigation Center) at 2006.Then in2010, we got mandate to establish the
Disaster Science Magister Program from Directorate General of Higher Education
Ministry of Education and Culture.
Last but not least, we hope that this international conference will give benefit results.
On behalf of Syiah Kuala University, I express my sincere thanks and wishes to the
organizers and participants of the conference and I hope that we can learn each other to
find out the right direction of the role of higher education in mainstreaming disaster
mitigation research towards sustainable development.
Thank you for joining us. I hope all participants will take opportunity to enjoy this
conference and have sweet memories staying at our campus, Banda Aceh and Weh Island.
Banda Aceh, June 2014
Rector, Syiah Kuala University
Welcome from Director Postgraduate Program
Welcome to our Postgraduate Leaders Forum of Indonesia State University and
International Conference. We are honored to co-host this year’s event at our prestigious
meeting. I would like to express my sincere gratitude to our collaboration forums which
has been walked together since 1978 and it becomes 36 years age nowadays. Syiah Kuala
University has established Postgraduate program since 2 December 2002 and in 2014 it
has 6 Doctor Program and 27 Magister Program.
To commemorate the 10 years of 2004 Indian Ocean Tsunami, at this time, we try to
combine our meeting with the disaster current issueswhich the topic is“The role of Higher
Education in Mainstreaming Disaster Mitigation Research towards Sustainable
Development”. Nowadays, various knowledges of disaster are explored by researchers
through multidisciplinary and how to break down the barrier between discipline in order to
find the appropriate solution for helping our community and country.
Through the discussion in this forum, we hope we can learn how the future
directions of social, science and technology and culture can contribute toward more
sustainability in environment and human activities to make better development.
Banda Aceh, June 2014
Director of Postgraduate Program
Syiah Kuala University
Welcome from Organizing Committee
It is a great pleasure to welcome delegations of international conference 2014. This
international conference is a part of Postgraduate Leaders Forum of Indonesia State
University activities.
During the conference, there are 33 papers in three parallel sessions, four papers will
be read bykeynotespeakers and two keynote speakers from the State Minister for Research
and Technology and the Head of National Disaster Management Agency, Republic of
Indonesia. Three paralel sessions are for science and engineering, social science, and
disaster education. Invited speakers are Prof. Agus Subekti, MSc.PhD from Director
Research and Community Services of Higher Education and Culture, Dirjen Dikti; Yasuo
Tanaka, Brunsfield Prof, Geotech Engineering Department of Civil, UTAR, Malaysia;
Prof. Dr. Philip Stokoe, Senior Health Consultant and Governor Aceh Advisor; Dr. Ian
Singleton, PanEco Foundation, Australia.The topic of this international seminar is The
Role of Higher Education in Mainsteaming Disaster Mitigation Research towards
Sustainable Development, held by Postgraduate Program, Syiah Kuala University.
I would like to thank all the members of the commitees and our students as
secretariat of postgraduate program and disaster science magister program for their hard
work, time and effort in organizing this conference. Also, I would like to thank to all of
our partners for their generous support and contribution in greet long-term cooperation and
find the solutions for disasterin the implementation of suitainable development.
Banda Aceh, June 2014
Head, Graduate Program of Disaster Science
Table Of Content
Welcome message from Rector ii
Welcome message from Director Postgraduate Program iii
Welcome message from Organizing Committee iv
Table of Content v
A LIFE SCIENCE
1. ABO AND RHESUS BLOOD GROUP DISTRIBUTION IN THE POPULATION OF TWO ISLANDS IN ACEH PROVINCE
AL AZHAR, KARTINI HASBALLAH, SAKDIAH
1–6
2. IMPACT OF SHADING TO CHANGES IN AGRONOMIC TRAITS,
PRODUCTION AND MORPHO-ANATOMICAL STRUCTURE OF
SOYBEAN (GLYCINE MAX (L.) MERRILL)
CHAIRUDIN, EFENDI, SABARUDDIN
7–16
3. THE STUDY OF BIODEVERSITY ABOUT THE PRESENCE OF SOIL AND WOOD FUNGUS ALSO POTENTIAL BREEDING IN SIBOLANGIT FOREST TOURISM, NORTH SUMATERA
HASRUDDIN, RATNA DEWI
17–22
4. GEOPHYSICAL INVESTIGATIONS ON ARCHEOLOGICAL SITE OF KUTA LUBOK TSUNAMI HERITAGE
MUHAMMAD YANIS, FAUZI ANDIKA, SRI WAHYUNI, NAZLI ISMAIL, MARWAN, GUNAWATI
23 - 28
5. EFFECT OF DOSAGES ARBUSCULAR MYCORRHIZAL FUNGI (AMF) ON P UPTAKE, GROWTH AND YIELD OF SOYBEAN IN ULTISOLS SOIL
NURMASYITAH, SYAFRUDDIN, MUHAMMAD SAYUTHI
29 - 38
B SOCIAL SCIENCE
6. THE STRATEGIES OF THE IMPLEMENTATION QANUN KHALWAT TO PREVENT MISBEHAVIOROUS OF BANDA ACEH ADOLESCENT
ABU BAKAR
39 - 54
7. WILLINGNESS TO PAY NUSANTARA TOURISTS TO ECONOMIC VALUE OF EXCURSION OBJECT IN SABANG USING TRAVEL COST METHOD
HERLINA
55 - 72
8. INTERPERSONAL COMMUNICATION OF COMMERCIAL SEX WORKERS IN THE PROCESS OF TRANSACTION WITH CUSTOMER IN LHOKSEUMAWE
NURSAN JUNITA, MA (CLIN.PSY), VIVI ANGGRAINI
C DISASTER AND EDUCATION
9. IDENTIFICATION OF BIOLOGY TEACHERS MISCONCEPTION AT SECOND GRADE OF SENIOR HIGH SCHOOL CLASS XI SCIENCE IN CONCEPT OF HUMAN REPRODUCTIVE SYSTEM
ABDULLAH, LYANDA FITRIANI CHANIAROSI, KHAIRIL
89 - 96
10. THE PERCEPTION OF SMAN 1 STUDENTS BANDA ACEH ON TSUNAMI DISASTER PREPAREDNESS
CUT HASANUDDIN, MUHAMMAD RAIS, RIZKY FAZJRIN, SRI ADELILA SARI
97 - 106
11. THE INVESTIGATION OF DISASTER KNOWLEDGE OF TEACHERS AND STUDENTS ON STATE JUNIOR HIGH SCHOOL (SMPN) 1 KAJHU, ACEH BESAR, ACEH PROVINCE
ENNY IRMAWATI HASAN, GUSTIN YULIAN NOVA, MARDIYANI. M, SANNETI HEVIANIS, SRI ADELILA SARI
107 - 112
12. THE EFFECT OFGROUP COUNSELINGAND SELF EFFICACY OF STUDENTS KNOWLEDGE AND ACTION IN THE FACE OF AN EARTHQUAKE
EMALIA NURANDA, SRI ADELILA SARI, SRI MILFAYETTY, M.
DIRHAMSYAH
113 - 120
13. THE USE OF EVACUATION ROUTE MAPS ON LEARNING DISASTER PREPAREDNESS ON STUDENTS CLASS V ON STATE PRIMARY SCHOOL 19 BANDA ACEH,INDONESIA
IRMA SURYANI, SRI ADELILA SARI, M. DIRHAMSYAH, SRI MILFAYETTY
121 - 124
14. THE STUDY OF PREPAREDNESS TO EARTHQUAKE DISASTERS IN PUBLIC HEALTH FACULTY, SERAMBI MEKKAH UNIVERSITY BANDA ACEH
MUSLIYADI, AKHMAR YUSKAR, DENI MUNTAZAR, ISKANDAR HADY, SRI ADELILA SARI
125 - 128
15. IMPLEMENTATION OF PROBLEM BASED LEARNING MODEL INCONCEPT LEARNING MUSHROOM AS A RESULT OF STUDENT LEARNING IMPROVEMENT EFFORTS GUIDELINES FOR TEACHERS
MUSRIADI
129 - 136
16. AN EDUCATION OF DISASTER RISK MANAGEMENT AT BUNG HATTA UNIVERSITY
NASFRYZAL CARLO, WARDI, EVA RITA, YUSRITA YANTI
137 - 140
17. THE KNOWLEDGE ABOUT PREPAREDNESS ON EARTHQUAKE DISASTER OF IBNU SINA ACADEMY STUDENTS SABANG CITY, ACEH PROVINCE
NILA MULYANI, AIDA KHAIRUNNISA, HERIZAL FACHRI
18. THE PREPAREDNESS OF SMAN 5 BANDA ACEH IN FACING EARTHQUAKE DISASTER
RAHMATI, PUTRI UBAIDA MUNZAKI, RAHMI MIRONI, RAHMI, SRI ADELILA SARI
151 - 156
19. RELATIONS POLICY, FACILITIES AND INFRASTRUCTURE WITH COMMUNITY SCHOOL PREPAREDNESS DISASTER ALERT BANDA ACEH
RINA SUSANTI, SRI ADELILA SARI, SRI MILFAYETTY, M. DIRHAMSYAH
157 - 164
20. THE EFFECTIVENESS OF CRISIS GROUP COUNSELING IN MINIMALIZING NEGATIVE LEARNINGIN SINABUNG ERUPTION DISASTER CAMP
PROF.DR. SRI MILFAYETTY MS.KONS.
165 - 168
21. THE ROLE OF MANAGERS OF ACEH HEALTH POLYTECHNIC IN DISASTER PREPAREDNESS
SRI WIDYASTARI, SRI WAHYUNI UW,MUTIAYACOB, AND MOHAMMAD PAHLAWAN
169 - 172
22. SMART CLASS ROOM SYSTEM BASED ENERGY SAVING AT TENDANCE AND SCHEDULING INFORMATION SYSTEMS FOR CLASS ROOM
DEDI SATRIA, SYAIFUDDIN YANA
173 - 184
23. AN APPLIED MODEL OF TEACHING MATERIALS TO IMPROVE STUDENTS’ SPEAKING SKILL
TARMIZI RAJAB
185 - 196
D SCIENCE AND ENGINEERING
24. BUILDING PERFORMANCE EVALUATION (BPE) FOR QUALITY IMPROVEMENT IN POST-DISASTER RECONTRUCTION
AULINA ADAMY, ABU HASSAN ABU BAKAR
197 - 214
25. THE POLICY OF REGIONAL TRANSPORTATION KENDAL DEMAK UNGARAN SEMARANG SALATIGA PURWODADI (KEDUNGSEPUR)
SRI SUWITRI, DYAH HARIANI
ABO AND RHESUS BLOOD GROUP DISTRIBUTION IN
THE POPULATION OF TWO ISLANDS IN ACEH
PROVINCE
1)
Al Azhar,2)Kartini Hasballah,3)Sakdiah
1
Department ofBiochemistry, Faculty of Veterinary Medicine, Syiah Kuala University, Banda Aceh, Indonesia.
2Deparment of Pharmacology, Faculty of Medicine, Syiah Kuala University, Banda Aceh, Indonesia 3Deparment of Biochemistry, Faculty of Medicine, Syiah Kuala University, Banda Aceh, Indonesia
E-mail of correspondence: [email protected]
Abstract
We conducted a survey for distribution of ABO and Rhesus (Rh) blood groups in the population of Sabang and Simeulue District, two small, earthquake and tsunami affected islands in Aceh Province in about two years after the disasters hit Aceh on December 26, 2004. Subjects were 369 unrelated, adult male and female apparently healthy individuals and up to 3 generation had the same local mother language affiliation, consisting of 168 Sabang individuals and 201 Simeuleu individuals. As far as genetic counseling concerned subject were selected purposively from students of high school, voluntarily participated in the study after completing the informed consent. Blood aliquots were obtained using Terumo disposable syringe and used for ABO and Rh blood groups determination using standard methods. The results showed that the most prevalent blood group was O (55.3%), followed by blood groups B (24.4%) and A (16.5%), whereas the least common blood group was AB (3.8%). The majority of subjects (99.5%) were Rh positive, and 0.5% were Rh negative. In conclusion, blood group O is the most prevalent blood group in Sabang and Simeuleu populations, followed by B, A, and AB. More than 99% of the study population is Rh positive.
Keywords: ABO, rhesus, blood group, Aceh
INTRODUCTION
Blood classification into groups is based on the presence or absence of inherited antigenic compound on the surface of erythrocytes and other cells, and in body fluids (Hartmann, 1941; Calhoun and Petz, 2001). Almost 400 blood group antigens have been identified (Bauer, 1982; Sigmon, 1992; Khan et al., 2004), and are responsible for more than 30 independent blood group systems characterized by the International Society of Blood Transfusion (ISBT) today (ISBT, 2008). From these, the ABO and rhesus remain the most clinically important blood group systems from the view of transfusion to avoid morbidity and mortality (Omotade et al., 1999; Khan et al., 2004).
and that of A group is specific to Caucasians (Sofro, 1992). Since difference in the distribution of ABO and Rh blood groups exist from race to race, global distribution of the blood groups A, B, O, and AB as well as Rh-positive and Rh-negative varies according to the population, within subpopulation or ethnic (Jaff, 2010), and by geographical area (Hoffbrand 1981; Talib 1991). Some variations may even exist indifferent areas within one small country (Potts, 1979).
Aceh is the most Northern Province in Indonesia and has been known its heterogeneity of people and demography (Azhar and Husin, 2001), but with limited data on population genetics. Despite our previous study on G6PD deficiency prevalence and ABO blood group distribution in the population of Aceh Besar (Great Aceh) and Aceh Tengah (Middle Aceh) (Azhar and Husin, 2001; Husin et al., 2002), there are no information about genetic constitution of Acehnese, a population belongs to the western Indonesian cluster (Sofro, 1982). In this paper, we present results of our surveys on ethnic distribution of ABO and Rhesus blood groups in the population of Sabang and Simeulue, two small tsunami affected island in Aceh with different level of isolation.
METHODOLOGY
This study was performed over a period of 3 months (June-August 2006) in Sabang and Simeulue of Aceh Province. These islands were directly affected by huge earthquake and tsunami 2004 and had relatively different level of isolation. Subjects were 369 unrelated healthy adult male and female individuals and until 3 generation have affiliation of the same local mother language (tribe). All subjects were, therefore, of known Acehnese ethnicity tribes from Sabang or Simeuleu. These representing 168 Sabang individuals (60 male and 108 female) and 201 Simeulue individuals (78 male and 123 female). As far for genetic counseling, the majority of subjects were students from high schools in Simeulue (Public Vocational High School 1 of Sinabang and Public Junior High School of Lamting) and Sabang (Ibnu-Sina Nursing Academy and Public Junior High School 1, and Public Islamic High School 1), voluntarily participated in this study after completing informed consent.
RESULT AND DISCUSSION
The prevalence of O, A, B, AB, and Rh phenotypes in Sabang and Simeulue populations in 2006 is shown in Table 1. The results showed that blood groups A, B, AB and O were found in 39 (23.2%), 51 (30.3%), 70 (41.7%), 8 (4.8%) of Sabang individuals, respectively. In Simeulue individuals, the respective blood groups were found in 22 (10.9%), 39 (19.4%), 134 (66.7%) and 14 (3.8%) individuals. The allelic frequencies of O, A and B genes were 0.5528, 0.2629 and 0.1843, respectively. Rhesus negative was only found in 2 (1.2%) of Sabang individuals. Overall, the most prevalent blood group was O (55.3%), followed by blood groups B (24.4%) and A (16.5%). Blood group AB present at lowest prevalence (3.8%). The majority of subjects (99.5%) were Rh positive, and 0.5% was Rh negative.
Table 1. The distribution of various ABO and Rh-D phenotypes among the samples studied
Regency/ District Number of subjects involved Age (Year) Blood group
ABO blood group phenotypes Rhesus blood group phenotypes
Male Female A B O AB Positive Negative
Sabang 60 108 15-21 39
(23.2%) 51 (30.3%) 70 (41.7%) 8 (4.8%) 166 (98.8%) 2 (1.2%)
Simeulue 78 123 12-18 22
(10.9%) 39 (19.4%) 134 (66.7%) 6 (3.0%) 201 (100%) 0 (0%)
Total 138 231 15-21 61
(16.5%) 90 (24.4%) 204 (55.3%) 14 (3.8%) 367 (99.5%) 2 (0.5%)
Although antigens involved are stable throughout life, distribution of ABO and Rh genes and phenotypes may vary greatly across races and geographical limitations (Strickberger, 1976; Race and Sanger, 1979; Burns, 1980). The resultant polymorphism remains important for effective management of blood banks inventory and for population genetic studies as well as for evaluating possibility of antenatal haemolytic disease, resolving paternity/maternity problems and forensic confirmation (Mollison, 1979; Hoftbrand, 1981). The study presented here, therefore, importance in providing information on the status of ABO and Rh blood groups distribution in the Aceh subpopulations.
In this survey performed during the period between June and August 2006, we screened for ABO and Rh blood groups distribution on a total of 369 blood samples collected from Sabang and Simeulue of Aceh in both sexes. All of these were from medical sampling performed at regular and vocational high schools as well as university students. The frequency of group O phenotype comprised over half (55.3%) the samples, while group AB was the least encountered phenotype with a frequency of less than 4% among the samples studied. The frequency of groups A and B accounted for 16.5% and 24.4%, respectively.
pattern ABO blood group phenotypes distribution in the majority of Indonesian populations, except for West Java individuals whose have more A blood group than B (Sofro, 1992). Some world populations also have this pattern of ABO blood group distribution (Falusi et al., 2000).
Generally, group O is the most dominant in human populations, with AB being the rarest (Marzban et al., 1988; Talib, 1991; Falusi et al., 2000; Shamim et al., 2002). An exception, where blood group B is more dominant than O, has been reported in Pakistani and Indian (Hoftbrand, 1981; Yousaf et al., 1988). A distribution with B > A > O > B has also been reported in Pakistani (Khan et al., 2004). In some populations, blood group B is the second commonest, resulting in an O > B > A> AB blood group distribution (Sofro, 1992; Husin et al., 2002; Falusi et al., 2000), but others have more number of A blood group than B (Worledge et al., 1974; Lyko et al., 1992; Omotade et al., 1999; Bakare et
al., 2006; Egesieet al., 2008; Enosolease and Bazuaye, 2008;Hamed et al., 2012; Ndoula,
2014). These differences were influenced by racial (genetic) and environmental factors (Kalmakov and Kononova, 1999; Swerdlow et al., 1994; Khan, et al., 2004). Relative isolation and endogamicity may also increase certain ABO phenotypes in the population of small islands. This phenomenon was observed Sabang and Simeulue investigated in this study. The higher prevalence of O but and lower prevalence of A and AB in Simeulue population compared to that in Sabang population suggested the former was more isolated and had higher endogamicity rate than the latter.
In terms of presence of Rh antibodies, the comparatively the dominance of Rhesus positive obtained in this study was in agreement with those obtained from Mongolid populations across the globe including Pakistani, certain African populations, Indonesians (Lyko et al., 1992; Gaertneret al., 1994; Omotade et al., 1999; Subhan et al., 2000; Shamim et al., 2002; Enosolease and Bazuaye 2008; Hamed et al., 2012).In only very rare cases, such as in Caucasian or Caucasia descendant populations, the comparatively higher percentage of Rh negative observed (Sofro, 1992). Globally, the number of Rh-negative individuals is still very low and being significantly rarer than Rh positive individuals.
CONCLUSION
Our study provide the first data on ethnic distribution of ABO and Rhesus blood groups in the populations of Sabang and Simeulue of Aceh province and suggest that blood group O is the most prevalent blood group in Sabang and Simeuleu populations, followed by B, A, and AB. More than 99% of the study population is Rh positive.
ACKNOWLEDMENT
and Ishaq for their great help in sample collection. This resecarh was funded by Risbin-Iptekdok 2006 grants from Health Department of the Republic of Indonesia, Jakarta.
REFERENCES
Azhar A and Husin A. 2001. Prevalence of 6-phosphate glucose dehydrogenase (G6PD)
deficiency in two populations of Aceh province. Jurnal Kedokteran YARSI (YARSI
Medical J) 9(1): 93-5
Bakare AA, Azeez MA, Agbolade JO. 2006. Gene frequencies of ABO and rhesus blood
groups and haemoglobin variants in Ogbomosho, South-West Nigeria. Afr J
Biotechnol 5:224–9.
Bauer JD. 1982. Clinical laboratory methods. 9th ed. Michigan, USA: Mosby Company. Burns, WG. 1980. The science of genetics. In: An Introduction to heredity. 4th ed. New
York: McMillan Publ Co; pp.179-80
Dacie JV, Lewis SM. 2001. Practical haematology. In: Lewis SM, Bain BJ, Bates I, editors. 9th ed. London: Churchill Livingstone, Harcourt Publishers Ltd; pp. 444–
51.
Calhoun L, Petz LD. 2001. Erythrocyte antigens. In: Beutler E, Lichman MA, Coller BS, Kipps TJ, Selisohn U, editors. Williams hematology. 6th ed. New York: McGraw-Hill, Inc, Health Professions Division; pp. 1849–57
Egesie GU, Egesie JO, Usar I and Johnbull OT. 2008. Distribution of ABO, Rhesus blood
groups and haemoglobin electrophoresis among the undergraduate students of Niger Delta University Nigeria, Nigerian J Physiol Sci 23 (1-2): 5-8.
Enosolease EM and Bazuaye NG. 2008. Distribution of ABO and Rh-D blood groups in
the Benin area of Niger-Delta: Implication for regional blood transfusion. Asian J
Transfus Sci 2(1): 3–5.
Falusi AG, Ademowo OG, Latunji CA, Okeke AC, Olatunji PO, Onyakwere TO, Jimmy EO, RAji Y, Hedo CC, Otokonyong EE, Itata EO. 2000. Distribution of ABO and
RH genes in Nigeria. Afr J Med Sci 29 (1): 23-6
Gaertner H, Lyko J, Lyko S. 1994. The antigens ABO and Rh(D) in Nigeria population. Hamdard Med 37(1): 81-91.
Hartmann G. 1941. Groups antigens in human organs. Copenhagen: Ejman Munksgaard Hamed, CT, MA Bollahi, I Abdelhamid , MA Med Mahmoud, B BA, S Ghaber, N Habti
and A Houmeida. 2012. Frequencies and ethnic distribution of ABO and Rh(D)
blood groups in Mauritania: results of first nationwide study. Int. J Immunogenet
39 (2): 151-4
Hoffbrand AV. 1981. Post Graduate Haematology. 2nd ed. London: Heinmann Professional Publ Ltd; pp. 270-350.
Husin A, Azhar A and Sakdiah. 2002. Distribusi golongan darah sistem ABO pada dua
populasi Aceh (Distribution of ABO blood system in two populations of Aceh).
Research Report. Banda Aceh, Indonesia: Medical Faculty of Syiah Kuala University.
International society of Blood Transfusion (ISBT). “Table of blood grup systems”. Oct 2008. http://ibgrl.blood.co.uk/isbt
Jaff SM. 2010. ABO and rhesus blood group distribution in Kurds. J Blood Med 1: 143-6. Kalmakova GN and Kononova LL. 1999. The prevalence of ABO blood groups among
Khan SM, Subhan F, Tahir F, Kazi MB, Dil SA, Sultan S, Deepa F, Khan F, and Sheikh AM. 2004. Prevalence of blood groups and Rh factor in Bannu region (NWFP)
Pakistan. Pakistan J Med Res 39 (2): 151-4
Lyko J, Gaertner H, Kaviti JN, Kariithi MW, and Akoto B. 1992. Blood-group systems
ABO and RH in the Kenyan population]. Folia Med Cracov 33(1-4): 85-92.
[PubMed Abstract]
Marzban M, Kamali MS, and Hosseinbasi T. 1988. Blood groups of the people of Ahwaz, Iran. Anthropol Anz 46(1): 83-9 [PubMed Abstract]
Molison PL. 1979. Blood transfusion in clinical medicine. 6th ed. Oxford: Blackwell Scientific Publication pp: 239-66.
Ndoula TS, Noubiap JJN, Nansseu J RN, and Wonkam A. 2014 Phenotypic and allelic
distribution of the ABO and Rhesus (D) blood groups in the Cameroonian population. Int J Immunogen 41(1): 206–10. [PubMed Abstract]
Omotade OO, Ademeyo AA, Kayode CM, Falade SL, Ikpeme S. 1999. Gene frequencies
of ABO and Rh (D) blood group alleles in a healthy infant population in Ibadan, Nigeria. West Afr J Med 18(4): 294-7
Potts WTW. 1979. Histiry of blood group in Brithis Isles. In Jaff SM. 2010. ABO and rhesus blood group distribution in Kurds. J Blood Med 1: 143-146.
Race RR and Sanger R. 1968. Blood groups in man. 5th ed. Oxford: Blackwell
Subhan F, Tahir F, Sultan S, Dil AS. 2000. Bad obstetric history: cytogenetic and
haematological parameters. Pak J Med Res 39(4): 139-4
Shamim A, Hafeez MA, Ahmad MM. 2002. ABO and Rh blood groups I: Markers of
cardiovascular risk and association with lipids and other related risk covariables in a Pakistani population. Proc Pak Acad Sci 39(1): 47-66.
Sigmon JM. 1992. Basic principles of the ABO and Rh blood group systems for
hemapheresis practitioners. J Clin Apher 7(3): 158-52. [PubMed Abstract]
Sofro ASM. 1982. Population genetic studies in Indonesia (PhD Thesis). Australia: Australian National University.
Sofro ASM. 1992. Keanekaragaman genetik (Genetic diversity). Yogyakarta: CV Andi Offset
Strickberger MW. 1976. Dominance relations and multiple alleles in diploid organisms. 2nd ed. New York: McMillan Publ Co; pp: 164-80.
Swerdlow DL, Mintz ED, Rodriguez M, Tejeda E, Ocampo C, Espejo L, et al. 1994.
Severe life-threatening cholera associated with blood group O in Peru: implication for Latin American epidemic. J Infect Dis 170(2):468-72.
Talib VH. 1991. Handbook of medical laboratory technology. 2nd ed. New Delhi: CBS publishers.
Worlledge S, Ogiemudia SE, Thomas CO, Ikoku BN, Luzzutto L. 1971. Blood group
antigens and antibodies in Nigeria. Ann Trop Med Parasitol 68:249–64 [PubMed Abstract]
Yousaf M, Yousaf N, Zahid A. 1988. Pattern of ABO and Rh (D) Blood groups
IMPACT OF SHADING TO CHANGES IN AGRONOMIC
TRAITS, PRODUCTION AND MORPHO-ANATOMICAL
STRUCTURE OF SOYBEAN (GLYCINE MAX (L.)
MERRILL)
1
Chairudin,2Efendi,2Sabaruddin
1Student on Master’s Degree of Agroecotechnology Universitas Syiah Kuala, andAcademic staff on
Universityof Teuku Umar, Meulaboh
2
Academic staff onMaster’s Degree of Agroecotechnology, University of Syiah Kuala, Darussalam, Banda Aceh, Indonesia
Email: [email protected]
Abstract
Light stress is one of the constraints in increasing soybean production through intercropping system. This study aimed to determine changes in agronomic traits, production and morpho-anatomy of soybean plants at low light stress due to shade. This research was conducted at the experimental farm of Agriculture Faculty, Teuku Umar University Meulaboh in West Aceh, from August to November 2013. This study uses split plot design with three replications where separated subplot (varieties: Anjasmoro, Kipas Merah Bireun, Grobogan, Burangrang, Sinabung, Kaba) nested in the main plot (shade: without shade, 25% and 50% shade). The results showed that 25% and 50% shade resulted in an increase in plant height, trifoliate leaf area, and reduce the number of nodes, number of trifoliate leaves, specific leaf area, total leaf area, dry weight and accelerate flowering compared to the environment without shade. In terms of anatomy, shade 25% and 50% resulted in an increase in the amount of chlorophyll a and b but has no effect on the ratio of chlorophyll a/b. Effect of shade on the characters of production resulted in a decrease in the number of pods containing, the number of empty pods, dry seed weight and harvest index, but did not affect the weight of 100 seeds. The results showed the level of shade 25% and 50% production decline on average by 29,51% and 50,22% on a wide range of varieties tested. This indicates that 25% are already creating shade agro-climatic conditions are not suitable for the cultivation of soybean varieties tested.
Keywords: Intercropping, shading, soybean, yield
INTRODUCTION
Soybean is the third major food commodity after rice and maize are becoming commodity priorities in agricultural revitalization program. Special efforts are needed to increase production through the acceleration of national soybean productivity improvement and expansion of planting area. The development of soybean plants as intercrops under stands of plantation crops or mixing it with other seasonal crops is a strategy to improve the national soybean production. However, efforts to develop a soybean crop intercropping interrupted or encounter obstacles, one of them due to lack of light shade.
reduction (Asadi et al., 1997). The decrease in grain yield is determined by the intensity of light in addition, is also determined by the length of shade (Jiang and Egli., 1995). Other studies prove that the lack of light results in a reduced number of pods formed (Kurosaki and Yumoto, 2003). The adaptation can be learned through specific response at various levels such as a change in anatomy, morphology, physiology, biochemistry and molecular (Bruce et al., 2001).
Therefore, the development of adaptive soybean biophysical conditions under stands of perennial crops and annual crops with low lighting penetration rate in the system is interrupted or intercropping plants need to be done. This experiment aims to determine changes in agronomic traits, production, morphology and anatomy as an identifier soybean adaptation to low light stress due to shade.
MATERIAL AND METHODOLOGY
The study was conducted at the Experimental Faculty of Agriculture, University of Teuku Umar Meulaboh from August to November 2013. Area of research lies at a height of 1 meter above sea level. The average temperature ranges from 25.9 -26.7 0C, 288.65 mm rainfall / month and 87% humidity.
The materials used are the seeds of soybean varieties Anjasmoro, Kipas Merah Bireun, Grobogan, Burangrang, Sinabung and Kaba. Paranet 25% and 50% as a shade was installed to create light stress. This study uses a separate plot design (split plots design). The main plot consists of three levels, namely shade without shade, 25% shade and 50% shade and subplot consisted of varieties is Anjasmoro, Kipas Merah Bireun, Grobogan, Burangrang, Sinabung and Kaba. This experiment used three replicates where subplot (variety) nested within the main plot (shade). Each varieties planted in polybags and at age 1 WAP growing media were given a dose of fertilizer urea 0.3 g urea, TSP 1,25 g, and 1 g of KCl per polybag, which is equivalent to 34 kg N, 144 kg P2O5and 150 kg K2O ha-1
RESULT AND DISCUSSION
Plant height. Shade causes increased plant height. The results showed that in 25%
shade Anjasmoro varieties have the highest plant height (85.02 cm) with a change of 32.49% which is different from the other varieties except with Grobogan. Similarly, at the rate of 50% shade (Table 1). Plant height differences on the various varieties at different levels of shade indicates that each variety has a different tolerance levels in response to environmental stress due to shade. The increase in plant height in shaded conditions is an attempt to improve the plant so that the light absorption efficiency of light that can be absorbed into a more optimal. The increase in plant height due to shade is also reported by Soverda (2012).
Number of nodes. Shade causes decreased number of nodes. The results showed
conditions associated with efforts to increase the absorption of light by a decrease in the number of trifoliate leaves, because the nodes is where the discharge leaves.
Number of trifoliate leaves. Shade causes trifoliate leaf number decreased (Table
1) results showed that the highest number of trifoliate leaves at 25% shade found in variety of Grobogan (50.11) with a decrease of 6.44% which is different from other varieties. Similarly, at the rate of 50% shade. Reduced number of trifoliate leaves on shaded conditions is an attempt to improve the plant light capture efficiency by reducing wastage of light absorption by decreasing the number of trifoliate leaves. The decrease in the number of trifoliate leaves of soybean due to shade paranet 55% also reported the results of research Kisman et al. (2007).
Dry weight. Shade cause dry weight decreased. The results showed that in 25%
shade Grobogan varieties have the highest of dry weight (115.10 g) with a decrease of 5.19% which is not different from the varieties of Kipas Merah Bireun (108.95 g) and varieties Anjasmoro (106.90 g ) with a 15.55% decrease, respectively, and 10.62%. While in the shade 50% dry weight highest found in variety of Grobogan (103.76 g) were not different from the variety of Kipas Merah Bireun (103.76 g) with a decline of 16.69% respectively and 21.33% (Table 1). The decrease in plant dry weight due to stress caused by low light plants in shadedphotosynthesis so that the optimum result in decreased plant dry weight produced.
Leaf area. Shade causes trifoliate leaf area increased, but reduced the total leaf area
and specific leaf area. The results of this study indicate the shade 25% and 50% trifoliate leaf area increased 8.91% respectively and 42.15%. Different test results between varieties at different levels of shade indicates that varieties Anjasmoro has the largest trifoliate leaf area (23.67 cm2) were no different from other varieties except with Kaba. Shade 25% and 50% resulted in a decrease in total leaf area, respectively 13.14% and 18% and a decrease in specific leaf area, respectively 10.82% and 34.43%. Total leaf area found in most varieties Anjasmoro (585.89 cm2) are no different from other varieties except with Grobogan, while specific leaf area found in most varieties Sinabung (18.73 cm2) were no different from other varieties except with Grobogan. Trifoliate leaf area increase and decrease in total leaf area and specific leaf area in a shaded environment to stress adaptation mechanisms to improve the light absorption efficiency of light so that the light can be used optimally limited. This is in accordance with the opinion of Levitt (1980) which states that the mechanisms of plant adaptation to low light intensity, there are two ways to increase the total light interception by the increase in leaf area and increase the percentage of light that is used in photosynthesis through a reduction in the amount of light reflected and transmitted. The increased specific leaf area by 50% light intensity treatment was also reported by Logan et al. (1999) and Atwell et al. (1999).
Age at flowering. Varieties of shade and very significant effect on flowering. The
experienced a dark period that stimulate flowering. The results of the study Widiastuti et
al. (2004) also showed that the shade can accelerate flowering and harvesting.
The fastest flowering varieties found in Grobogan with age ranging flowering 28.50 DAP is significantly different from other varieties. While the Kipas Merah Bireun varieties that flower later than 38.50 DAP appear different to other varieties (Table 2). This study showed that each variety has a different age flowering time. This is presumably due to the factor of genetic diversity varieties tested. Results of this study are consistent with the research Soverda et al. (2012) which states that the character of flowering in several soybean genotypes differ between genotypes.
Chlorophyll. The results of the data analysis showed that the shade effect on the
amount of chlorophyll a and b and chlorophyll not significantly affect the ratio of chlorophyll a / b, varieties very significant effect on the amount of chlorophyll a and no real effect on the amount of chlorophyll b and the ratio of chlorophyll a / b. The results showed that increasing levels of shade resulted in an increase in the amount of chlorophyll a and chlorophyll b.While the ratio of chlorophyll a / b showed a tendency to decline due to increased shade although no statistically significant differences (Table 3). The highest increase in the amountof chlorophyll a was found in 50% shade with an average amount of chlorophyll at 1:49 mg / ml with a change of 38.37% which is significantly different from the rate of 0% shade (1,08 mg / ml) but not significantly different with 25% shade level (1,16 mg / ml). The same condition occurs in chlorophyll b where the rate of 25% shade changes of chlorophyll b was 42.53% and 65.09% at the 50% level of shade. This is due to the low light plants will work to improve the efficiency of light harvesting by an increase in chlorophyll a and chlorophyll b as a light-harvesting organs.
The results showed that the varieties are generally no effect on photosynthetic character. It is need to reaffirm that the light is environmental factors that influence the character of photosynthesis when other environmental factors in optimum condition.
Character of production. Shade causes a reduced number of pods containing the
decrease in the number of empty pods on shaded conditions associated with a decline in the number of pods due to shade. The number of pods were slightly shaded conditions will encourage the plant to maximize the utilization of photosynthate to pods are formed so as to reduce the number of empty pods. The decrease in the number of empty pods on shaded conditions were also reported by Muhuria (2007).
The weight of 100 seeds was not affected by shade, but is strongly influenced by varieties. The lack of effect of shade on 100 seed weight due to the shaded conditions (25% and 50%) of soybean plants can still carry out photosynthesis and produce seeds with the seed size according to their genetic character. Similar results were also reported by Polthanee et al. (2011) which says that the shade treatment had no effect on 100 seed weight of soybean in the dry season and wet experiments. Research Tang et at., (2010) mentions, shade treatment led to a decrease in grain yield but does not affect the size of the seed.
The data (Table 5) shows the different weight of 100 seeds in different varieties. Weight of 100 seeds found in most varieties Grobogan (17.78 g) which is different from other varieties. This is thought to be caused by genetic diversity.
Shade causes a decrease in harvest index in shade 25% and 50% respectively at 10.64% and 29.66%. Test showed that the difference between varieties of the highest harvest index found in the varieties Kipas Merah Bireun (0.271) which is different from the other varieties except with Grobogan and Sinabung. The decrease in harvest index in shaded conditions due to plant photosynthesis rate decreased so that the distribution of photosynthate to the plant parts harvested crop is reduced, which implies decreasing harvest index. This is evident from the decrease in dry weight of plant due to shade. Anggarani (2005) also reported that the decrease in harvest index due to reduced seed weight per plant, root dry weight and dry weight of the canopy. Differences between varieties harvest index is closely related to differences in seed weight decrease due to interactions plants and varieties in the dry seed weight affects plant-1 (Table 4). The diversity between varieties harvest index also simultaneous with the diversity of plant dry seed weight due to the interaction of shade and varieties. This is presumably due to genetic diversity varieties tested so that each respond differently to low-light stress due to shade.
CONCLUSION
Low light intensity stress 25% and 50% due to the shade resulted in a change in morphology and anatomy of the soybean crop in the form of higher stems, flowering faster and decrease the number of nodes and stover dry weight. Leaf structural changes occur in the form of a decrease in the number of trifoliate leaves and total leaf number, as well as increased trifoliate leaf area and specific leaf area. The amount of chlorophyll a and chlorophyll b increased, while the ratio of chlorophyll a / b is not affected by low light intensity stress due to shade.
and harvest index. While the weight of 100 seeds was not affected by low light stress due to shade.
Low light intensity stress 25% and 50% resulted in a decrease in the amount of production in all varieties tested. Varieties of Kipas Merah Bireun and Grobogan showed consistency as varieties with the highest production than other varieties in conditions without shade and 25% shade and 50%. Shade Stress due to low light by 25% and 50% resulted in a decrease in the production of an average of 29.55 % and 50.22%.
TABLE
Table 2. Trifoliate leaf area, total leaf area, specific leaf area and some varieties flowering at some level of shade
Table 4. Number of pod contains, the number of empty pods and dry seed weight plant-1
several varieties at different levels of shade
REFERENCES
Adisarwanto T, Saleh N, Marwoto, Sunarlim, 2000. Soybean production technology: Food Crops Research and Development Centre, Ministry of Agriculture.
Anggarani, Siska.D . 2005. Analysis Aspects of Agronomy and Physiology of Soybean (Glycine max (L.) Merr.)At Low Light Intensity Stress Conditions.Thesis.The Department of Agricultural Cultivation.Bogor Agricultural University.
Anan Polthanee, Khanistha Promsaena, Anucha Laoken. 2011. Influence of low light intensity on growth and yield of four soybean cultivars during wet and dry seasons of Northeast Thailand. Agricultural Sciences 2 (2011) 61-67
Asadi, B., M. Arsyad, H. Zahara dan Darmijati. 1997. Shade Tolerant Soybean Breeding for and Intercropping. Bul. Agrobio. 1 (2) :15-20.
Atwell, B., P. Kriedeman, C. Turnbull (editors). 1999.Plants in Action; Adaptation in nature, performance in cultivation. Ed ke-1. South Yarra: Macmillan Education Australia PTY LTD. 664 p
Bruce, W.B., Edmeades, GO., Barker, TC.2001. Molecular and physiological approaches to maize improvement for drought tolerance. Journal of Experimental Botany, 53:13-25
Jiang, H. dan D. B. Egli. 1995. Soybean seed number and crop growth rate during flowering. Agronomy Journal 87: 264-267.
Kisman, N. Khumaida, Trikoessoemaningtyas, Sobir, D.Sopandie. , 2007. Character morpho-physiological leaf, soy identifier adaptation to low light intensity in the open and shaded conditions. Bulletin Agronomy (33) (3) : 24-32.
Kurosaki, H. & Yumoto, S. (2003) Effects of low temperature and shading during flowering on the yield components in soybeans. Plant Prod. Sci., 6, 17–23
Levit.J. 1980.Responses of Plants to Environmental Stress.Academic Press. New York. 67 p.
Logan, B.A., B. Demmig-Adams, W.W. Adams. 1999.Acclimation of photosynthesis to the environment.In G.S. Singhal, G. Renger, S.K. Sopory, K.D.Irrgang, and Govindjee (eds). Concepts in Photobiology: Photosynthesis and Photomorphogenesis. Boston : Kluwer Academic Publisher. p.477–512
Muhuria, L. 2007. The physiological mechanism and inheritance of tolerance of soybean (Glycine max (L.)Merrill) to low light intensity.Dissertation School graduate. Bogor Institute of Agriculture
Nerty Soverda. 2012. Tolerance Test Adaptation and several varieties of Soybean Plants on Artificial Shade. Journal of Agronomy Faculty of Agriculture Unja, National Publication Agriculture Science, Vol, No, January-March 2012.
Sasmita, P., B.S. Purwoko, S. Sujiprihati, I. Hanarida, I.S. Dewi, M.A. Chozin. 2006. Evaluation of growth and production of upland rice double haploid shade tolerant in intercropping systems. Bul. Agron.34 :79-86.
Sukaesih,2002. Microclimate character studies at various levels of shade of rubber trees and their effects on the growth of 20 genotypes kedelai.Skripsi.Institut Pertanian Bogor.
Supriyono B, Chozin MA, Sopandie D, dan Darusman LK. 2000. Balance Starch and Sucrose Sucrose Phosphate Synthase Enzyme Activity in Upland Rice is tolerant and sensitive to shade. Hayati, 7 (2) :31-34.
THE STUDY OF BIODEVERSITY ABOUT THE PRESENCE
OF SOIL AND WOOD FUNGUS ALSO POTENTIAL
BREEDING IN SIBOLANGIT FOREST TOURISM, NORTH
SUMATERA
1
Hasruddin,2Ratna Dewi
1,2Postgraduate Program of Medan State University.
E-mail: [email protected]
Abstract
This study aimed to obtain the data about the presence of soil and wood fungi and the types of soil and wood mushrooms in Sibolangit Forest Tourism, North Sumatera. This study used an exploratory survey method in qualitative descriptive data. The sampling technique was done by using “Purpossive Sampling”. The Data is obtained to explain the presence of Wood and Soil Fungus,along with the poisonous test of fungus using garlic to identify poisoning ability of fungi being sampled. The fungus sample is also taken on the need of identification and documentation of the data. The result of this study showed that in Sibolangit Forest Tourism, North Sumatera, found soil and wood fungus as much as 24 genus, such as: Gyroporus sp., Cantharellus sp., Phellinus sp.,
Ganoderma sp., Tremella sp., Craterellus sp., Marasmius sp., Nalanea sp., Inocybe sp., Crepidotus sp., Stereum sp., Calocera sp., Fomes sp., Auricularia sp., Clitocybe sp., Polyporus sp., Aleuria sp., Caprinus sp., Coriolus sp., Microglosum sp., Corticium sp., Clavaria sp., Calvatia sp., Pholiota sp., and 1 genus of soil fungus is Amanita sp. At the time of the study physical data of
Sibolangit Forest Tourism showed that soil temperature approximately 22,50C–25,50C, soil pH is 6,2 – 6,8. Air moisturity is 84% - 92%. Light intensity is 400 – 900 Luxmetre, and wood pH approximately 6,3–6,9.
Keywords: Fungus, Biodeversity, Soil, Wood, Breeding.
INTRODUCTION
Covering a large group of living things, Fungi include the estimated 300,000 various types that can be found in Indonesia (Tjirosoepomo, 2002). It can grow anywhere, either on foodstuffs, soil, rotted logs, or even in human body (Suriawiria, 1986). Mushrooms (fungi) can be beneficial and detrimental to humans. In relation to profitable aspect of fungi, it can be used as food, cosmetic, drugs, and food-beverage starteringredients.
live in the leaves of a forest plant and the one that live in the bark of plants, roots, and stems.
Mushrooms act as decomposers that help the process of decomposition of organic matter and helping for a matter recycling process in the forest ecosystem. Wood fungus is a large number of fungi that can be found in the wood and forminga decayed wood. Most of mushrooms that have a very strong cellulosic activity can grow on still alive wood and trees. They can also be found live on dead wood. These types of fungi are belonging to the Basidiomycota (Ganjar, et al. 2006).
Bukit Barisan Forest Park, which is located in Tahura Sibolangit, North Sumatra province, has the potentially diverse fungi that grow inside it. Mushrooms grow easily either at ground level or on plant stems, trunks or the decaying matter. Therefore, research is necessary to reveal both the diversity of fungi that live on the surface of the soil, as well as those that grow on the surface of the wood/stem of the plant. The study is limited to a distance of 200 meters to the south of the Tahura Sibolangit gate entrance. The studies have analyzed morphology, diameter, colors and shapes, and the classification of mushroom at the genus level. The problem in this study are: (1) What Group of wood fungi and soil fungi that can be found in Tahura Sibolangit?; (2) What is the potential of the wood mushrooms and mushroom land cultivation that can be found in TahuraSibolangit.
METHODOLOGY
The research was done in Sibolangit tourism forest, Sibolangit, Deliserdang District, North Sumatra. The area of study is of approximately 40 km from the city of Medan. The topography of this area is located at an altitude of 480 meters above sea level and slightly tilts toward the northeast with the overall area of 110 hectares and the tourist area with a total area of 28 hectares.
The Location of Sibolangit tourims forests consists of a plateau with a wet condition and the approximately 50 species of plants biodiversity potential, fauna such as mouse deer (Tragulusjavanicus), owa (Hylobatesmoloch), siamang (Hylobatessyndactilus), and owls (Bubo sumatranus) can be found here. Another potential that were possessed by this forest is as a source of water for Medan and surrounding areas, in addition to having a potentially steep cliffs to sport climbing (Anonymous, 2000).
Exploratory survey was conducted by using research object sampling techniques, over a period of 2 months. Morphological observation, the observation of shape, color, and toxicity test were done to the object being sampled. Collections of fungi were found to be matched with the images and data from manual classification of fungi (Smith and Weber, 1980).
of forest canopy in Sibolangit Tourism found to be unevenly covered the surface of the ground.
RESULT AND DISCUSSION
Based on the data obtained: (1) Genus Auricularia. These fungus habitations areon rotten wood. Fungal fruiting bodies found to have reddish colorwith a slimy texture, size ranging from 6-10 cm. These types of fungi are usually the edible one. (2). Genus Clitocybe. This one is a type of wild living mushrooms, the young fungi is edible one while old living one can cause dizziness when someone consumed it. This type fungus has a cap that opens out or the umbrella-shaped one withcolor ranging from white, yellowish, to light brown. (3) Genus Microglosum. These fungus habitations areon rotten wood and found to have black color, the size of this fungus approximately 2-4 cm, and they includes poisonous mushroom.(4). Genus Clavaria. These fungus habitations areon decaying logs. In addition they are also found to grow on the top soil.This fungus can be found in color ranging from white or yellowish and white-bluish too. The young mushrooms are edible (5). Genus Corticium. This fungus has an even body fruit and attached to the crust-like substrate and slightly wrinkled fruit body. These fungus habitations areon wood and most live as parasites. (6). Genus Coriolus. This fungus is similar to genus Polyporus, shaped like a fan and also lives in rotten wood or an already dead wood. The fungus is white in color and possesses hard texture.
(7). Genus Polyporus. This fungus fruit flesh is hard. Size of less than 10 cm, the fungus also called board fungi because of its widening appearance.These including the wild mushrooms that grow attached to the trunks of dead wood and there are also living on rotten wood, greenish yellow in color with an unclear stem but and a fan-like cap. (8). Genus Pholiota. This fungus grows on a pile of leaves and also attached to the rotten wood. Shaped like an umbrella, the color of these types of fungi are brownish in its trunk-like part,with the cap also has the same color as the trunk. (9). Genus Calvatia. Thecolors of these fungi are ranging from white to yellowish white. The inside part of the old one turn into powder that can be waft out and fly to any direction if we press the body.
(10) The genus Ganoderma. Upper and lower surfaces of this fungus found to have shiny appearance and edge of white color that surround it. The diameter of this type of fungus is less than 4 cm, while the stalk is less than 2-4 cm in length, this fungus can also be used as a drug. (11). Genus Gyroporus. These mushrooms have a black stalk, dark brown mushroom fruit body, with a serrated edge, and can be found ontwig with a diameter of approximately 3.5 cm. (12). Genus Cantherrelus. This mushroom has a white stalk, an evenly round shape fruit body, jagged edges, and gray to brown color of fruit body. It can be found to live onthe twig(diameter of approximately 6.5 cm).
semi-circular shape, with a diameter of approximately 6 cm.(15). Genus Aularia. This fungus has a soft pulp, glossy red color of the upper surface, the lower surface are somewhat blackish on the edges, while the center is white, round shape with a diameter of approximately 4.3 cm. (16). Genus Craterellus. White fungus stalk, a trumpet-like shape, smooth light brownsurface, flat edge and roll up, while the lower surface is white, with a diameter of approximately 6.5 cm. (17). Genus Marasmius. White stalk of the fungus with a size of approximately 1 cm, the colors of surface edge are ranging from white to light brown, with the soft flesh, the lower surface have brownish whiteor yellowish white range of color with a diameter of approximately 1.8 cm, this type of fungus can be found on rotten wood.
(18). Genus Nolaena. Mushroom stalks is black in color, with a size of approximately 0.9 cm, found to havelight brown color of it talus surface, have a cup shape and fungus habitations are on weathered wood with a diameter of approximately 1.2 cm. (19). Genus Inocybe. This fungus habitation areon wood, with a diameter of approximately 0.8 cm, and the talus is found to have dark brown color, also with a cup shape. (20). Genus Crepidotus. This fungus forms a round, soft flesh, russet, and wrinkle white lower surface, fungus habitations are on twig with the approximately 3 cm in diameter.(21). Genus Amanita Sp. This fungus has a diameter less than 1.2 cm, upper surface insulated and white, while the lower surface is flat and white. (22). Genus Tremella. This fungus has a hard flesh, white edge, and gray color with black bottom. The diameter of this fungi is1.1 cm can be found also to live on the twig. (23). Genus Stereum. This is a ellipse mushroom shaped, with a white flat edge while the middle part of it is found to have a wrinkle shape, shriveled under the surface, the habitat on decayed wood with a diameter of approximately 1.5 cm.
(24). Genus Calocea. These mushrooms have a stalk that is approximately 1.3 cm in size, irregular shape talus-like leaves, white color, and a diameter of approximately 1.7 cm. (25). Genus Caprinus. This mushroom stalk is yellowish white in color with a size of approximately 3.5 cm, having a light browntalus, with brown edges, a an umbrella-like shape and lower insulated part with a diameter of approximately 1.6 cm. This fungus can be found to have white (yellowish white) in younger age with also some of it found to have bluish white color.
From the 25 genera found in Tahura Sibolangit, two of which found are poisonous one, genus Amanita and genus Microglosum, while the other 23 genus has the potential to be cultivated. Genus Genus Tremella and Clavariace are the genus that dominates the Tahura forest area, in which this genus of fungi live on a little bit open area, with a bit of light intensity, and temperature of 16-180C, and a very high humidity. Rahayu (2004) states that environmental factors determining the spread and growth of an organism and make them able to live in certain circumstances on certain tolerance range suitable for that organism. Carlile and Watkinson (1994) explained in addition that that the fungus generally grows best in a moist place.
(2000) that the forest with 7200 mm rainfall / month, temperatures range between 16.8-230C, and high humidity (over 80% kurag) can give the optimum growth for fungus. Similarly Tahura sibolangit foresr has the potential for mushroom cultivation because of environmental factors that support it.
If a mushroom cultivation is established without destroying the forest, it will have an impact on the growth of economic activities in the surrounding communities. This is in line with the opinion Suriawiria (2000) that success in agribusiness of wood fungus will increase ones incomes. Thus, Tahura as tourism object in Sibolangit village has the potential for mushroom cultivation, in which cultivation can be done without deforestation by utilizing rotten wood and the branches of trees as a means for the growth of fungi. To support this, both management of forest along with functional management is needed to be performed optimally.
CONCLUSION
Based on the research findings, it can be concluded that the region of Sibolangit Forest Park has a diversity of wood and soil fungiwith the most dominant Genus are Tremella and Clavariace. Wood mushroom cultivation potential for foodstuffs, cosmetics, and pharmaceuticals can be done without destroying the forest by optimizing the management of forest functions.
REFERENCES
Anonim. 2000. Informasi Kawasan Konservasi Provinsi Sumatera Utara. Medan: BPS. Arora, D. 2000. Mushrooms Demystified. California: Ten Speed Press.
Bakhrun, M. 2007. Jamur Tiram. Bogor: PenebarSwadaya.
Carlile, M.J. dan Wakitson, S.J. 1994.The Fungi. London: Academy Press HarcoutBrase& Company Publisers.
Ganjar, I., Ariyanti.,danWellyzar, S. 2006. Mikologi Dasar dan Terapan. Jakarta: Yayasan Obor Indonesia.
Rahayu, G. 2004. Biologi Cendawan : Fisiologi Cendawan. Bogor: FMIPA.
Smith, I.H. dan Webber, N.S. 1980. The Mushroom Field Guide. USA: The University of Michigan Press.
Suriawiria, U. 1986. Pengantar untuk Mengenal dan Menanam Jamur. Bandung: Angkasa.
GEOPHYSICAL INVESTIGATIONS ON
ARCHEOLOGICAL SITE OF KUTA LUBOK TSUNAMI
HERITAGE
1
Muhammad Yanis,2Fauzi Andika,3Sri Wahyuni,3Nazli Ismail,2Marwan,3Gunawati
1
Master of Physics Department, Postgraduate Studies, Syiah Kuala University
2Department of Geophysical Engineering, Faculty of Engineering, Syiah Kuala University 3Physics Department, Faculty of Mathematic and Natural Science, Syiah Kuala University
Email : [email protected]
Abstract
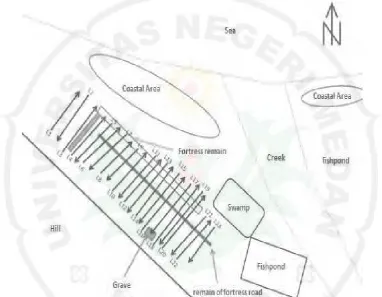
The giant tsunami 2004 that hit Aceh not only lead disasters but also caused political changes in Aceh Province. Two events of Paleotsunami in 13thand 14thcenturies are also believed to be the cause of the collapse Lamuri Sultanate in Aceh at the time. One of the historical Lamuri heritages is Kuta Lubok in Lamreh, Aceh Besar, which can be considered as one of paleotsunami heritages. Kuta Lubok was a fortress as well as a trading center during the Sultanate time. In this paper we have examined and mapped structure of the former fort building using geophysical methods including Very Low Frequency (VLF), Magnetic, and Ground Penetrating Radar (GPR). Based on data interpretation, wehave been able to locate some remaining buildings structures buried below the subsurface, i.e. the fortress walls, roads construction, and cemeteries’ area. We believed the results of this research are important to support further studies of Paleotsunami in the area.
Keywords: Paleotsunami, tsunami heritage, geophysical methods.
INTRODUCTION
Aceh is the gateway to the Southeast Asia which plays an important role of sea transport traffic in the past. Therefore, the fame of Aceh in the past is not only recorded by historical documents around the world, but also it proved by some physical evidence remains of its former glory in the form of archaeological sites. Along the beach of Banda Aceh and Aceh Besar, for examples, we can found many historical heritage sites; one of them is legacy of Lamuri Sultanate the 9thcentury (McKinnon, 1998).
heritage sites of Lamuri Sultanate. In this paper we explain preliminary results of geophysical studies on the area. We have mapped back some historical remnants buried beneath the surface. We usedgeophysical methods,i.e. Very Low Frequency (VLF), magnetic, and Ground Penetrating Radar (GPR) techniques for subsurface mapping inthe area. Application of geophysical methods to archeology has been widely used, but using the methods for archaeological studies related to Paleotsunami is very rare.
The VLF method make uses electromagnetic waves in the low frequency band of 15-25 kHz generated by radio transmitters. The transmitters are normally used for long-range communications and navigational systems. At large distance from the transmitter the wave is planar and horizontal. When the wave passes over a conductor, induced eddy currents cause secondary electromagnetic fields and the primary field is tilted. By mapping this tilt, anomalous conductors can be observed. Using the VLF method to archeological studies was quite rare, since the method is more suitable for detecting large conductive structures.The accuracy of the method is not sufficient for detailed prospecting. However it has been used to find buried pyramids by Deletie,et al.(1988).
A GPR system consists of antennae, a control unit and a display. The GPR technique is based on transmitting electromagnetic pulses from a dipole antenna into the ground and measuring the time until the reflected waves reach a receiver antenna.Usually frequencies between 200 and 500 MHz are used in archaeological investigations. Since the frequency is proportional to the inverse of the wavelength, a low frequency used implies a low resolution, although the depth penetration increases. Amplitude of the reflected wave can give information about the difference between the properties of two adjacent layers. Increasing difference between the dielectric permittivity of adjacent layers in the soil profile gives increasing amplitude of the reflection (Conyers and Goodman, 1997).
MAGNETIC METHOD
The magnetic method involves the measurement of the earth's magnetic field intensity. Typically the total magnetic field and vertical magnetic gradient is measured. The Earth possesses a magnetic field caused primarily by sources in the core. The intensity of the Earth's field is customarily expressed in S.I. units as nanoteslas (nT). The Earth's magnetic field dominates most magnetic measurements made at or near the surface of the Earth. The Earth's total field intensity varies considerably by location over the surface of the Earth. The magnetic method has been widely used in archeological site such as discovery of an ancient pharaoh’s temple (Elharabi, 2009).
RESULT AND DISCUSSION
separation was 10 meters, t current density valueswere based on the magnetic fields some structures of fort buildi the fortress structures were
Fig 1. Location map of the ar geophysical methods
Figure 2.
s, the total of overall data was 156 points, as se re calculated using the Karous Hjelt filter (ka elds intensity. Figure 2 shows current density da buildings by low current density values.Based on
re composed by volcanic rock that is mostly resi
e archeological site Kuta Lubok and the selecte ods work.
e 2. Current density anomaliesof VLF-EM data.
s seen on Fig. 1. The (karous Hjelt, 1956) data.The data reveal d on field observation,
resistive.
cted locations for the
[image:33.595.112.495.167.464.2]As a complementary method for the VLF method, Magnetic survey was applied at the same locations of the VLF area, but with a very tight profile (i.e., station separation was 5 m and the profile separation was 5 m). The magnetic PPM measurements, including the total magnetic field have been conducted in the study area. Regional anomalies have been removed from the magnetic field data so that the local anomalies represented shallow depth structures.
The residual anomalies data (Fig. 3) shows the fortress structuresby contour lines ofthe residual anomalies. The closure anomalies mostly follow geometry of the remaining fortress and former road structure entering the fort as well as cemeteries area.
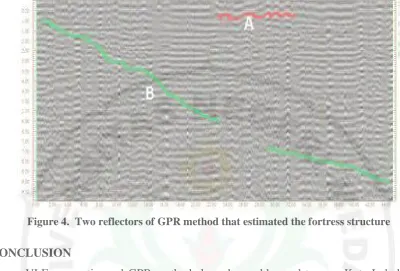
[image:34.595.80.522.300.716.2]As a complementary of the two former methods,magnetic and VLF,the similar structures were also found in GPR measurement (Fig. 4).We have been able to show two reflectors from the GPR images. The first is a flat reflector (A) was suspected as the man-made structure such as old road material and the stepping reflector (B) starting from the beginning of the profile was estimated as bedrock structure.
Figure 4. Two reflectors of GPR method that estimated the fortress structure
CONCLUSION
VLF, magnetic, and GPR methods have been able used to map Kuta Lubok site. Based on data interpretation, we have constructed Kuta Lubok fortress map including the outcrops, buried fortress structures, old road, cemeteries, and depth of bedrock at the subsurface (Fig. 5).The information gathered from our interpretation can be used for paleotsunami studies on the area as well as for conservation of Kuta Lubok paleotsunami heritage.
[image:35.595.79.524.393.698.2]REFERENCES
Majalah Tempo, Babad Tsunami di Tanah Rencong, 10 Februari 2011.
Blakely, R.J., 1995. Potential Theory in Gravity and Magnetic Applications, Cambridge University Press, USA.
Fatria, Budi. 2012. Selamatkan Situs Lamuri, Serambi Indonesia, 22 Juni: 16.
Karous, M., Hjelt, S.E.,1983. Linear filtering of VLF dip angle measurements. Geophysical Prospecting 31, 782–794.
Kjell Persson, 2005, Integrated Geophysical-Geochemical Methods For Archaeological
Prospecting, KTH Architecture and the Built Environment.
Khalil, M.A., Abbas, A.M., Santos, F.M., Mesbah, H., Massoud, U., 2010. VLF-EM
study for archaeological investigation of the labyrinth mortuary temple complex at Hawara area, Egypt.Near Surface Geophysics.
McKinnon, E.E., 1998, “Beyond Serandip: A Note on Lambri at the Northern Tip of Aceh’’, Indonesia, 46, 102-121.
Nabighian, Misac. N, 1992, Electromagnetik Methods in Aplied Geophisics–Applications Part A and Part B, Tulsa, Oklahoma.
Oetomo, R.W. 2008. Lamuri Telaah Islam Sebelum Pasai. Balai Arkeologi Medan.
Santos, F.M., Hany, A. Mesbah. Lethy, Ahmed. 2012. The implementation of multi-task
geophysical survey to locate Cleopatra Tomb at Tap-Osiris Magna, Borg El-Arab,
Alexandria, Egypt ‘‘Phase II’’.NRIAG Journal of Astronomy and Geophysics.
EFFECT OF DOSAGES ARBUSCULAR MYCORRHIZAL
FUNGI (AMF) ON P UPTAKE, GROWTH AND YIELD OF
SOYBEAN IN ULTISOLS SOIL
1,2
Nurmasyitah,2Syafruddin,2Muhammad Sayuthi
1
Program Studi Agroekoteknologi Fakultas Pertanian Universitas Malikussaleh, Reuleut-Aceh Utara
2Program Studi Magister Agroekoteknologi PPs Universitas Syiah Kuala
Darussalam-Banda Aceh Email: [email protected]
Abstract
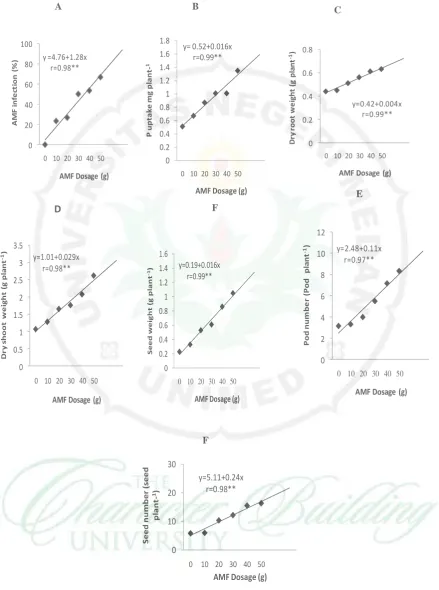
This study was aimed to determine the effect of AMF dosage within Ultisols soil onto AMF infection, P uptake, growth and yield of soybean. This research was conducted in Keutapang village, Syamtalira Aron district, North Aceh, on April to October 2013. Statistical design used in this study was randomized block design. The dosages of AMF consisted of six levels, namely 0, 10, 20, 30, 40, and 50 g per pot in 3 replications and 2 experimental units which were the vegetative phase and the generative phase. The result showed that the dosage of 50 g per pot of AMF was the best result. The dosage of 50 g per pot could increase AMF infection up to 66,7%, P uptake 1,35 mg per plant, dry root weight 0,63 g per plant, dry shoot weight 2,61 g per plant, pod number 8,33 pod per plant, seed number 16,33 seed per plant, and seed weight 1,05 g per plant. Ultisols soil which was taken from Buket Rata had correlated highly to AMF dosages. The dosages of AMF positively correlated to AMF infection degree, P uptake, dry root weight per plant, dry shoot weight per plant, pod number per plant, seed number per plant, and seed weight per plant.
Keywords:Ultisols soil, arbuscular mycorrhizal fungi , P uptake, growth, and soybean
INTRODUCTION
Ultisols disseminating in Aceh is 699,000 ha. Ultisols soil problem is due to the level of advanced weathering and lead leached content of bases which reacts becoming to acidic soil (pH 4– 5,5) (Darmawijaya, 1997) and has high Al saturation (Subagyo et al., 2000). Macronutrients, especially P, K, Ca, Mg and organic matter content are low in