THE USE OF AUDIO
VISUAL AIDS IN IMPROVING STUDENTS’
VOCABULARY MASTERY IN WRITING DESCRIPTIVE TEXTS
(A Quasi-Experimental Study at the Second Year Students of a Junior High School in Bandung)
A Research Paper
By
Hafidh Indrawan
0609155
ENGLISH EDUCATION DEPARTMENT
FACULTY OF LANGUAGE AND ARTS EDUCATION
INDONESIA UNIVERSITY OF EDUCATION
THE USE OF AUDIO VISUAL AIDS IN IMPROVING STUDENTS’
VOCABULARY MASTERY IN WRITING DESCRIPTIVE TEXTS
Oleh
Hafidh Indrawan
Sebuah skripsi yang diajukan untuk memenuhi salah satu syarat memperoleh gelar Sarjana pada Fakultas Pendidikan Bahasa dan Seni
© Hafidh Indrawan 2013
Universitas Pendidikan Indonesia
Februari 2013
Hak Cipta dilindungi undang-undang.
Skripsi ini tidak boleh diperbanyak seluruhya atau sebagian,
ABSTRACT
The study aims to investigate if the audio visual aids can improve students’ vocabulary
mastery and to investigate the students' responses toward the use of those audio visual aids.
To achieve these aims, quasi-experimental research design was employed. The data were
gathered from eighth grade students in a junior high school in Bandung. Two classes
contained 60 students were taken and divided into experimental and control group. Some
instruments like pre-test - post-test and questionnaire were employed to collect the data. At
the end of the study, both groups indicated to experience improvement, but experimental
group showed more advanced enhancement indicated by their four times larger effect size.
It also indicated good responses from the 90% of the students. Furthermore, this study also
figured out some factors which were influence those students’ improvement. Those factors
were media and teacher. Therefore, those factors are needed to be concerned before the
2.1.1 Importance of Vocabulary in Writing ……… 13
2.1.2 Writing Descriptive Text ………... 15
2.2 Vocabulary ………. 16
2.2.1 Importance of Vocabulary Learning ………...……..… 17
2.2.2 Vocabulary Learning Strategies ………. 19
2.3 Audio Visual Aids ………..……….. 20
2.3.1 Use of Audio Visual Aids in Teaching Learning Process… 21 2.3.2 Use of Audio Visual Aids in Vocabulary Learning ……… 23
2.3.3 Influence of Audio Visual Aids to the Vocabulary Learning 25 2.4 Audio Visual Aids, Vocabulary, and Writing ……….. 26
3.5.1 Scoring on Instrument Try Out, Pre-test and Post-test …… 37
3.5.3.2 Variance Homogeneity Test ………. 43
3.5.3.3 t-test Computation ……… 43
3.5.3.3.1 Independent t-test Computation on Pre-test 44 3.5.3.3.2 Independent t-test Computation on Post-test 45 3.5.3.3.3 Dependent t-test ………... 46
3.5.3.3.3.1 Dependent t-test on the Experimental Group Score ……….. 46
3.5.3.3.3.2 Dependent t-test on the Control Group Score ……… 47
3.5.3.4 Calculation of the Effect Size ………. 48
3.5.3.4.1 Calculation of the Effect Size on the Dependent t-test ………... 48
3.5.4 Data Analysis on Questionnaire ……….. 49
CHAPTER IV: FINDINGS AND DISCUSSION 4.1 Findings ……….. 50
4.1.1 Computation of the Pre-test Score ……… 50
4.1.1.1 Normality Distribution Test ……….. 51
4.1.1.1.2 Normality Distribution Test of the
Control Group Score ………. 52
4.1.1.2 Variance Homogeneity Test ………. 52
4.1.1.3 Independent t-test ………. 53
4.1.2 Computation of the Post-test Score ……… 54
4.1.2.1 Normality Distribution Test ……….. 54
4.1.3 Computation of the Experimental Group Score ……… 57
4.1.3.1 Computation of the Dependent t-test ……… 58
4.1.3.2 Computation of the Effect Size ………. 59
4.1.4 Computation of the Control Group Score ………. 59
4.1.4.1 Computation of the Dependent t-test ……… 60
4.1.4.2 Calculation of the Effect Size ……… 61
4.1.5 Result of Questionnaire ………. 61
4.2 Discussion ………. 63
CHAPTER V
:
CONLUSIONS AND SUGGESTIONS 5.1 Conclusions ……….. 705.2 Suggestions ……….. 72
REFERENCES
APPENDICES
CHAPTER III
RESEARCH METHODOLOGY
This chapter elaborates the methodology applied in the study. The discussion of
this chapter includes research design, population and sample of the research, data
collection, research procedures, and data analysis.
3.1 Research Design
This study conducted quasi-experimental design. It was taken because the
participants of this study were not chosen randomly, but they were already part of the
groups (Jackson, 2009, p.318). In this case, the groups were class VIII-A and VIII-B.
Furthermore, this study provided pre-test - post-test to both experimental and control
group. It was considered as nonequivalent control group pre-test – post-test design.
“Nonequivalent control group pre-test – post-test design is an experimental design in
which at least two nonequivalent groups are given a pre-test, then a treatment, and then
a post-test measure” (Jackson, 2009, p.323). Schematically quasi-experimental research
design using nonequivalent control group pre-test – post-test design is depicted as
follow:
Group Pre-test Treatment Post-test
Experimental Group O1 X1 O2 ………..
Note: - O1 and O3 show the initial ability of students’ vocabulary mastery.
- O2 shows the ability of students’ vocabulary mastery after given a special
treatment.
- O4shows the ability of students’ vocabulary mastery without given a special
treatment.
- X1 and X2 refers to certain treatment that given to the students.
(Adapted from Sugiyono, 2010: 79)
Based on the figure above, in order to find out whether the treatment has effect
on the performance of the groups, the differences between O1 - O2 and O3 - O4 were
further compared.
3.2 Population and Sample
Population of this study was all students of second grade in one junior high
school in Bandung enrolled in academic year 2012/2013.
To determine the sample of this study, the sampling technique used was
purposive sampling. Purposive sampling is a sampling technique with particular
consideration (Sugiyono, 2010: 85). This study took two classes as the sample of the
study. They were class VIII-A and VIII-B, however, only 30 students from each classes
were decided to be the sample of this study. The first 30 students from class VIII-A
participated as experimental group and other 30 students taken from class VIII-B
participated as control group. The focus of this study was on improving students’
subjects were eighth-grade students where they study descriptive texts. It was taught in
odd semester which was coincided with the time of this study taken.
3.3 Data Collection
3.3.1 Research Instrument
Pre-test – post-test in the form of writing test were employed as the instruments
to collect the data for this study in order to be able answering the first research question.
The writing test given was focused on collecting the data of students’ vocabulary
mastery. That was in line with the aim of this present study. The writing test given was
consisted of two kinds of test. They were “fill in the blank” form and describing some
pictures given.
In addition, another instrument used in this study was questionnaire. The
questionnaire was given to the experimental group and the results of it were used to
support the data of the first research question. In detail, the instruments of this study
could be more explained as below:
3.3.1.1Pre-test
Pre-test was given to both experimental and control group in the beginning. It
was aimed to find out the initial ability of students’ vocabulary mastery before the
groups was given a different treatment. The test consisted of 20 questions in the form of
“fill in the blank” and 20 questions of describing some pictures given.
Post-test was given to both experimental and control group after the different
treatment given to the both groups. The post-test given was aimed to find out the
students’ progress of vocabulary mastery after the treatment conducted to the both
groups. The test was similar to pre-test; it consisted of 20 questions in the form of “fill
in the blank” and 20 questions of describing some pictures given.
3.3.1.3Questionnaire
Questionnaire was given only to the experimental group who has experienced
the treatment of the use of audio visual aids during their learning process. The
questionnaire given was aimed to find out the students’ responses toward the
vocabulary learning and the use of audio visual aids in their teaching learning process.
The questionnaire consisted of 10 closed-ended questions. Closed-ended question is a
question that contains a set of answer that a respondent chooses (Beins, 2012: 264).
Every single of question item was related to the topic and condition when the students
used audio visual aids in their learning process. The format of questionnaire was based
on Likert Scale. Likert Scale is used to measure the attitudes, opinions, and perceptions
of a person or group of people about social phenomena (Sugiyono, 2010: 93). Likert
Scale consisted of five responses category: strongly agree, agree, neutral, disagree, and
strongly disagree.
3.4.1 Preparation
The schedule program was planned for nine meetings. The first meeting was
used to conduct a tryout of the instruments of this study. The next meeting was used to
conduct the pre-test and the third to seventh meetings were allocated to implement the
lesson in the classroom. The post-test and questionnaire were administered in the rest
two meetings.
A preparation in doing the research in this study involved designing lesson plan
and preparing materials. There were five lesson plans provided to be implemented in the
treatment of the use of audio visual aids for experimental group. The lesson plans were
designed based on 2006 English School-Based Curriculum for eighth grade students.
The five lesson plans were all based on the standard competence and competence of
descriptive text learning. In addition, for the control group, the lesson plans were
designed similar to the experimental one. The differences were on the learning media
and materials used.
Learning materials in teaching learning process of the experimental group
included descriptive texts, pictures (in slides), audio files, and the limited authentic
materials available in the classroom that were related to the descriptive texts topic. On
the other side, the learning materials used in the teaching learning process in the control
group included descriptive texts, textbook that were related to the descriptive texts
topic.
In the very beginning, the instrument test was administered to students outside
the experimental and control group in order to measure the validity, reliability,
difficulty level, and discrimination level of the instruments employed. So, after it’s
proven then it could be surely say that the experimental and control group used good
instrument test to assessed their vocabulary mastery.
3.4.3 Pre-test
Pre-test was administered to both experimental and control group in the first
meeting. It was aimed to find out the initial ability of students’ vocabulary mastery. As
many 60 students from the experimental and control group taken the test.
3.4.4 Treatment
The treatment program was done in five meetings in the experimental group.
The use of audio visual aids in the teaching learning process was provided as the
treatment to the experimental group. It was aimed to improve students’ vocabulary
mastery. The audio visual aids employed in this study were pictures (in slides and/or
printed-out) and audio files (voice-recorded and spoken text). In addition, both audio
and visual aids were not regularly used as a combination. However some of teaching
learning process just used either audio aids or visual aids.
The treatment program in the control group was done in five meetings. Five
meetings in the control group showed the same pattern of teaching. The descriptive text
materials and vocabularies presented in text alone.
Post-test was administered to 60 students of both experimental and control group
in the last two meetings. It was held after the treatment had done, because it was aimed
to find out the students’ progress in term of their vocabulary mastery after getting the
treatment. In other word, the post-test could be the data to help this study in finding out
whether there are any differences between the experimental group who was treated with
the use of audio visual aids and the control group who was treated with the text alone.
3.4.6 Questionnaire
In the last meeting from the whole eight meetings, the chance was used to
administer the questionnaire to students. The questionnaire discussed about vocabulary
learning and the use of audio visual aids in the teaching learning process. So, the
questionnaire was administered to the experimental group only who had experienced the
treatment of the use of audio visual aids in their learning process.
3.5 Data Analysis
The data needed which were collected, were further analyzed to find out the
result of this study. The data analysis included the scoring technique, data analysis on
instrument tryout, data analysis on pre-test – post-test results, and data analysis on the
results of the questionnaire.
Since the test was in two different forms of instructions, the way to score each of
them needed two kinds of scoring technique. In detail, the scoring technique used for
“fill in the blank” question form, are as follow:
S = R
Where: S = Score
R = Right Answer
(Arikunto, 2003)
To score the students’ work on the second test with the instruction to describing
some pictures given, a writing rubric was applied. The detail of the writing rubric could
be seen in Appendix C.
3.5.2 Data Analysis on Instrument Try Out
The aim of analyzing the instrument of try out was to investigate its validity,
reliability, difficulty level, and discrimination level. It was conducted since good
instrument test was required to measure the proficiency level of English language
learners. In this case was students’ vocabulary mastery.
3.5.2.1 Validity
To find out the validity of instrument items, this study conducted Pearson’
Product Moment Correlation. The calculation process used SPSS v.17.0. Correlation
technique is one of techniques that is mostly used until now by researchers to find out
In interpreting the result, the minimum criterion of a valid instrument was at 0,3
correlation coefficient. “The instrument item which has high and positive correlation
with the total score, it shows that the item has high validity too. Usually, the minimum
requirement to qualify is if r = 0,3” (Masrun, 1979 cited in Sugiyono 2010: 134). So, if
the correlation coefficient between item and total score is bigger than 0,3, then the
instrument item is stated valid. Whereas, if the correlation coefficient is lower than 0,3,
then the instrument item is stated not valid. “all items that reach a minimum correlation
coefficient of 0,30 is considered satisfactory on its distinguishing power” (Azwar, 1999
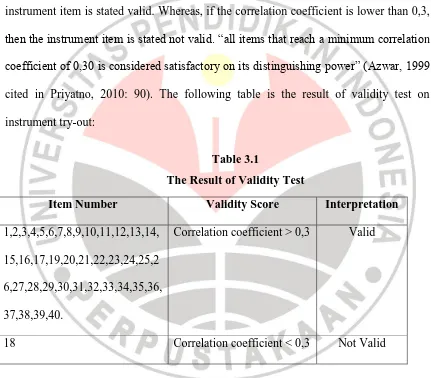
cited in Priyatno, 2010: 90). The following table is the result of validity test on
instrument try-out:
Table 3.1
The Result of Validity Test
Item Number Validity Score Interpretation
1,2,3,4,5,6,7,8,9,10,11,12,13,14,
15,16,17,19,20,21,22,23,24,25,2
6,27,28,29,30,31,32,33,34,35,36,
37,38,39,40.
Correlation coefficient > 0,3 Valid
18 Correlation coefficient < 0,3 Not Valid
Based on the table above, 39 items were valid and 1 item was stated not valid.
The valid items could be used as research instrument. So, the total items that could be
used as the instrument in this study were 39 items. Moreover, the detail results of
3.5.2.2 Reliability
A good instrument is instruments which consistently can give data that matched
with the reality (Arikunto, 2003: 86). Therefore, a reliability test was required to find
out whether the instrument test of this study could provide consistent result of the data
or not.
To find out the reliability of the instrument test, this study conducted two kinds
of method. It was because the instruments in this study had two kinds of questions type.
It was objective and subjective questions. To test the reliability of subjective questions
(essay), it could not use the same way as objective questions in reliability test
(Arikunto, 2003: 109). Therefore, Spearman-Brown formula was used to test the
reliability of objective questions, number 1 to 20 and Cronbach’s Alpha was used for
subjective questions from number 21 to 40. In calculating the data, SPSS v.17.0 was
used in this study. Furthermore, in interpreting the result, the criteria of correlation
coefficient interpretation by Sugiyono (2010) was used in this study.
The result of reliability test for objective questions by conducting
Spearman-Brown formula in SPSS v.17.0 showed that the instrument has moderate level of
reliability. The score was at 0,532. While, the result of reliability test for subjective
questions by using Cronbach’s Alpha in SPSS v.17.0 showed that the instrument had
very high level of reliability. The score was at 0,967. In addition, the detail results of
reliability test of instrument items may be seen in Appendix C.
In order to give an appropriate and acceptable test for students, analyzing the
level of difficulty test items was required to be done in this study. The computation of
difficulty index test on instrument try out employed Anates v.4. In interpreting the
result, the criteria of difficulty index interpretation by Arikunto (2009) was used in this
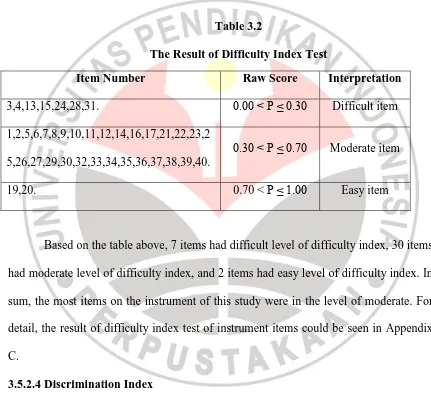
study. The following table is the result of the difficulty index test:
Table 3.2
The Result of Difficulty Index Test
Item Number Raw Score Interpretation
3,4,13,15,24,28,31. 0.00 < P ≤ 0.30 Difficult item
1,2,5,6,7,8,9,10,11,12,14,16,17,21,22,23,2
5,26,27,29,30,32,33,34,35,36,37,38,39,40.
0.30 < P ≤ 0.70 Moderate item
19,20. 0.70 < P ≤ 1.00 Easy item
Based on the table above, 7 items had difficult level of difficulty index, 30 items
had moderate level of difficulty index, and 2 items had easy level of difficulty index. In
sum, the most items on the instrument of this study were in the level of moderate. For
detail, the result of difficulty index test of instrument items could be seen in Appendix
C.
3.5.2.4 Discrimination Index
The discrimination index was used to measure the extent of which items that
differentiate the students who gained higher scores and those who gained lower scores.
To find out the discrimination index of the instrument in this study, Anates v.4 was used
interpretation by Arikunto (2009) was used in this study. The following table is the
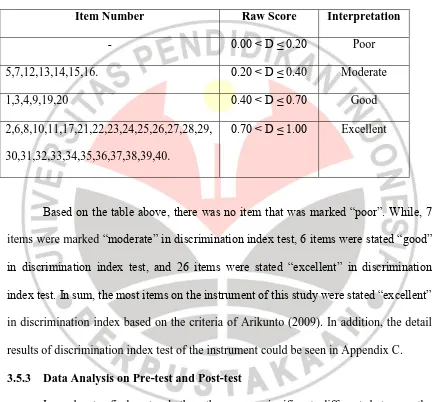
result of the discrimination index test:
Table 3.3
The Result of Discrimination Index Test
Item Number Raw Score Interpretation
- 0.00 < D ≤ 0.20 Poor
5,7,12,13,14,15,16. 0.20 < D ≤ 0.40 Moderate
1,3,4,9,19,20 0.40 < D ≤ 0.70 Good
2,6,8,10,11,17,21,22,23,24,25,26,27,28,29,
30,31,32,33,34,35,36,37,38,39,40.
0.70 < D ≤ 1.00 Excellent
Based on the table above, there was no item that was marked “poor”. While, 7
items were marked “moderate” in discrimination index test, 6 items were stated “good”
in discrimination index test, and 26 items were stated “excellent” in discrimination
index test. In sum, the most items on the instrument of this study were stated “excellent”
in discrimination index based on the criteria of Arikunto (2009). In addition, the detail
results of discrimination index test of the instrument could be seen in Appendix C.
3.5.3 Data Analysis on Pre-test and Post-test
In order to find out whether there was significant different between the
experimental and control group, the data of pre-test – post-test from both group had to
be analyzed. The analyzing processes in this study intended to use t-test formula.
However, before performing the t-test formula, the data was ensured to meet the
interval-ratio scale, the underlying distributions are bell-shaped (normally distributed), the
observations are independent, and the variance of the two groups must be homogenous
(Jackson, 2009: 234). In addition, the conditions required of using dependent t-test were
actually similar to the independent t-test, except the requirement that the observations
are independent. The assumption for dependent t-test was the observations were not
independent, but the observations were correlated or dependent (Jackson, 2009: 239).
3.5.3.1 Normality Distribution Test
In the aim to find out if the data were normally distributed, Kolmogrov -
Smirnov’s formula in SPSS v.17.0 was used. In addition, the hypotheses to test are as
follow:
Hypothesis in experimental group:
Ho = The scores of experimental group are normally distributed.
H1 = The scores of experimental group are not normally distributed.
Hypothesis in control group:
Ho = The scores of control group are normally distributed.
H1 = The scores of control group are not normally distributed.
The interpretation of the result were based on the level of significant 0,05. If the
result is higher than 0,05, then H0 is not rejected or in the other word that the data are
normally distributed. Whereas, if the result is lower than 0,05, H0 is rejected (Priyatno,
2010: 71).
The next step to meet the requirement of using t-test formula was to find out
whether the data were homogenous or not. Levene’s test in SPSS v.17.0 was used to
find it out. In addition, the hypothesis to test is as follow:
Ho = The scores of both experimental and control group are homogenous.
H1 = The scores of both experimental and control group are not homogenous.
The interpretation of the result to find out whether the data were homogenous or
not were based on the level of significant 0,05. If the result is higher than significant
level 0,05, then H0 is not rejected. Meanwhile, if the result is lower than 0,05, then H0 is
rejected or in the other word that the data are not homogenous (Priyatno, 2010: 76).
3.5.3.3 t-test Computation
This study was conducted some statistical process of t-test to analyze the data,
such as: independent t-test for pre-test, independent t-test for post-test, dependent t-test
for experimental group, and dependent t-test for control group. This t-test is a
parametric inferential statistical test of the null hypothesis (Jackson, 2009: 184). In
addition, null hypothesis or H0 is the hypothesis that predicting no difference exists
between the groups being compared (Jackson, 2009: 166).
3.5.3.3.1 Independent t-test Computation on Pre-test
Independent t-test was conducted to calculate the data from pre-test of both
experimental and control group. In detail, the independent t-test was used to compare
parametric statistical test that compares the means of two different samples of
participants (Jackson, 2009: 227). It was aimed to find out whether there was significant
different or not between both groups’ initial ability before the groups were given the
treatments.
In this study, the independent t-test was analyzed by using SPSS v.17.0. The
significance level used in independent t-test was 0,05 (two-tailed test of significance). In
addition, the hypothesis to test is as follow:
Ho = There is no significant different between the means of pre-test scores of both
experimental and control group.
Ha = There is significant different between the means of pre-test scores of both
experimental and control group.
The testing criterions are as follow:
Ho is not rejected if -tcrit ≤ -tobt or tcrit ≥ tobt
Ho is rejected if -tobt < -tcrit or tobt > tcrit
And
Ho is not rejected if significant > 0,05
Ho is rejected if significant < 0,05
(Priyatno, 2010: 36)
3.5.3.3.2 Independent t-test Computation on Post-test
The use of independent t-test in post-test was to compare means of post-test
was significant difference or not between both groups’ ability after the groups
experienced the treatments in their learning process.
As in the pre-test analysis, SPSS v.17.0 was also used this computation to
analyze the independent t-test. The significance level used was at 0,05 (two-tailed test
of significance). The hypothesis to test is as follow:
H0 = There is no significant different between the means of post-test scores of both
experimental and control group.
Ha = There is significant different between the means of post-test scores of both
experimental and control group.
The testing criterions are as follow:
Ho is not rejected if -tcrit≤ -tobt or tcrit≥ tobt
Ho is rejected if -tobt < -tcrit or tobt > tcrit
And
Ho is not rejected if significant > 0,05
Ho is rejected if significant < 0,05
(Priyatno, 2010: 36)
3.5.3.3.3 Dependent t-test
The dependent t-test was used to find out whether there was significance
different or not between pre-test and post-test. Dependent t-test is a parametric
statistical test that compares the means of two related (within or matched-participants)
3.5.3.3.3.1 Dependent t-test on the Experimental Group Score
The dependent t-test on the experimental group was used to find out whether
there was significance different or not between pre-test and post-test after the group had
experienced the treatment of the use of audio visual aids in this study.
The dependent t-test computation used SPSS v.17.0 in calculated the data. The
significance level used was at 0,05 (two-tailed test of significance). In addition, the
hypothesis to test is as follow:
Ho = There is no significant different between pre-test and post-test after treatment.
Ha = There is significant different between pre-test and post-test after treatment.
The testing criterions are as follow:
Ho is not rejected if -tcrit≤ -tobt or tcrit≥ tobt
Ho is rejected if -tobt < -tcrit or tobt > tcrit
And
Ho is not rejected if significant > 0,05
Ho is rejected if significant < 0,05
(Priyatno, 2010: 41)
The dependent t-test on the control group was used to find out whether there was
significance different or not between pre-test and post-test after the group had
experienced the treatment of the use of text alone in this study.
As in the experimental group, the dependent t-test computation on control group
was used SPSS v.17.0 too in calculated the data. The significance level used was at 0,05
(two-tailed test of significance). Moreover, the hypothesis to test is as follow:
Ho=There is no significant different between pre-test and post-test after treatment.
Ha =There is significant different between pre-test and post-test after treatment.
The testing criterions are as follow:
Ho is not rejected if -tcrit ≤ -tobt or tcrit ≥ tobt
Ho is rejected if -tobt < -tcrit or tobt > tcrit
And
Ho is not rejected if significant > 0,05
Ho is rejected if significant < 0,05
(Priyatno, 2010: 41)
3.5.3.4 Calculation of the Effect Size
In order to measure how well the treatment worked in this study, calculation of
the effect size was conducted to measure. Effect size has positive correlation to its
3.5.3.4.1 Calculation of the Effect Size on the Dependent t-test
The computation of effect size should be conducted for the dependent t-test
(Jackson, 2009: 238). Cohen’s d formula was used to calculate the effect size on
dependent t-test. The Cohen’s d formula for dependent t-test is as follow:
� = �
��
Where: � = The mean of the difference scores
�� = The standard deviation of the difference scores
(Jackson, 2009: 238)
In interpreting the result, the criteria of effect size by Cohen (1992) was adopted.
The criteria are as follow: a small effect size is one of at least 0,20, a medium effect size
is at least 0,50, and a large effect size is at least 0,80 (Cohen, 1992 cited in Jackson,
2009: 238).
3.5.4 Data Analysis on Questionnaire
In analyzing the students’ responses about the vocabulary learning and the use
of audio visual aids in their English learning process, the questionnaire was analyzed by
using this below percentage formula:
�
=
�
�
100%
Where: P = Percentage
fo = Frequency observed
(Riduwan, 2009)
In interpreting the result of percentage computation above, the classification
CHAPTER V
CONCLUSIONS AND SUGGESTIONS
This chapter provides conclusion drawn from the entire study as well as
suggestions for further study and related parties.
5.1 Conclusions
This study is conducted to figure out if the implementation of audio visual aids
in the teaching learning process can improve students’ vocabulary to descriptive texts.
Besides, it is also meant to investigate the students’ responses toward the vocabulary
learning and the implementation of the audio visual aids in the teaching learning
process. The findings of the present study showed that the use of audio visual aids
indicated can support vocabulary acquisition. Besides, it was also helps the students to
do better in their writing, especially in writing descriptive texts.
Furthermore, the findings of this study indicate some factors that influence the
result of the vocabulary teaching learning process, in this case the students’ vocabulary
mastery. Those include positive and negative factors. To be more specific, the positive
factors lead to the students’ vocabulary improvement. Differently, the negative ones can
resist the improvement. Those factors are categorized into media and teacher factors.
The findings of this study indicate that the audio visual aids implemented should
aids present vocabularies that are still new for the students. In contrast, when those aids
present most of vocabularies that the students’ already know, it could be less good
media. In this case, the media become inappropriate media for enhancing the students’
vocabulary mastery. Besides, the audio visual aids selected should facilitate the students
in comprehending the meaning of the required words. For instance, the image or picture
should be able to illustrate the meaning of those words. In addition, the spoken text or
words should be clear to hear and match with the level of the students.
The way the teacher delivers the vocabulary through audio visual aids should be
considered thoroughly. The appropriate media mentioned above could be useless if the
teacher could not organize and convey it well to the students. When the media is not
delivered well and not in attractive way, the students will difficult gain some
improvements on their vocabulary mastery and easily get bored during the teaching
learning process. They will tend to only act as a viewer or listener. However, the
findings of this study indicate that the teacher should competent in organizing and
delivering the audio visual materials to the students. The teacher’s preparation is the key
to be competent in organizing and delivering the audio visual materials. It indicates that
prepared teacher, could easily delivered the learning materials well to the students in the
teaching learning process.
Moreover, when both media and teacher well support each other, the outcome is
advanced improvement in the students’ vocabulary mastery. With the appropriate audio
visual aids prepared and delivered well by the teacher, it could be a good way to
improve the students’ performances in the class. Then their performances in the
needed to be fully concerned in the implementation of audio visual aids in order to
improve the students’ vocabulary mastery successfully.
5.2 Suggestions
For teachers interested in additional reading on the topic of improving students’
vocabulary mastery through the use of audio visual aids, this study provides some
suggestions that might be useful for them in implementing the audio visual aids. The
teachers are suggested to choose, develop, or may be create the audio visual materials
that are indicated could provide the comprehension of the vocabulary learning and
match with the students’ level and interest in order to motivate the students to actively
contribute in the teaching learning process.
In addition, to avoid the useless implementation of the audio visual aids in the
classroom, the teachers need to be more careful in choosing, developing, or creating the
audio visual aids. The teachers not only should consider about the students’ need and
level, but the teachers also should concern about the audio visual aids used to facilitate
the students’ comprehension of the words meaning. Besides, the teachers should have a
good preparation before he/she implements the audio visual aids in the classroom. It
could affect their performance in delivering those audio visual materials to the students.
Well collaboration of the good audio visual aids use and the good teachers’ performance
will make the teaching learning process more meaningful.
Furthermore, for anyone who is interested to conduct a study in the same field
with this study, may better find another effective ways to implement audio visual aids to
visual aids, the further study better to spread questionnaire for the students to find out
what the students are interested in before the media is selected, developed, or created. It
is intended to make the audio visual prepared match both the students’ need and
interests. Besides, they could investigate first the vocabulary mastery of the students,
which discover what words that the students’ already know. Then the vocabulary
chosen to be taught through audio visual aids can improve their existing ones. So, it
could be more convincing that those aids can be useful to be used in the language
References
Ajabshir, Zahra F (2011). The Effect of Verbal and Visual Techniques on Vocabulary Achievement of Iranian EFL Students. The Iranian EFL Journal, 7 (5). Retrieved January 19, 2013, from http://www.iranian-efl-journal.com/October-2011-zfa.php
Akbulut, Y. (2007). Effects of Multimedia Annotations on Incidental Vocabulary and Reading Comprehension of Advanced Learners of English as a Foreign Language.
Instructional Science, Vol. 35, pp. 499-517. From: http://dx.doi.org/10.1007/s11251-007-9016-7
Allen, J. P., & Corder, S. Pit. (1974). Techniques in Applied Linguistics. London and New York: Oxford University Press.
Aljumah, Fahad H. (2012). Saudi Learner Perceptions and Attitudes towards the Use of Blogs in Teaching English Writing Course for EFL Majors at Qassim University.
English Language Teaching, 5, (1). From: http://www.ccsenet.org/journal/index.php/elt/article/view/13881/9527
Alsamadani, H. A. (2010). The Relationship between Saudi EFL Students’ Writing Competence, L1 Writing Proficiency, and Self-regulation. European Journal of
Social Sciences, 16, (1).
Al-Seghayer, K. (2001). The Effect of Multimedia Annotation Modes on L2 Vocabulary Acquisition: A Comparative Study. Language Learning &
Technology, 5(1), 202-232. Retrieved February 15, 2013, from: http://llt.msu.edu/vol5num1/alseghayer/default.pdf.
Anglin, G. J. (1986). Prose-Relevant Pictures and Older Learners’ Recall of Written Prose. Educational Communication and Technology Journal, 34 (2), 131-139.
Anglin, J. M., Miller, G. A., & Wakefield, P. C. (1993). Vocabulary development: A morphological analysis. Monographs of the Society for Research in Child
Development, 58(10), 1-186.
Arikunto, Suharsimi (2003). Prosedur Penelitian: Suatu Pendekatan Praktek (Edisi Revisi V). Jakarta: PT. Rineka Cipta.
_______, Suharsimi (2009). Dasar-Dasar Evaluasi Pendidikan (Edisi Revisi). Jakarta: Bumi Aksara
Badan Standar Nasional Pendidikan – BSNP. Standar Kompetensi dan Kompetensi Dasar. 2006.
United States. Assessing writing, 16(3), 189-211. From: http://dx.doi.org/10.1016/j.asw.2011.03.001
Beins, Bernard C. and Maureen A. McCarthy (2012). Research Methods And Statistics. Pearson.
Brown, H. D. (2002). Principles of Language Learning and Teaching. Beijing: Foreign Language Teaching and Research Press.
Brown, K., & Hood, S. (2003). Writing Matters: Writing Skills and Strategies for Students of English. UK: Cambridge University Press.
Chanier, T. (1996). Learning a Second Language for Specific Purposes within a hypermedia Framework. Computer-Assisted Language Learning (CALL), 9(1),
3-7.
TESOL Journal, 5 (1), 59-79. from http://www.tesol-journal.com
Clouston, Michael L (2012). Technical vocabulary use in English-medium disciplinary writing: A native/non-native case study. The Linguistics Journal, 6 (1). Retrieved January 19, 2013, from http://www.linguistics-journal.com/2012.php
Coolidge, Federick L. (2000). Statistic “A Gentle Introduction”. London: Cromwell Press Ltd.
Dwyer, C.A. (1988). Examining The Symbiotic Relationship between Verbal and Visual Literacy in Terms of Facilitating Student Achievement. Reading
Psychology, 3 (9), 365-80.
Diamond, L. & Gutlohn, L. (2006). Teaching Vocabulary. Retrieved 15 February 2013 from http://www.readingrockets.org/article/9943.
Ellis, S. R. (1993). Pictorial Communication In Virtual And Real Environment. New York: Taylor and Francis.
Folse, K. (2004). Vocabulary Myths: Applying Second Language Research to Classroom Teaching. Ann Arbor: The University of Michigan Press.
Ghaedshafari, M., and Bagheri, M. S. (2011). Effect of AudioVisual, Audio, and Visual Presentations on EFL Learners’ Writing Skill. International Journal of English Linguistics, 2 (2). Retrieved July 15, 2012, from Learning Outcomes. Language Learning, 46, 643-79. From: http://dx.doi.org/10.1111/j.1467-1770.1996.tb01355.x
Hall, K. M., and Sabey, B. L. (2007). Focus on the Facts: Using Informational Texts Effectively in Early Elementary Classrooms. From: http://link.springer.com/article/10.1007%2Fs10643-007-0187-2
Hammond, J (1992). English for Social Purposes: a Handbook for Teacher of Adult Literacy. Sydney: National Center for English Language Teaching and Research.
Herbertson, M. (2010). Lexis and Grammar. From:
http://www.philseflsupport.com/grammarnlexis.htm
Hu, H. P., and Deng, L. J. (2007). Vocabulary Acquisition in Multimedia Environment.
US-China Foreign Language, 5 (8), 55-59.
Huckin, T., & Coady, J. (1999). Incidental Vocabulary Acquisition In A Second Language: A Review. Studies in Second Language Acquisition, 21, 181-193.
Ibnian, S. S. K. (2010). The Effect of Using the Story- Mapping Technique on Multimedia Instruction for Vocabulary Learning. Educational Technology &
Society, 11 (3), 114-126.
Lewis, Michael (2000). Teaching Collocation - Further Developments in the Lexical Approach. Thomson Heinle Language Teaching Publications ELT.
Lotto, L., & de Groot, A. M. B. (1998). Effects of Learning Method and Word Type on Acquiring Vocabulary in an Unfamiliar Language. Language Learning, 48, 31–
69.
Luo, J., Jian, X., and Wang, Y. (2004). Research on Relationships Among Learning Motivation, Foreign Language Learning Strategies and Academic Achievement.
Research in Teaching, 27, 149-151.
Manser, Martin H (1995). Oxford Learner’s Pocket Dictionary. Oxford University Press.
Miller, G. A. (1991). The science of words. New York: Scientific American Library.
Miranda, N. (2003). Non-native English Speaking Teachers' Continuous Improvement: A Double Challenge. NNEST NEWSLETTER, 5, (1). From:
Nation, I.S.P. (2005) Teaching and learning vocabulary. In E. Hinkel (ed.) Handbook of
Research in Second Language Teaching and Learning Mahwah, N.J.: Lawrence Erlbaum: 581-595.
Nilforoushan, Somayeh (2012). The Effect of Teaching Vocabulary through Semantic Mapping on EFL Learners’ Awareness of the Affective Dimensions of Deep Vocabulary Knowledge. English Language Teaching, 5 (10). Retrieved
September 29, 2012, from Vocabulary in Texts Written by Norwegian Learners of English. System, 27,
191-205. From: http://dx.doi.org/10.1016/S0346-251X(99)00016-0
Oxford, R., & Crookall, D. (1990).Vocabulary Learning: A Critical Analysis Of Techniques. TESOL Canada Journal,7 (2), 9-30. from http://www.tesol-journal.com
Paivio, A.(1991). Dual Coding Theory .Retrospect And Current Status. Canadian
Journal of Psychology, 45(3), 255-87.
Pan, Y., & Pan, Y. (2009). The Effect Of Pictures On The Reading Comprehension Of Low-Proficiency Taiwanese English Foreign Language College Students: An Action Research Study. VUN Journal of Science, Foreign Language, 25, 186-198.
Pittman, W. (2003). Building Vocabulary Through Prefixes, Roots and Suffixes. The
Internet TESL Journal, 9, (7). Retrieved from: http://iteslj.org/Techniques/Pittman-BuildingVocabulary.html
Priyatno, Duwi (2010). Paham Analisa Statistik Data Dengan SPSS. Yogyakarta: Mediakom.
Rahmawati, D. (2010). The Use of Task-Based Language Teaching in Improving Students’ Speaking Ability (Skripsi, Universitas Pendidikan Indonesia, 2010).
Retrieved July 14, 2012, from
http://repository.upi.edu/skripsiview.php?no_skripsi=2943
Rezaee, Abbas Ali (2011). Investigating the Effect of Using Multiple Sensory Modes of Glossing Vocabulary Items in a Reading Text with Multimedia Annotations.
English Language Teaching, 4 (2). Retrieved September 29, 2012, from
http://www.ccsenet.org/journal/index.php/elt/article/view/10759
Richards, J. C., & T. S. Rodgers. (1986). Approaches And Methods In Language
Teaching: A Description And Analysis. New York: Cambridge University Press.
Richards, J. C., & Renandya, W. A. (2002). Methodology in Language Teaching.
Cambridge: Cambridge University Press. From:
http://dx.doi.org/10.1017/CBO9780511667190
Riduwan, (2009). Skala Pengukuran Variable-Variable Penelitian. Bandung: Alfabeta.
Shoebottom, P. (2007). How to Learn a Vocabulary. Retrieved 15 February 2013 from: http://esl.fis.edu/learners/advice/vocab.htm
Sigueza, T. (2005). Graphic Organizers. Retrieved from http://www.colorincolorado.org/article/13354/pdfs/articles/gfxorg_concdef.pdf/
Sugiyono (2010). Metode Penelitian Kuantitatif Kualitatif Dan R&D. Bandung: Alfabeta.
Underwood, J. (1989). Hyper Card and Interactive Video. CALICO Journal. 6(3), 7-20.
Walter, Elizabeth (2008). Cambridge Advanced Learner's Dictionary: third edition. Cambridge University Press.
Waring, R. and Nation, I.S.P. (2004). Second Language Reading and Incidental Vocabulary Learning. Angles on the English Speaking World 4: 97-110.
Warschauer, M. (2010). Invited Commentary: New Tools For Teaching Writing.
Xu, Jianping (2009). An Experimental Study on the Effects of Different Reading Tasks on L2 Vocabulary Acquisition. English Language Teaching, 2 (3). Retrieved
September 29, 2012, from
http://www.ccsenet.org/journal/index.php/elt/article/view/3698
Zarei, G.R.,& Khazaie, S. (2011). L2 Vocabulary Learning Through Multimodal Representations. Procedia Social and Behavioral Sciences, 15, 369-375.
Zheng, Sigao (2012). Studies and Suggestions on English Vocabulary Teaching and Learning. English Language Teaching, 5 (5). Retrieved July 15, 2012, from http://www.ccsenet.org/journal/index.php/elt/article/view/16664
Zhu, Z. (2010). Applying Innovative Spirit to Multimedia Foreign Language Teaching.
English Language Teaching, 3 (3). Retrieved September 29, 2012, from
http://www.ccsenet.org/journal/index.php/elt/article/view/7216