Omega: Jurnal Fisika dan Pendidikan Fisika3(1), 15 - 22 (2017)
Grain Size Analysis on Pure and Zn-doped Ilmenite Magnesium Titanane
Powders
Frida U. Ermawati
1,∗, S. Suasmoro
2, Suminar Pratapa
21Department of Physics, Universitas Negeri Surabaya
Kampus Ketintang, Surabaya 60231
2Department of Physics, Institut Teknologi Sepuluh Nopember
Kampus Sukolilo, Surabaya 60111
Abstract
Ilmenite structured of magnesium titanate (MgTiO3)-based ceramic has been the favorite candidate for
mi-crowave frequency applications, such as in mobile and satellite communication systems, dielectric resonantor, antenna, radar and global positioning system (GPS) due to the excellent dielectric performance,i.e. a moderate permittivity (εr∼17.6) together with a high quality factor (Q×f) of∼33,768 GHz at 10 GHz and a near zero
temperature coefficient of the resonance frequency (τf ∼ −48 ppm/◦C) (Wang, et al. 2012). Many efforts have
been made to fabricate MgTiO3-based ceramics with improved performance, including preparation of
nanostruc-tured MgTiO3powder as the ceramic precursor. Having powder with nanoscale grain size is very advantageous in
the ceramic fabrication because the total surface area of contact between nanoscale grains are much larger than the similar total surface area of contact between microscale grains, and the presence of the larger surface energy in the nanopowder turns out to be a driving force of sintering; in this case, to reduce the free energy of the system during the sintering process. Sintering process is a process of firing of compact powder to produce ceramic with controlled microstructure, reduced porosity and enhanced properties. This paper reported the work to analyze the grain sizes in a series of Mg1 –xZnxTiO3forx= 0−0.5 (MZT0 - MZT0.5) powders prepared from Mg, Zn and
Ti metals powders and hydrochloric acid (Merck c) using a facile wet mixing method. The Zn-doped samples were calcined at 550 ◦C, while that of the zinc free sample was at 700 ◦C. Bright field-transmission electron microscope (BF-TEM),MAUD-based x-ray diffraction (XRD) and particle size analyzer (PSA) analysis methods were occupied to measure the average grain sizes of the calcined powders, as well as the particle size distribution, and the results were compared. Discussion on the phase formation and thermal events during thermal treatment of the system was also provided.
c
2017 The Authors. Published by Pendidikan Fisika UHAMKA
Keywords: Magnesium titanate, ceramic, average grain size, TEM,MAUD-based XRD, PSA
∗Corresponding author. E-mail address: [email protected]
Introduction
Investigation on dielectric materials for mi-crowave frequency applications has been initiated since almost three decades ago and research devel-opment on these applications has been increasing with rapid progress in mobile and satellite com-munication systems [1-6]. The efforts to miniatur-ize the microwave circuits have further boosted up the growth of wireless communication industry [7].
There are three important aspects for using a di-electric ceramic in microwave frequencies, namely a high relative permittivity (εr) in order to re-duce the size of the components, a high quality factor (Q×f) to increase the frequency selectiv-ity, and good temperature stability (τf) to ensure high temperature stability [8]. Ilmenite magnesium titanate (MgTiO3) ceramic with a moderate
factor (Q×f) of∼33,768 GHz at 10 GHz and a near zero temperature coefficient of the resonance frequency (τf ∼ −48 ppm/◦C) [9] meets the above requirement and therefore MgTiO3 has been one
of the favorite candidates for microwave frequency applications. Many efforts have been carried out to fabricate MgTiO3-based ceramics with improved
performance, including varying powder preparation technique [10-12], improving sintering behavior by introducing a liquid phase agent as a sintering aid [13], controlling microstructure [14], developing new dielectric ceramic by combining two or more com-positions with τf characteristic compensation, i.e. to adjust the τf value approaches to zero [15]. A study to investigate the dielectric performance of a series of developed MgTiO3-based ceramic as a
function of frequency (from 1 Hz to 7.7 GHz) has been carried out by the authors [16].
Powder with nanoscale grain size is very benefi-cial in the ceramic fabrication because the total sur-face area of contact between grains with nanoscale are much larger than the similar total surface area of contact between grains with microscale. The pres-ence of the larger surface energy in the nanopow-der turns out to be a driving force of sintering; in this case, to reduce the free energy of the system during the sintering process. Sintering process is a densification process of compact powder by firing the powder to produce ceramic with controlled mi-crostructure, reduced porosity and enhanced prop-erties, such as strength, electrical and thermal con-ductivities. The driving force for densification is the change in free energy from the decrease in sur-face area and lowering of the sursur-face free energy by the replacement of solid-vapor interfaces [17]. This process forms new but lower-energy solid-solid in-terfaces with a total decrease in free energy occur-ring. On a microscopic scale, material transfer is affected by the change in pressure and differences in free energy across the curved surface. If the size of the particle (i.e. a group of grains) is very small and its curvature is high, these effects become very large in magnitude. The change in energy is much higher when the radius of curvature is less than a few micrometres, which is one of the main reasons why many ceramic technologies are based on the use of fine-particle materials.
This paper reported the analysis on the av-erage grain sizes of a series of nanostructured Mg1 –xZnxTiO3 powders forx= 0−0.5 both
mea-sured from bright field-transmission electron mi-croscope (BF-TEM) and x-ray diffraction (XRD) study. By means of XRD study is analyzing the XRD powder spectra quantitatively using the Ri-etveld method implemented in MAUD program. XRD-based analysis is also aimed to extract the phase composition data of the samples. This par-ticular analysis was completed using the Rietveld
method implemented in Rietica program. Further, analysis on the particle size distribution was carried out using particle size analyzer (PSA). Such data adds the information on how many grains reside, in average, in each particle in the systems. Further-more, analysis on the phase formation and thermal events during thermal treatment of the powders was also presented in this paper.
Experiment
The compositions of Mg1 –xZnxTiO3dried
pow-ders forx= 0−0.5 (MZT0 - MZT0.5) were synthe-sized from Mg, Ti and Zn metal powders (Merck c) as starting materials and hydrochloric acid as a sol-vent using a facile dissolved metals mixing method [11]. The use of this method, metal powders as starting materials and hydrochloric acid as the sol-vent are the best combination to produce high pu-rity MgTiO3 crystalline phase at quite low
tem-perature without accompanied by undesired, inter-mediate phase of Mg2TiO4 (qandilite) or Mg2TiO5
(karrooite). By dissolving Mg, Ti and Zn metals powders in strong hydrochloric acid, intimate mix-ing between Mg2+
, Zn2+
, Ti4+
and Cl–
ions occurs immediately to form MgCl2, ZnCl2 and TiCl4
liq-uid solutions accompanied by H2gas. In this work,
to ensure the stoichiometry of the dried powder, purity of the starting materials were previously ex-amined by x-ray fluorescence (XRF) spectrometer. Each metal powder was weighed according to the molar ratio Mg: Zn: Ti = (1−x): (x): 1 before be-ing dissolved separately in hydrochloric acid usbe-ing a magnetic stirring hotplate. Mg and Zn powders were dissolved at room temperature, each to ob-tain clear yellowish MgCl2 liquid and ZnCl2liquid,
while Ti powder was dissolved at 60−70◦C to obtain
clear purplish TiCl4 liquid. All the MgCl2, ZnCl2
and TiCl4 liquids were homogeneously mixed and
the resulting liquid solution was subsequently evap-orated to obtain agglomerated dried powder precur-sor. Agglomeration was crushed manually to obtain fine grain size powder. The fine grain size pow-der precursors obtained from Mg1 –xZnxTiO3 with
x = 0.1−0.5 were then calcined at 550 ◦C for 2
h at the heating rate of 10 ◦C/min using a
Carbo-lite RHF-1400 furnace. The zinc-free dried powder (x= 0), however, was calcined at 700◦C for 2 h
be-cause in this particular composition, the formation of MgTiO3 phase at 550◦C was still premature.
Crystalline phases in the calcined powders were identified by x-ray diffraction (XRD) using an XPert Diffractometer (Philips) with CuKα radia-tion. The XRD measurement was carried out from 2θ = 15 to 65◦ and the step size is 0.02◦.
type Tecnai G2 20 S-TWIN with the accelerating voltage of 200 kV and the camera length of 15 cm; and the average grain sizes were directly mea-sured from the BF-TEM data. The TEM specimen was prepared by dispersing the powder in ethanol using an ultrasonic bath. The similar grain sizes were also estimated based on the XRD study using
MAUD program [19] implemented in the Rietveld method. Particle size distribution in the samples was measured using particle size analyzer (PSA) Ze-tasizer Nano Series Software Version 7.01 (Malvern InstrumentR
). The PSA specimen was prepared by dispersing about 0.5 gram of the calcined pow-der in aquadest using ultrasonic bath. About 2-3 drops of a dispersant liquid was also added to break up the agglomerated particles.
Results and Discussion
Phase Formation and Thermal Events during Thermal Treatment
XRD spectra of MZT0.1 - MZT0.5 powders af-ter being calcined at 550 ◦C and of MZT0 powder
after being calcined at 700◦C both are provided in
Fig. 1. In addition, Fig. 1 also shows the evolu-tion of crystalline phases detected in MZT0.1
pow-der at room temperature (RT) and after being cal-cined subsequently at 300, 400, 450 and 500 ◦C.
As shown, at RT, the MZT0.1 powder precursor contains peaks from MgCl2·6 H2O (PDF No.
25-0515), ZnCl2 (PDF No. 15-0452) at 2θ = 18.5◦
and TiO2(PDF No. 21-1276) phases. Study of the
phase formation and thermal events in the MZT0.1 system carried out via thermo gravimetric and dif-ferential thermal analyses (TGA/DTA), which are not shown here, explains that from RT to 300 ◦C,
4 mol H2O gas was released as a result of
dehy-dration of about 0.9 mol MgCl2·6 H2O. From 300
to 400 ◦C, a transition of Mg
0.9Zn0.1Cl2·H2O to
Mg0.9Zn0.1(OH)Cl was predicted to occur following
the mass loss within that temperature range. The presence of a significant endothermic peak at 400
◦C suggested that the formation of Mg0.9Zn0.1TiO3
crystalline phase was initiated at that temperature, and the mass loss within the range of 400−500
◦C was addressed to the emission of 1 mol HCl
gas from Mg0.9Zn0.1(OH)Cl. The later phase was
then reacted with TiO2to produce Mg0.9Zn0.1TiO3
phase. This phase can be indexed as MgTiO3
with PDF No. 06-0494 (see the spectrum labeled ’MZT0.1 500’, i.e. the peaks with hkl indices in Fig.1).
Fig. 1: XRD spectra of MZT0.1 - MZT0.5 powders after being calcined at 550◦C and of MZT0 calcined at 700 ◦C, each for 2 h. Evolution of the crystalline phases detected in MZT0.1 powder both at room temperature
(RT), and after being calcined at 300, 400, 450, and 500◦C are also shown. The indexed peaks = MgTiO
3, a =
MgCl2·6 H2O, b = ZnCl2 and c = TiO2.
In addition, as also seen in the spectrum labeled ’MZT0.1 RT’ in Fig. 1, the ZnCl2 peak at 2θ
= 18.5◦(labeled ’b’) totally disappeared when the
powder was heated. This fact suggested that Zn-ion substitution into the MgCl2·6 H2O structure, i.e.
(Mg1 –xZnx)Cl2·6 H2O, was started after heating.
This (Mg1 –xZnx)Cl2·6 H2O substitution is
feasi-ble due to the ionic radius similarity found in Mg and Zn-ions, i.e. 0.074 nm for Zn and 0.072 nm
for Mg, respectively. This substitution is an early indication on the formation of solid solution phase in MZT0.1 system. The formation of such solid solution phase is also confirmed by the absence of peaks containing zinc in all spectra in Fig. 1, i.e.
in the ’MZT0.1 550’, ’MZT0.2 550’, ’MZT0.3 550’, ’MZT0.4 550’ and ’MZT0.5 550’ spectra. Despite the fact that the desired Mg0.9Zn0.1TiO3phase has
cal-cination of MZT0.1 - MZT0.5 powders was carried out at 550◦C for 2 h because, as has been reported
in [11], calcination at 550 ◦C yielded the most
op-timum molar fraction of the desired phase. For the zinc-free sample (MZT0), however, calcination was carried out at 700 ◦C for 2 h and this calcination
temperature also provides the main MgTiO3phase,
but the presence is accompanied by a minor TiO2
peak at 2θ = 27.5◦ and an MgO (PDF No.
45-0946) peak at 2θ= 42.5◦ (see the spectrum labeled
’MZT0 700’ in Fig. 1).
Phase Composition Analysis using Rietveld-based Rietica
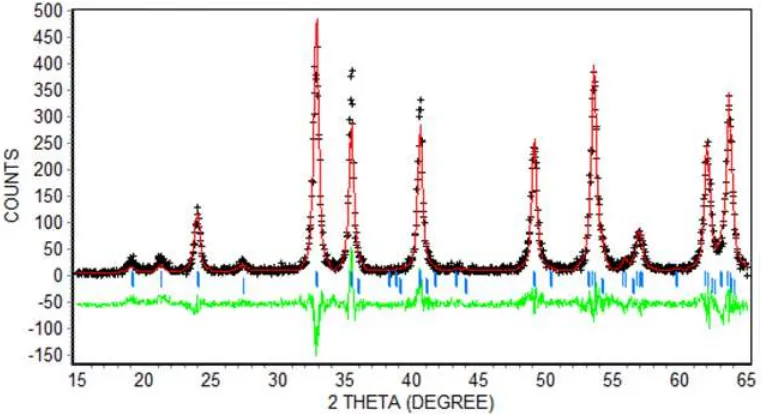
Figure 2 provides the Rietveld refinement on the spectral model (generated from MgTiO3 phase
(PDF No. 06-0494) and TiO2phase (PDF No.
21-1276) in the Rietica program) with respect to the ’MZT0.2 550’ spectrum in Fig. 1. The refinement result on the ’MZT0.2 550’ spectrum is shown here as a representative of the similar refinements per-formed to the other spectra, i.e. the ’MZT0 700’, ’MZT0.1 550’, ’MZT0.3 550’, ’MZT0.4 550’ and
’MZT0.5 550’ spectra. The label ’+’ in Fig. 2 in-dicates the experimental spectrum, the red line as-signs the spectral model, the green line shows the difference between the model and the experimental spectra, while the blue vertical lines underneath the spectra represent the position of Bragg peaks for the two identified phases, MgTiO3 and TiO2. As
observed, all the Bragg peaks coincide with the ex-perimental peaks indicating that all peaks/phases were well identified. In other words, other than the two identified Mg0.8Zn0.2TiO3and TiO2phases,
there is no extra phase coexists in the ’MZT0.2 550’ samples. As also seen, the difference between the experimental and the model spectra especially at 2θ= 32.9 and 35.5◦are significant. This difference,
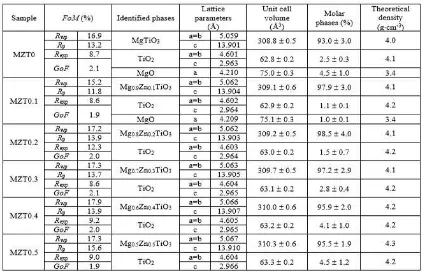
however, does not significantly alter the refinement result. Table 1 recapitulates the output of the re-finement carried out for all the samples, covering the identified phases, the lattice parameters, the unit cell volumes, the molar phase percentage and the theoretical density data. Figure-of-merit (FoM) values of the refinements are also shown. The val-ues are acceptable and therefore the data in Table 1 can be used for further analysis.
Fig. 2: The Rietveld refinement on the spectral model (red line) with respect to the experimental XRD spectrum (’+’) of MZT0.2 powder calcined at 550◦C in Fig. 1 usingRieticaprogram. Figure-of-Merit (FoM) of
the refinement isRwp = 17.2;Rp = 13.9;Rexp= 12.3 danGoF = 2.0.
As seen in Table 1, MgTiO3 phase and its solid
solution phase (Mg1 –xZnxTiO3) are identified as
the main phase in all samples. These are assigned by the presence of the main phase in very significant molar percentage, namely (93.0±3.0) % in MZT0, (97.9±3.0) % in MZT0.1, (98.5±4.0) % in MZT0.2, (97.2±2.9) % in MZT0.3, (95.9±2.0) % in MZT0.4 and (95.5±1.9) % in MZT0.5, respectively. The remaining molar percentages belong to the minor phases,i.e. TiO2 and MgO in MZT0 and MZT0.1
samples and TiO2in MZT0.2 - MZT0.5 samples. In
(309.1±0.6) in MZT0.1, (309.2±0.5) in MZT0.2, (309.7±0.5) in MZT0.3, (310.0±0.6) in MZT0.4 and (310.3±0.6) in MZT0.5. These increases confirm the analysis given previously in Sub Section 3.1 that the main phases in MZT0.1 - MZT0.5 samples are indeed the Mg1 –xZnxTiO3solid solution phases. In other words, the zinc ions and its content (i.e. the
x-values in Mg1 –xZnxTiO3) have positioned them-selves in the MgTiO3 structure. The theoretical
density data in Table 1 also increases slightly; these data were calculated byRieticabased on the lattice parameters and chemical composition of particular sample.
Table 1: The Rietveld refinement output usingRieticafor MZT0 700 and (MZT0.1 - MZT0.5) 550 spectra in Fig. 1
Average Grain Size and Particle Size Distri-bution Analyses
Figure 3A shows a bright field TEM image of the MZT0.2 calcined powder and the grains mor-phology. In this work, BF-TEM image was only taken from MZT0.2 sample. One of the reasons is because the width of the main peak (at 2θ= 32.9◦)
in ’MZT0.2 550’ spectrum in Fig. 1 is similar to the width of the main peaks at the same 2θposition in the other samples which indicates that the grain sizes in those samples are presumably also similar. As observed in Fig. 3A, morphology of the individ-ual grains is circular or elongated in one direction; most of the grains, however, are agglomerated. Di-ameter of the individual grains varies from 20−80 nm. As a comparison, Fig. 3B provides an estimate on the grain size distribution in MZT0.1 - MZT0.5 powders (calcined at 550 ◦C) and in MZT0
(cal-cined at 700◦C) obtained from the XRD study,i.e.
from the output of the Rietveld refinement using
MAUD program on the MZT0 - MZT0.5 spectra in Fig. 1. As seen, peak of the grain size distri-bution curve in MZT0.2 is located at 17 nm. The curve subsequently drops significantly up to 75 nm.
The area under the curve estimates the range of the majority grain sizes in the sample; in the MZT0.2 case, the estimate is quite relevant to the TEM data in Fig. 3A (i.e. the individual grain size is up to 80 nm). The grain size distribution curves found in MZT0.1, MZT0.3, MZT0.4 and MZT0.5 pow-ders in Fig. 3B are similar to the distribution curve in MZT0.2, suggesting that the range of the ma-jority grain sizes, hence the average grain size, in the former mentioned powders are also similar to the average grain size in later mentioned (MZT0.2) powder.
The grain size distribution curve in MZT0 pow-der (also in Fig. 3B), however, is the widest among the other distribution curves. Peak of the MZT0 curve is located at 120 nm. This particular dis-tribution curve is plausible since MZT0 powder was calcined at higher temperature (700 ◦C); this
higher calcination temperature leads to growing of the grain size in the system. Referring back to the ’MZT0 700’ spectrum in Fig. 1, it is clear that the width of the main peak at 2θ = 32.9◦ is smaller
grain size in the system is also smaller. The fact that the average grain sizes in the powders contain-ing zinc are smaller than the average grain size in the zinc-free powder confirms that zinc substitution in the MgTiO3 structure has lowered the
temper-ature of formation of the main MgTiO3 phase in
the systems; this in turns results in nanoscale grain size. As verification, Fig. 4 shows the Rietveld
refinement using MAUD, especially for the case of MZT0.2 spectrum. The symbols used in this partic-ular refinement (using MAUD) have similar mean-ings as the symbols used in the refinement using
Rietica in Fig. 2. As seen in Fig. 4, all the Bragg peaks (the small vertical bars underneath the spec-tra) also coincide with the experimental peaks sug-gesting that all peaks/phases were well identified.
Fig. 3: A) Bright field TEM image of MZT0.2 powder after being calcined at 550◦C for 2 h. B)MAUD-based XRD grain sizes of MZT0.1 - MZT0.5 powders after being calcined at 550◦C for 2 h and of MZT0 powder
calcined at 700◦C for 2 h.
Fig. 4: The Rietveld refinement on ’MZT0.2 550’ spectrum in Fig. 1 usingMAUD.FoM: sig= 1.5 % andRw=
13.7 %.
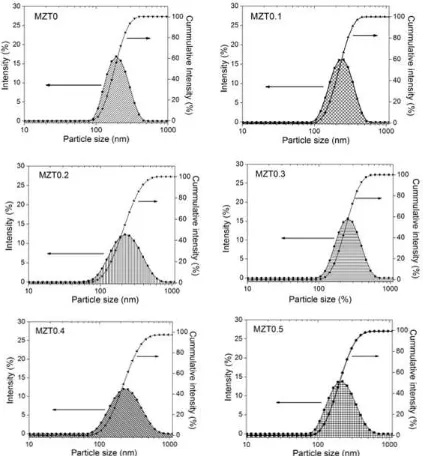
The distribution curves of particle size in MZT0 - MZT0.5 calcined powders measured using PSA are provided in Fig. 5. As observed, all distri-butions are a log-normal single-mode ranging from (91−459) nm in MZT0, (106−531) nm in MZT0.1, (59−712) nm in MZT0.2, (106−615) nm in MZT0.3, (79−700) in MZT0.4 and (91−530) nm in MZT0.5. The average particle size is (189 nm ± 1 %) in
MZT0, (257 nm ± 3 %) in MZT0.1, (203 nm ±
both obtained from TEM in Fig. 3A andMAUD -based XRD in Fig. 3B, as well as the distribution particle size data in Fig. 5, it can be concluded that each particle in MZT0 powder contains
approx-imately 2 grains, in MZT0.1 contains 10 grains, in MZT0.2 contains 12 grains, in MZT0.3 contains 8 grains, in MZT0.4 contains 20 grains and finally in MZT0.5 contains 38 grains.
Fig. 5: Particle size distribution in MZT0 - MZT0.5 calcined powders measured using particle size analyzer (PSA) Zetasizer Nano Series Software Version 7.01 (Malvern InstrumentR).
Conclusion
Study on the average grain size and particle size distribution in the series of ilmenite structured Mg1 –xZnxTiO3 calcined powders for x = 0−0.5 have been carried out. The powders have nanoscale grain sizes and uniformly distribution of the parti-cle sizes; these all are due to the facile wet mixing synthesis method. The grain sizes estimate made in
MAUD-based XRD analysis are in good agreement with the data measured directly from bright field-transmission electron microscope (TEM). Data on
the particle size distribution measured using PSA supplied the important information on the num-ber of grains per particle. This work, therefore, has shown the comparability between TEM and
References
[1] G. Pfaff, Ceram. Int. 20(2), 111-116 (1994). [2] B.A. Wechsler and R.B. von Dreele, Acta Crystallographica. Sec. B, Struc. Sci. 45
(6), 542-549 (1989).
[3] V.M. Ferreira and J.L. Baptisa, Mater. Res. Bull. 29(10), 1017-1023 (1994).
[4] V. Parvanova and M. Maneva, Thermochim. Acta279, 137-141 (1996).
[5] J.F. Liao and M. Senna, Mater. Res. Bull.
30, 385-392 (1995).
[6] I.R. Abothu, A.V. Prasada Rao, and S. Ko-marneni, Mater. Lett. 38(3), 186-189 (1999). [7] J.J. Bian, L. Wang, and L.L. Yuan, Mater.
Sci. Eng. B164(2), 96-100 (2009).
[8] C.L. Huang, J.J. Wang, and Y.P. Chang, J. Am. Ceram. Soc. 90(3), 858-862 (2007). [9] H. Wang et al., J. Mater. Sci. Technol. 28
(8), 751-755 (2012).
[10] B. Tang et al., J. Mater. Sci. Mater. El. 25
(6), 2482-2486 (2014).
[11] F.U. Ermawati, S. Suasmoro, and S. Pratapa, Adv. Mater. Res. 1112, 47-52 (2015). [12] X. Xue, H. Yu, and G. Xu, J. Mater. Sci.
Mater. El. 24(4), 1287-1291 (2013).
[13] H.T. Wu et al., J. Electron. Mater. 42 (3), 445-451 (2013).
[14] S.R. Kiranet al., J. Am. Ceram. Soc. 95(6), 1973-1979 (2012).
[15] C.L. Pan et al., J. Alloy. Compd. 503 (2), 365-369 (2010).
[16] F.U. Ermawati et al., J. Mater. Sci. Mater. El. 27(7), 6637-6645 (2016).
[17] M.N. Rahaman,Ceramic Processing and Sin-tering, 2nd Ed. (CRC Press, Taylor & Francis Group, New York, 2003).
[18] B. Hunter, Rietica - A Visual Rietveld Pro-gram, WWW Document, (http://www.mx. iucr.org/iucr-top/comm/cpd/Newsletters/ no20summer1998/art15/art15.htm).