DROUGHT FORECASTING BASED ON MACHINE LEARNING OF REMOTE SENSING
AND LONG-RANGE FORECAST DATA
J. Rhee a, *, J. Im b, S. Park c a
APEC Climate Centre, Climate Research Department, 12 Centum 7-ro, Haeundae-gu, Busan, 48058, Republic of Korea – [email protected]
b
School of Urban and Environmental Engineering, Ulsan National Institute of Science and Technology (UNIST), 50 UNIST-gil, Ulsan, 44919, Republic of Korea - [email protected]
c
School of Urban and Environmental Engineering, Ulsan National Institute of Science and Technology (UNIST), 50 UNIST-gil, Ulsan, 44919, Republic of Korea - [email protected]
Commission VIII, WG VIII/1
KEY WORDS: Drought, Forecasting, Machine learning, Long-range forecast, Remote sensing data
ABSTRACT:
The reduction of drought impacts may be achieved through sustainable drought management and proactive measures against drought disaster. Accurate and timely provision of drought information is essential. In this study, drought forecasting models to provide high-resolution drought information based on drought indicators for ungauged areas were developed. The developed models predict drought indices of the 6-month Standardized Precipitation Index (SPI6) and the 6-month Standardized Precipitation Evapotranspiration Index (SPEI6). An interpolation method based on multiquadric spline interpolation method as well as three machine learning models were tested. Three machine learning models of Decision Tree, Random Forest, and Extremely Randomized Trees were tested to enhance the provision of drought initial conditions based on remote sensing data, since initial conditions is one of the most important factors for drought forecasting. Machine learning-based methods performed better than interpolation methods for both classification and regression, and the methods using climatology data outperformed the methods using long-range forecast. The model based on climatological data and the machine learning method outperformed overall.
* Corresponding author
1. INTRODUCTION
1.1 Drought forecast models
The reduction of drought impacts may be achieved through sustainable drought management and proactive measures against drought disaster. Accurate and timely provision of drought information is essential. In this study, drought forecasting models to provide high-resolution drought information based on drought indicators for ungauged areas were developed.
1.2 Study area and data
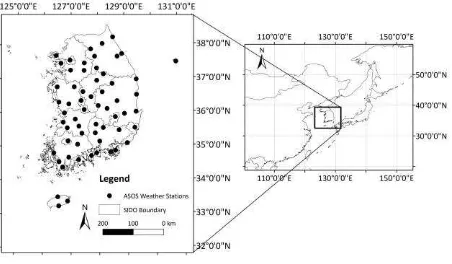
South Korea, located in the northeast Asia, was selected as the study area (Figure 1).
The developed models predict drought indices of the 6-month Standardized Precipitation Index (SPI6; McKee et al., 1993) and the 6-month Standardized Precipitation Evapotranspiration Index (SPEI6; Vicente-Serrano e al, 2010). Drought index values calculated using Automatic synoptic observation system (ASOS) data were used as reference data. Remote sensing data including precipitation (PRCP), daytime land surface temperature (LST_DAY), nighttime land surface temperature (LST_NIGHT), the Normalized Difference Vegetation Index (NDVI), and the Normalized Difference Water Index) were used. Long-range forecast data of monthly precipitation and
2-m air te2-mperature were obtained fro2-m six GCMs of MSC_CanCM3, MSC_CanCM4, NASA, NCEP CFSv2, PNU, and POAMA, and combined with observation data or remote sensing data.
Figure 1. Study area: South Korea was used
2. DROUGHT FORECASTING
An interpolation method based on multiquadric spline interpolation method (radial-basis function) as well as three machine learning models were tested. Three machine learning models (Breiman, 2001) of Decision Tree, Random Forest, and Extremely Randomized Trees were tested to enhance the provision of drought initial conditions based on remote sensing The International Archives of the Photogrammetry, Remote Sensing and Spatial Information Sciences, Volume XLI-B8, 2016
XXIII ISPRS Congress, 12–19 July 2016, Prague, Czech Republic
This contribution has been peer-reviewed.
data, since initial conditions is one of the most important factors for drought forecasting and provide valuable information on drought conditions for ungauged areas.
Classification of drought categories and regression of the values of drought indicators were performed. Input variables include the 6-month accumulated precipitation, 6-month accumulated potential evapotranspiration, NDVI, NDWI, LST_DAY, LST_NIGHT, Multivariate ENSO Index, Arctic Oscillation Index, and month. Performance measures used are the producer’s classification accuracy of drought categories of Extreme Drought, Severe Drought, and Moderate Drought for classification, and the Mean Absolute Error for regression. They were evaluated for the locations of 61 of Automated Synoptic Observing System gauges in South Korea.
3. RESULTS AND DISCUSSION
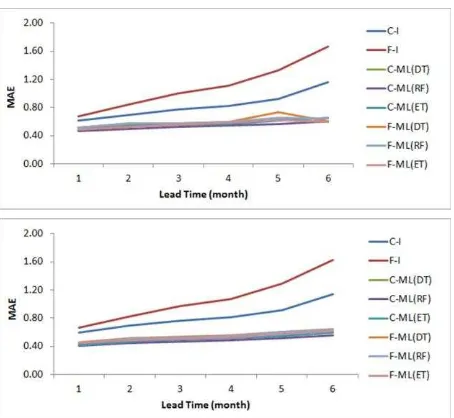
The performance of long-range forecast is out of the scope of this study, although it is the most important factor for the performance of drought forecasting. Instead, the performance of long-range forecast data was evaluated against the use of climatological data (baseline), for filling the future period of the lead time. The Climatology-Interpolation Method (C-I method), the Long-Range Forecast-Interpolation Method (F-I method), The Climatology-Machine Learning Method (C-ML method), and the Long-Range Forecast-Machine Learning Method (F-ML method) were compared for drought forecasting in ungauged areas. Machine learning-based methods performed better than interpolation methods for both classification and regression, and the methods using climatology data outperformed the methods using long-range forecast. The model based on climatological data and the machine learning method outperformed overall (Figures 2 and 3).
Figure 2. Classification accuracy based on C-I and F-I methods, C-ML and F-ML methods using the DT, RF, and ET models
respectively for SPI6 (above) and SPEI6 (below).
Figure 3. Regression MAE based on I and F-I methods, C-ML and F-C-ML methods using the DT, RF, and ET models
respectively for SPI6 (above) and SPEI6 (below).
4. CONCLUSIONS
It is recommended to forecast SPI6 or SPEI6 values based on machine learning using climatological data to provide spatially distributed drought information with a spatial resolution of 0.05 × 0.05 °, as used in this study. The classification accuracy will be in the range of 0.47-0.52 with 1-month lead time, and will decrease to 0.21-0.35 with 6-month lead time for ungauged areas. The regression MAE will be in the range of 0.41-0.47 with 1-month lead time, and in the range of 0.50.59 with 6-month lead time for ungauged areas. The long-range forecast will be more useful with the improvement of their forecasting skill, the classification accuracy with perfect forecast will reach 0.50-0.56, and the regression MAE will reach to 0.35-0.40 for ungauged areas. The performance measure results derived from the models tested in this study can be used as baselines for future drought forecasting studies.
ACKNOWLEDGEMENTS
This research was supported by APEC Climate Center and the National Space Lab Program through the National Foundation of Korea (NRF) funded by the Ministry of Science, ICT, & Future Planning (Grant: NRF-2013M1A3A3A02042391).
REFERENCES
Breiman, L., 2001. Random forests. Mach. Learn., 45, pp. 5-32.
McKee, T. B., N. J. Doesken, and J. Kleist, 1993. The relationship of drought frequency and duration of time scales. In: Proceedings of the 8th Conference of Applied Climatology, Anaheim, CA, USA, American Meteorological Society, pp. 179-184.
Vicente-Serrano, S. M., S. Begueria, and J. I. Lopez-Moreno, 2010. A multiscalar drought index sensitive to global warming: The Standardized Precipitation Evapotranspiration Index. Journal of Climate, 23, pp. 1696-1718.
The International Archives of the Photogrammetry, Remote Sensing and Spatial Information Sciences, Volume XLI-B8, 2016 XXIII ISPRS Congress, 12–19 July 2016, Prague, Czech Republic
This contribution has been peer-reviewed.