ANALYSIS OF INFLUENCE OF TERRAIN RELIEF ROUGHNESS ON DEM
ACCURACY GENERATED FROM LIDAR IN THE CZECH REPUBLIC TERRITORY
M. Hubacek a, V. Kovarik a*, V. Kratochvil a
a
Dept. of Military Geography and Meteorology, University of Defence, Brno, Czech Republic – (martin.hubacek, vladimir.kovarik, vlastimil.kratochvil)@unob.cz
Commission VI, WG IV/1
KEY WORDS: DEM, LIDAR, ALS, Accuracy, Micro-relief, Terrain slope, Terrain roughness
ABSTRACT:
Digital elevation models are today a common part of geographic information systems and derived applications. The way of their creation is varied. It depends on the extent of area, required accuracy, delivery time, financial resources and technologies available. The first model covering the whole territory of the Czech Republic was created already in the early 1980's. Currently, the 5th DEM generation is being finished. Data collection for this model was realized using the airborne laser scanning which allowed creating the DEM of a new generation having the precision up to a decimetre. Model of such a precision expands the possibilities of employing the DEM and it also offers new opportunities for the use of elevation data especially in a domain of modelling the phenomena dependent on highly accurate data. The examples are precise modelling of hydrological phenomena, studying micro-relief objects, modelling the vehicle movement, detecting and describing historical changes of a landscape, designing constructions etc.
Due to a nature of the technology used for collecting data and generating DEM, it is assumed that the resulting model achieves lower accuracy in areas covered by vegetation and in built-up areas. Therefore the verification of model accuracy was carried out in five selected areas in Moravia. The network of check points was established using a total station in each area. To determine the reference heights of check points, the known geodetic points whose heights were defined using levelling were used. Up to several thousands of points were surveyed in each area. Individual points were selected according to a different configuration of relief, different surface types, and different vegetation coverage. The sets of deviations were obtained by comparing the DEM 5G heights with reference heights which was followed by verification of tested elevation model. Results of the analysis showed that the model reaches generally higher precision than the declared one in majority of areas. This applies in particular to areas covered by vegetation. By contrast, the larger deviations occurred in relation to the slope of the terrain, in particular in the micro-relief objects. The results are presented in this article.
* Corresponding author
1. INTRODUCTION
Thanks to a development of computers, geographic information systems and internet the exploitation of geographic data spread into nearly all domains of human activities. Today, the web map portals offer not only the maps but also aerial and satellite imagery and other forms of depicting the geographic space such as 3D visualizations. However, there are still activities related to the geographic data processing that require special knowledge and skills such as collection of geographic data, map production or geospatial analysis. The quality of analysis is dependent on a quality of geographic data (Hoskova-Mayerova et al. 2013). Since the beginning of using geographic information systems and digital geographic data, digital elevation models belong to one of the most exploited data sources.
The application domains of these models are extensive and they range from architecture and civil engineering (Shiode 2000, Sobotka 2012), water management (Kenward et al. 2000, Rapant et al. 2015, Vranka and Svatonova 2006) and transportation (Rybansky and Vala 2009) to crisis management and defence (Maceda et al. 2009, Rybansky et al. 2014, Talhofer et al. 2015) etc. The first models were generated using traditional cartometric methods that were supplemented by surveying methods when the high accuracy at limited areas was
required (Gallant 2000). Some models were produced using the stereophotogrammetric method or a combination of other methods. Nowadays, the airborne laser scanning (ALS) is in the forefront of the methods of the elevation model production. This technology allows collecting large volumes of data covering extensive areas in relatively short time.
The ALS was employed also for creating the new elevation models in the Czech Republic. These models, with their level of detail and accuracy, represent a new generation of geographic data. Due to the improved accuracy of these models in comparison with the previous models, the expectations are high. It is therefore necessary to conduct an independent verification of their accuracy and to determine possible limitation of their use.
2. CZECH REPUBLIC DEMs
The first simple elevation models under the name the digital elevation model (DMR) were introduced into the Czech Army more than four decades ago (Miklosik 2013). These were the first digital geographic data being created and used for landscape modelling and analysing the phenomena taking place in geographic space. The DMR 1 was created in the second half of the 1980´s and DMR2 in the early 1990´s. Both the models The International Archives of the Photogrammetry, Remote Sensing and Spatial Information Sciences, Volume XLI-B4, 2016
were in a form of a regular grid of points of 1 km×1 km and 100 m×100 m, respectively. DMR 2 has been used for a long time as one of the main elevation data sources during the development of geographic information systems. In the course of time, DMR 2 was replaced by the DMR 2.5, which was refined using the contour lines from the topographic maps. Later, it was replaced by the DMR 3 which was obtained by stereophotogrammetric evaluating of the aerial photographs (Brousek and Laza 2006). Elevation models of the Fundamental Base of Geographic Data of the Czech Republic (ZABAGED®) are available in the civilian sector. Currently the two following models are provided to users: ZABAGED® - altimetry 3D contour lines and ZABAGED® - altimetry grid 1010 (Geoportal CUZK 2010).
All these elevation models were created using traditional data collection methods. Nowadays, the ALS method is used predominantly. This technology is very effective and allows to collect large amount of data covering extensive area in relatively short time.
Based on the new user requirements of quality and accuracy of the altimetry data, availability of GIS technologies for a large number of new users, and the new effective and accurate data collection methods, a project focused on mapping of the altimetry of the Czech Republic territory was launched in 2008. Both the civilian and military sector takes part in the joint project of the Czech Office for Surveying, Mapping and Cadastre (CUZK); the Ministry of Defence and the Ministry of Agriculture (Brazdil et al. 2009). The project set a foundation for creating the new altimetry model of the Czech Republic using the ALS technology. Scanning of the whole state territory was carried out between 2010 and 2013. As a result of data
The DMR 4G model shows the earth’s terrain (natural as well as modified by the human activities) in a digital form showing the heights of individual points in a regular grid of points 5×5 m having coordinates X, Y, H, where H means the height in the Czech Republic territory (Brazdil et al. 2012a).
2.2 DMR 5G
The DMR 5G model represents a picture of the earth’s terrain in a digital form as well, however it shows the heights of individual points in an irregular triangular network (TIN) with a total standard error of height 0.18 m in a bare terrain and 0.3 m in a forested terrain. According to (Brazdil et al. 2012b) the DMR 5G is supposed to be gradually formed within 30 months after the scanning. Currently, approximately 80 percent of the state territory has been finished. This model is the most accurate elevation model in the Czech Republic and probably will stay as
that in a long term. This predestines it for widespread use in a large number of applications requiring elevation data of the highest quality. Therefore, it is necessary to verify its accuracy independently.
3. VERIFICATION OF ACCURACY
Verification of accuracy of the new elevation models is a prerequisite for their future use. Verification is performed by the CUZK as a principle producer of these models and also by the independent organizations such as universities. Already obtained results of verification can be found for example in (Mikita et al. 2013, Hubacek et al. 2014, Silhavy and Cada 2015). The following verification methods are recommended: (Brazdil et al. 2012a, 2012b):
‒ special calibrating bases ‒ known geodetic heights
‒ terrain height measurement in selected areas.
The Department of Military Geography and Meteorology of the University of Defence also participated in the verification which was concentrated especially on using of the last of the methods. Using the Leica TC 1500 total station specialists of the department along with the students surveyed several thousands of check points within each of the selected areas of the South
The monumented geodetic points having heights determined by precise levelling were chosen as reference heights. In the case of sites where there were no such points available, the GPS surveying using the Trimble GeoXR GNSS receiver was performed in order to obtain reference points.
The heights of the surveyed points were paired with the heights obtained from the individual elevation models using the ArcGIS 10.2 which provided a set of deviations (Equation 1). distribution it is possible, according to known relationships specified in the literature relating to the calculus of observations and statistical data processing (Böhm 1990, Meloun 2002), to determine the value of the mean error and to compare it with the declared value of these models. Despite the very large file of measured points, the possibility of systematic errors and other phenomena that could affect the calculated deviations cannot be excluded. From this reason, it was necessary to carry out tests of normality before calculating the mean errors. Empirical moments and three statistical trials - null hypothesis, the asymmetry of distribution, kurtosis - were used for normality The International Archives of the Photogrammetry, Remote Sensing and Spatial Information Sciences, Volume XLI-B4, 2016
testing. All the three trials are commonly used for testing of geodetic measurements. Significance level α = 0.05 was selected for all sets of deviations and for all trials.
The results of normality tests did not confirm normal distribution of deviations between the heights of control points and the points obtained from the models, therefore the normality hypothesis had to be rejected It was necessary to reject the normality hypothesis at least in one trial out of all tested deviation sets at the chosen significance level.
Because it failed to show the normal distribution of height deviations, the confidence interval of 95% was used to determine the accuracy of elevation models. When the values were compared with the double standard error of the tested elevation models (Table 1), it could be seen that both models achieved declared accuracy values. The multiple average error (± 2σ) was chosen because of the known fact that for one-dimensional normal distribution the probability density of the observed phenomenon reaches for this value about 95% (Böhm 1990).
Locality DEM 4G [m] DEM 5G [m]
Velká Bíteš 0.61 0.25
Brno-Černá Pole 0.53 0.23
Útěchov 0.56 0.25 Březina 0.51 0.24 ± 2σ (uncovered terrain) 0.60 0.36
Table 1. Comparison between accuracy of the models in tested locations and the declared accuracy
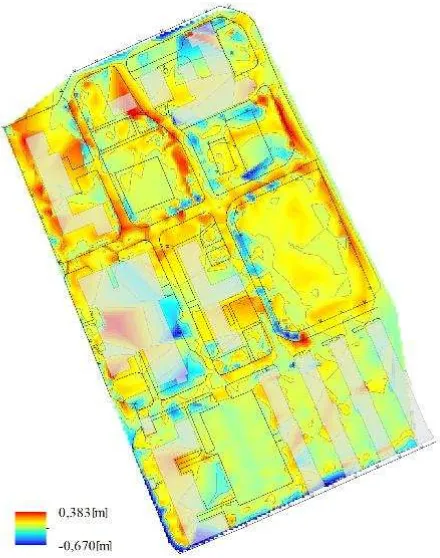
Figure 1. Spatial deviations distribution of DEM 5G in the Brno-Černá Pole area
The analysis of the accuracy of the models was focused primarily on assessing the accuracy in both the open and forested terrains. The results showed that despite a presence of systematic effects the models comply with the declared accuracy in both the open terrain and the areas covered by vegetation (Hubacek et al. 2015).
Especially the results obtained from areas covered by vegetation show noticeably better accuracy than it is declared in technical documentation of the models (Brazdil et al. 2012a, 2012b). On the other hand, there was a negative phenomenon of bigger deviations that occurred in areas with a bigger slope of the terrain. It manifested mainly in the area of Brno - Černá Pole which is the largest of all areas. Fig. 1 shows distribution of deviations in this area. This fact is surprising especially for the DMR 5G model which is more accurate. It was more expected for the DMR 4G model due to the technology of its production (Brazdil et al. 2012a) which brings distortion of particular terrain features.
Due to predominantly flat terrain of this area it was not possible to unambiguously determine whether the deviations are directly dependent on a terrain slope or the micro-relief objects that are prevailing in this area. To verify this finding the new area was selected which would be suitable for examination of the dependency of the model accuracy on the terrain slope.
3.1 Testing area
The testing area for verification of dependency of the DMR 5G accuracy on a slope of the terrain is situated in the Dědice military training area, approximately 30 km to the north-east of Brno. The area of size 600×150m has varying slope of 0° to 20° and several distinct micro-relief objects (see the profile in Fig. 2). The area is covered only by grass with a sparse low wood. It can be therefore assumed that there were no reflections from the vegetation and majority of beams were reflected from the earth's surface during scanning.
Figure 2. Elevation profile in the Dědice area
To collect check points, five geodetic points were established in the area using the Trimble GeoXR GNSS receiver. Surveying results were processed in the Trimble Business Center software suite with help of reference data from the CZEPOS permanent station network. For the control, the distances and height differences of the points were measured using the Leica TC 1500 total station. Differences in heights between the individual points did not exceed 15 mm therefore the points were considered as reference for the purposes of verification of influence of a terrain slope on the DMR 5G accuracy.
Using these reference points approx. 2,500 points were surveyed. They were selected to be evenly distributed across the The International Archives of the Photogrammetry, Remote Sensing and Spatial Information Sciences, Volume XLI-B4, 2016
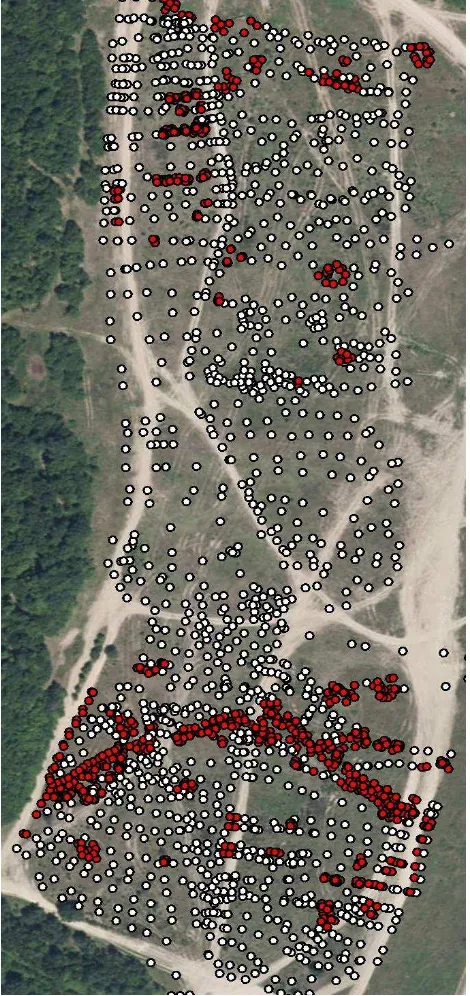
area and to follow distinct terrain features and micro-relief objects (see the distribution of points in Fig. 3).
Figure 3. Distribution of control points in the Dědice area (red dots represent micro-relief objects)
3.2 Analysis of deviation set
The new set of deviations was tested for normality. It is surprising that not a single hypothesis was confirmed and the set could not be considered as having normal distribution. The results show the systematic effect in the area. To verify the overall accuracy, a percentile with a confidence interval 95% was determined as in the case of previous areas. To determine the influence of a terrain slope, surveyed points were divided into the eight categories (see Tab. 2). Basic parameters of a set and percentile 95% were determined in each category. Ideally,
the percentile value would allow to discover the dependency of model accuracy on a terrain slope. However, due to an uneven distribution of points in the individual categories, it is not possible to determine such dependency.
Slope Perc
en
ti
le.
95%
[m
]
Av
era
g
e
[m
]
M
ed
ian
[m
]
|M
AX
|
[m
]
Nu
m
b
er
o
f
p
o
in
ts
all 0.42 0.19 0.20 2.39 2448 < 3° 0.30 0.16 0.19 0.52 432 3°-5° 0.37 0.16 0.18 0.82 716 5°-7.5° 0.40 0.18 0.20 0.74 631 7.5°-10° 0.45 0.20 0.21 2.39 270 10°-15° 0.50 0.23 0.24 1.18 263 15°-20° 0.63 0.31 0.28 1.94 58 20°-30° 1.18 0.36 0.34 2.21 34 > 30° 1.56 0.46 0.39 1.88 44
Table 2. Main characteristics of accuracy according to slope
Figure 4. Distribution of deviation absolute values and regression line
To do that, all the surveyed points were drawn in a scatter plot (see Fig. 4) and the linear regression was applied. The graph shows that the regression line is practically parallel to the slope axis and dependency of the deviation value on a slope cannot be proved (see Equation 2).
1583 . 0 0081 .
0
x
y (2)
where y = expected deviation x = slope
When studying distribution of deviations and a slope layer in ArcGIS, maximum deviation is shown especially in areas with a maximum terrain slope. A detailed investigation shows that it occurs particularly in the areas with micro-relief objects.
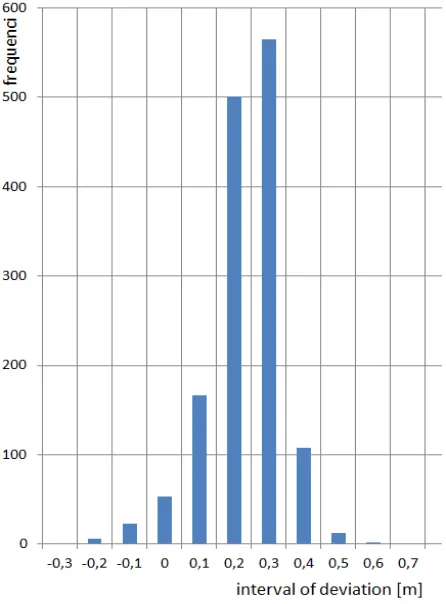
This led to excluding points located on micro-relief objects from the test set. This new set containing approx. 1,450 points was tested separately. It is limited only to the points with a maximum terrain slope of 20° (and 22° in the case of two points). Neither this set complies with requirements for normal distribution even though the histogram seems to be shifted to positive values (see Fig. 5). The linear regression was applied to the set of the absolute values of deviations (Equation 3 and Fig. 6). Neither this result allows to unambiguously demonstrate The International Archives of the Photogrammetry, Remote Sensing and Spatial Information Sciences, Volume XLI-B4, 2016
dependency of model accuracy on a terrain slope (Tab. 3). Therefore, the deviations obtained from surveying are most likely caused by other factors.
Figure 5. Histogram deviations of DMR 5 in the Dědice area (points on micro-relief objects excluded)
1655 . 0 0055 .
0
x
y (3)
where y = expected deviation x = slope
3.3 Discussion of results
The analysis of the deviation set did not prove dependency of the DMR 5G model on the relief slope. Considering the results of testing, it is possible to state that expected accuracy of the model is identical whether the terrain is flat or hilly. The effect of systematic errors and positive shift of deviation values was proved in all tested areas. The shift of deviation values differs in particular areas therefore it cannot be considered as constant.
Due to the systematic effects the method of determining the percentile 95% was applied. The percentile was compared to the double standard error of the DMR 5G model which is close to the value of 95% for one-dimensional deviation set. The percentile value in all test areas complied with the requirement to be less or equal than double standard error. It is therefore possible to state that the DMR 5G model complies with the declared accuracy.
Figure 6. Distribution of deviation absolute values and regression line (points on micro-relief objects excluded)
Slope Perc
en
ti
le.
9
5
%
[m
]
Av
era
g
e
[m
]
M
ed
ian
[m
]
|M
AX
|
[m
]
Nu
m
b
er
o
f
p
o
in
ts
all 0.33 0.18 0.19 0.61 1439 < 3° 0.29 0.16 0.19 0.43 337 3°-5° 0.31 0.18 0.18 0.52 511 5°-7.5° 0.33 0.19 0.20 0.42 391 7.5°-10° 0.34 0.20 0.21 0.39 112 10°-15° 0.42 0.23 0.23 0.61 77 15°-20° 0.44 0.28 0.28 0.47 11
Table 3. Main characteristics of accuracy according to slope (points on micro-relief objects excluded)
Figure 7. Visualization of deviations on top of the slope layer, the largest deviations on the micro-relief objects
Nevertheless, due to the analysis results it is necessary to point out the particular problems of the model. These problems occur in areas where the micro-relief objects are present (Fig. 7). Significantly bigger deviations occur in these areas and they reach even more than one meter in some cases. It can be expected that with a probability of 95% the deviations will not exceed the value of 0.5 m. This finding is important especially for future users of the DMR 5G model using it for detailed analysis such as hydrologic analysis and so on. It will be always necessary to assess results of this analysis with respect to the The International Archives of the Photogrammetry, Remote Sensing and Spatial Information Sciences, Volume XLI-B4, 2016
shape and roughness of the micro-relief objects present in a particular area.
4. CONCLUSIONS
Testing of accuracy of the elevation models of the new generation - DMR 4G and DMR 5G – proved their high accuracy and quality. The discovered height deviations between the model points and the points surveyed using geodetic methods comply with declared standard errors of the models both in the open terrain and in areas covered by vegetation.
During testing, potential dependency of the model accuracy on a terrain slope emerged, thus surveying in the specifically selected area was performed in order to confirm or reject that dependency. The results of surveying approx. 1,450 points selected off the micro-relief objects did not confirm this dependency. On the contrary, it is necessary to warn the future users of the DMR 5G model of a worse accuracy in the areas where the micro-relief objects are present.
Despite some uncovered problems the elevation models of the new generation comply with declared parameters and these models represent a significant contribution to all users of geographic data.
ACKNOWLEDGEMENTS
This paper is a particular result of the defence research project DZRO K-210 NATURENVI managed by the University of Defence in Brno.
REFERENCES
Böhm, J. 1990. Theory of errors and adjustment calculus. (in Czech), Geodetický a kartografický podnik, Praha, 416 p.
Brazdil, K. et al., 2009. Detail design elevation data processing. Technical report (in Czech), In: Zeměmě ický ú ad, VGHMÚ . Pardubice, Dobruška, Czech Republic, 44 p.
Brazdil, K. et al., 2012a. Technical report on the digital terrain model DMR 4th generation. (in Czech), In: Zeměmě ický ú ad, VGHMÚ .Pardubice, Dobruška, Czech Republic, 11 p.
Brazdil, K. et al. 2012b. Technical report on the digital terrain model DTM 5th generation. (in Czech), In: Zeměmě ický ú ad, VGHMÚ .Pardubice, Dobruška, Czech Republic, 12 p.
Brousek, L., Laza, L. 2006. 55 years of military geography in Dobruška” (in Czech), Vojenský geografický obzor 2006(1), pp. 1-19.
Gallant, J. C. 2000. Terrain analysis: principles and applications. John Wiley & Sons. New York.
Geoportal CUZK, © 2010. “Data sets/Altimetry”, Praha, Czech Republic http://geoportal.cuzk.cz (30 Mar. 2016).
Hoskova-Mayerova, S., et al. 2013. Spatial database quality and the potential uncertainty sources. Studies in Computational Intelligence: Advanced Dynamic Modeling of Economic and Social Systems. Book series. Springer Verlag, pp. 127-142.
Hubacek, M., et. al. 2014. Verification of accuracy of the new generation elevation models. Advances in Military Technology, 9(2), 21-32.
Hubacek, M., et al. 2015. Accuracy of the new generation elevation models. In: ICMT 2015 - International Conference on Military Technologies, Brno, Czech Republic, pp. 1-9.
Kenward, T., et al. 2000. Effects of digital elevation model accuracy on hydrologic predictions. Remote Sensing of Environment, 74(3), pp. 432-444.
Maceda, E. A., et al. 2009. Experimental use of participatory 3dimensional models in island community-based disaster risk management. Shima: The International Journal of Research into Island Cultures, 3(1), pp. 72-84.
Meloun, M. 2002. The compendium of statistical data analysis: methods and problem solving. (in Czech), Academia, Praha, 764 p.
Mikita, T., et al. 2013. Evaluation of airborne laser scanning data for tree parameters and terrain modelling in forest environment. Acta Universitatis Agriculturae Et Silviculturae Mendelianae Brunensis, 61(5), pp. 1339-1347.
Miklosik, F. 2013. To study the history of military geographic service (in Czech). Vojenský geografický obzor, 2013(2), pp. 19-22.
Rapant, P., et al. 2015. Early warning of flash floods based on the weather radar. In: Proceedings of the 2015 16th International Carpathian Control Conference, ICCC 2015, Miskolc, Hungary, pp. 426-430.
Rybansky, M., Vala, M. 2009. Analysis of relief impact on transport during crisis situations. Moravian Geographical Reports, 17(3), pp. 19-26.
Rybansky, M., et al. 2014. The impact of terrain on cross-country mobility - geographic factors and their characteristics. In: 18th International Conference of the ISTVS, Seoul, Korea.
Shiode, N. 2000. 3D urban models: recent developments in the digital modelling of urban environments in three-dimensions. GeoJournal, 52(3), pp. 263-269.
Silhavy, J., Cada, V. 2015. New automatic accuracy evaluation of altimetry data: DTM 5G compared with ZABAGED® altimetry. In: Lecture Notes in Geoinformation and Cartography, Ostrava, Czech Republic. pp. 225-236.
Sobotka, J. 2012. Comparison of elevation data of the Czech Republic for design military constructions. Advances in Military Technology. 7(2), pp. 57-63.
Talhofer, V., et al. 2015. Application of fuzzy membership function in mathematical models for estimation of vehicle trafficability in terrain. In: APLIMAT 2015 - 14th Conference on Applied Mathematics, Bratislava, Slovak, Proceedings, pp. 711-719.
Vranka, P., Svatonova, H. 2006. Continuous soil lost modeling in the Haraska Watershed – an application of 4D digital landscape model. Moravian geographical reports. 14(1), pp. 38-45.