A REGION-BASED MULTI-SCALE APPROACH FOR OBJECT-BASED IMAGE
ANALYSIS
T. Kavzoglu*, M. Yildiz Erdemir , H. Tonbul
Geomatics Engineering Dept., Gebze Technical University, 41400 Gebze Kocaeli, Turkey - (kavzoglu, m.yildiz,
htonbul)@gtu.edu.tr
Commission VII, WG VII/4
KEY WORDS: Object Based Image Analysis, Region-based scale, Classification, Multiresolution Segmentation, Estimation
of Scale Parameter (ESP).
ABSTRACT:
Within the last two decades, object-based image analysis (OBIA) considering objects (i.e. groups of pixels) instead of pixels has gained popularity and attracted increasing interest. The most important stage of the OBIA is image segmentation that groups spectrally similar adjacent pixels considering not only the spectral features but also spatial and textural features. Although there are several parameters (scale, shape, compactness and band weights) to be set by the analyst, scale parameter stands out the most important parameter in segmentation process. Estimating optimal scale parameter is crucially important to increase the classification accuracy that depends on image resolution, image object size and characteristics of the study area. In this study, two scale-selection strategies were implemented in the image segmentation process using pan-sharped Qickbird-2 image. The first strategy estimates optimal scale parameters for the eight sub-regions. For this purpose, the local variance/rate of change (LV-RoC) graphs produced by the ESP-2 tool were analysed to determine fine, moderate and coarse scales for each region. In the second strategy, the image was segmented using the three candidate scale values (fine, moderate, coarse) determined from the LV-RoC graph calculated for whole image. The nearest neighbour classifier was applied in all segmentation experiments and equal number of pixels was randomly selected to calculate accuracy metrics (overall accuracy and kappa coefficient). Comparison of region-based and image-based segmentation was carried out on the classified images and found that region-based multi-scale OBIA produced significantly more accurate results than image-based single-scale OBIA. The difference in classification accuracy reached to 10% in terms of overall accuracy.
1. INTRODUCTION
Traditional pixel-based classification methods have become less effective given the magnitude of heterogeneity existing in VHR imagery. High degree of within-class spectral variability and between-class spectral similarity of many land use/cover (LULC) types in VHR images results in low classification accuracies when these methods are employed. In last decades, object based image analysis (OBIA) has gained rapid popularity for acquisition of effective LULC classification. An advantage of OBIA is to create objects on the image through segmentation using neighbour and spectral similarity pixels, contrary to pixel-based classification. OBIA offers advantages for multi-scale image and hierarchical object representation, especially in high spatial resolution image (Tzotsos et al., 2011; Kim et al., 2011).
OBIA is frequently implemented in three stages: image segmentation, classification and accuracy assessment. Image segmentation that divides an image into smaller objects is the first step in object based approach. In the literature, multiresolution segmentation approach has been one of the most influential image segmentation algorithms (Witharana and Civco, 2014). It is a region growing algorithm that depends on grouping pixels of initial single pixels and produces homogeneous image
objects (Baatz and Schäpe, 2000). It comprises several
user dependent segmentation parameters namely, scale, shape, compactness and band weights. Scale parameter that controls the segment sizes depends on various factors including characteristics of study area, image resolution and land cover types (Myint et al., 2011). It is considered crucially important for determining the closest real world objects (Witharana and Civco, 2014).
and unsupervised evaluation methods are used (Zhang et al., 2008). Supervised methods measure the difference between segmentation results and reference objects (Witharana and Civco, 2014). In unsupervised methods, intra-segment and inter-segment heterogeneity for each segment were calculated and some quality criteria were used for scoring and ranking without reference objects (Johnson et al., 2011). For instance, objective function and global score were determined to detect optimal scale parameters in unsupervised evaluation methods (Espindola et al. 2006; Johnson et al., 2011; Gao et al., 2011),
Being a popular scale determination tool, estimation of scale parameter (ESP) tool was developed for automated selection of scale parameter by Drăgut et al. (2010). In the ESP tool, a graph is generated using local variance (LV) of image and rate of change (RoC) values of LV. Thus, LV-RoC graph is obtained on each scale step in an image considering a single layer. The tool has been recently advanced to consider multiple layers (up to 30 bands) and renamed as ESP-2 by Drăgut et al. (2014). The use of a region-based approach for segmentation scale determination is investigated in this study. For this purpose, a novel methodology is proposed with the aim of improving classification accuracy. To validate the robustness of the proposed methodology, two scale-selection strategies were implemented in the image segmentation process. In the first strategy, optimal scale parameters were estimated for extracted sub-regions of the image. Afterwards, the LV-RoC graphs produced by the ESP-2 tool were analysed to determine fine, moderate and coarse scales for each sub-region. In the second strategy, the whole image was segmented using three candidate scale values estimated from LV-RoC graph of the image. After the segmentation process, all objects of image-based scale and region-based scale solutions were subject to a classification process considering the training data set prepared from ground reference map of the study area.
2. STUDY AREA
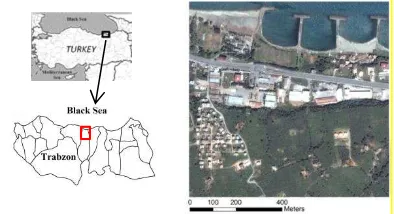
A Quickbird-2 multi-spectral pan-sharpened image with four spectral bands (blue, green, red and NIR) and 0.6-meter spatial resolution acquired in May 2008 was used. The study area is in Yomra district of Trabzon province where mountainous terrain covered by forest, farmland and urban classes located in north east part of Turkey (Figure 1). For this study, a subset image covering 1500 x 1500 pixels was extracted and used in subsequent analyses. All segmentation and classification analysis conducted in this study were carried out using eCognition (Developer v. 9.1, Trimble) and ArcGIS (v. 10.0, ESRI) software packages.
3. METHODOLOGY 3.1 Image segmentation and scale selection
Image segmentation is a fundamental part of object-oriented image analysis. Its main purpose is to partition an image into relevant parts to simplify the illustration of an image more meaningful. A group of pixels which have similar spectral and spatial characteristics is considered an object as opposed to single pixels in object-based
classification approach. To put it more explicitly, image segmentation is a process separating objects of interest from other parts of the image.
Figure 1. Location of the study area, Yomra district of Trabzon, Turkey.
Multiresolution segmentation approach, employed here, is a bottom up region merging technique based on local homogeneity criteria. Its primary components are: (i) decision heuristics which determine the object combination, (ii) degree of fitting which regarding to homogeneity of a pair image objects (Baatz and Schäpe, 2000). The first step of a segmentation based on three parameters: scale, colour-shape and smoothness-compactness. Shape settings can be weighted from 0 to 1 to determine objects at different level of scales. Scale parameter is a unitless abstract which adjust the object size according to users required level of detail can be considered the most essential criterion of image segmentation. The higher number of scale means larger homogenous objects, while smaller number of scale means smaller objects (Myint et al., 2011).
Many approaches have been suggested and applied by the researchers to detect optimal scale parameter. However, no operational setting was found to specify of scale parameter selection in the literature. Estimation of Scale Parameter 2 (ESP-2) tool (Drăgut et al., 2014) which is
an improved version of ESP tool (Drăgut et al., 2010)
was utilized in processing steps with eCognition software. According to Drăgut et al. (2010), “The ESP tool iteratively generates image-objects at multiple scale levels in a bottom-up approach and calculates the local variance (LV) for each scale image”. Rate of change (RoC) values of LV is determined for each scale levels using Eq. 1. The RoC is calculated as:
(1)
where L is local variance at the target level and L-1 is local variance at next lower level.
The tool automatically detects three optimal scales, ranging from fine scales to broader scales. Hierarchy or non- hierarchy approach is employed to multiresolution segmentation algorithm to achieve more robust scale parameters in user-defined steps automatically. The method relies on the ability of local variance for detecting
3.2 Extracting regions for improved segmentation
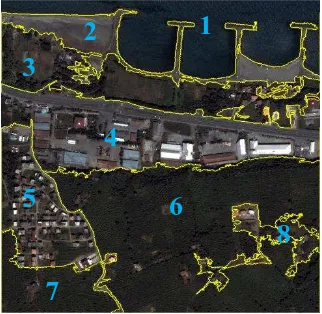
A new methodology is proposed in that whole image was divided into multiple regions so that each region comprises of real-world objects and required different segmentation scales. It is known that ESP-2 tool produces three levels of scale solutions after considering variations in local variance. The third level, which is the coarsest solution, can be applied to whole image to create extremely large objects with maximum similarity principle. We suggest that these objects can be used as
“spectrally homogeneous regions” and detailed search for
parametrization can be conducted on these regions. When the third scale level was applied to the selected image, eight regions were delineated for further study (Figure 2).
Figure 2. Extracted regions on the image.
3.3 Classification
The methodology followed by classification step. There are two options are presented to users in software: membership function classifier and nearest neighbour classifier. The membership function classifier is a non-parametric rule and based on fuzzy logic of segment
features. Therefore, user’s expert knowledge to determine
feature spaces is become crucial in this method (Myint et al, 2011).
The nearest neighbour classifiers image objects in a given feature space based on given samples for the classes concerned. For each image object, the distance in the feature space to nearest sample object is calculated and assigned to suitable class according to represented closest sample object (Definiens, 2008).
4. RESULTS AND DISCUSSIONS
In this study, two scale selection strategies were implemented and compared with each other in terms of resulting classification accuracy; which are single-scale and regional-scale selection strategies. The estimation of scale parameter (ESP-2) method was employed to determine the optimal scale values through local variance
variations. Outputs of ESP-2 tool were imported into MS Excel and LV-RoC graphs were drawn.
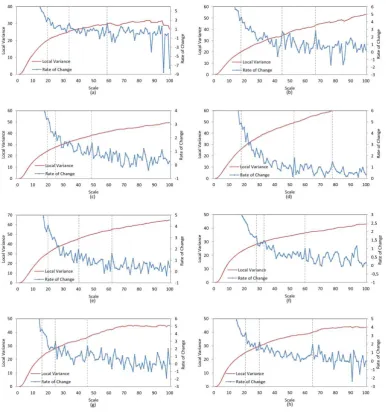
ESP-2 tool produced image segments considering three spectral bands (green, red and NIR) in three scale levels (117 at Level 1, 247 at Level 2 and 1147 at Level 3). By applying Level 3 scale value the image was divided into eight objects that were taken as regions for further analyses. Afterwards, three scale values were estimated for each extracted regions using the peaks in the LV-RoC graphs as a result of visual interpretation (Figure 3). The peaks in the LV graph would indicate the cell size that approximates the spatial dimension of the most characteristic objects in the scene (Drăgut et al., 2011). These scale values were called fine, moderate and coarse scales on the graphs. Also, the same process of scale selection was applied to LV-RoC graph estimated for whole image instead of regions (Figure 4). Peaks at 28, 40 and 91 on the graph appeared to be suitable values for fine, moderate and coarse scales, respectively. In addition to above scale settings, Level 1 scale value (ESP2-L1) given by ESP tool was utilized for performance comparison. All estimated and selected scale values are given in Table 1. Multi-resolution segmentation approach was used to obtain objects with the estimated scale parameters and then segmented images were created. It should be noted that shape and compactness parameters were keep constant as 0.1 and 0.5, respectively.
Segmented Unit
Scale Level
Fine Moderate Coarse ESP2-L1
Image 28 40 91 117
Table 1. Estimated scale parameters for whole image and extracted regions at three levels.
Figure 3. RoC-LV graphs of regions (a) Region 1, (b) Region 2, (c) Region 3, (d) Region 4, (e) Region 5, (f) Region 6, (g) Region 7 and (h) Region 8.
Figure 4. RoC-LV graph of whole image. Fine, moderate and coarse scales values were selected as 28, 40 and 91, respectively.
Classifications were performed using test datasets on the basis of contingency matrices. Test datasets were prepared using random pixel selection strategy and equal numbers of samples for each class (700 pixels) were selected. For the assessment of classification results, overall classification accuracy (OA) and Kappa statistics were computed from the contingency matrices (Table 2). Using the region-based scale selection, the overall
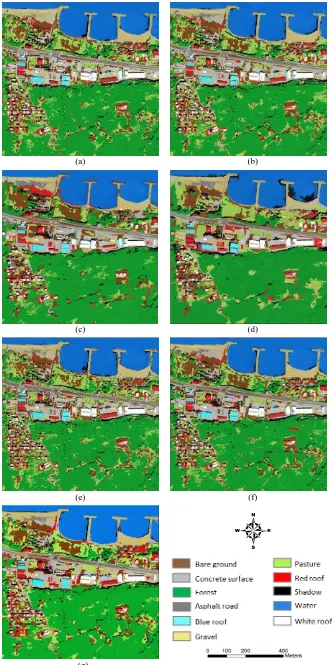
accuracies of the classifications were calculated 90.7, 91.4 and 89.17 on fine, moderate and coarse scale values, respectively. For the single-scale selection on whole image, the overall accuracies of the classifications were estimated 89.42, 90.97 and 82.48 on fine, moderate and coarse scale values, respectively. All classified image results are shown in Figure 5.
Segmented
Unit Scale
Overall Acc.
(%) Kappa
Image
Fine 89.42 0.884
Moderate 90.97 0.901
Coarse 82.48 0.807
ESP2-L1 80.72 0.788
Region
Fine 90.70 0.898
Moderate 91.40 0.905
Coarse 89.17 0.881
(a) (b)
(c) (d)
(e) (f)
4
(g)
Several important conclusions can be deduced from the results produced in this study. Firstly, it was found that the highest classification accuracies could be produced using moderate level of scale values for both cases (90.97 for image-based and 91.40 for region-based in terms of overall accuracy). Secondly, the overall accuracies of the classifications based on fine scales of region-based and image-based segmentation were slightly lower (about 1%) than those of the moderate scale solutions. When the classification performances were compared for the coarse level scale solutions, it was found that the region-based scale selection produced more accurate results than the image-based scale selection by about 7% in terms of overall accuracy. Also, it is concluded that the use of coarse single-scales for whole image produced the lowest classification accuracies. The reason could be related to spectrally similar classes and mixed pixels in the training datasets, and correspondingly misclassification problems between some classes in coarse scales.
5. CONCLUSIONS
In this study, a region-based scale selection approach was developed for optimal parameterization as a new perspective. In this context, analyses were carried out by constructing of sub-regions of the image. The main advantage of region-based multi-scale segmentation is that particular characteristics of each region are known and regions consisting of several scale parameters could be separated. In order to extract regions from the image, a novel strategy was applied using the coarsest level of scale indicated as third level scale in ESP2 tool. Later, fine, moderate and coarse scale values were determined through a visual inspection on LV-RoC graphs. Results clearly showed the effectiveness of the proposed approach with significant improvements in classification accuracy. It is worth nothing that the experiments showed that moderate scale values produced more accurate results compared to fine and coarse scale values.
The results also showed that the difference between region- and image-based scale selections in classification accuracy reached to 10%. Furthermore, the results clearly showed that level 1 scale (i.e. fine scale) value of 117 determined by the ESP-2 is inappropriate since it produced very large objects with multiple LULC classes. Consequently, overall accuracies of the classifications based on regionalized scale selection were higher than the single scale selection for all cases (i.e. fine, moderate and coarse levels). It means that the region-based scale selection approach provides more effective definition through segmentation for urban land cover classification.
REFERENCES
Baatz, M. and Schäpe, A., 2000. Multiresolution segmentation: an optimization approach for high quality multi-scale image segmentation. In: Strobl, J., Blaschke, T.,Griesebner,G. (Eds.), Angewandte Geographische Informationsverarbeitung, vol. XII. Wichmann, Heidelberg, pp. 12-23.
Belgiu, M. and Drǎguţ, L., 2014. Comparing supervised and unsupervised multiresolution segmentation approaches for extracting buildings from very high resolution imagery. ISPRS Journal of Photogrammetry and Remote Sensing. 96, pp. 67-75.
Drăgut, L., Tiede, D., Levick, S. R., 2010. ESP: a tool to estimate scale parameter for multiresolution image segmentation of remotely sensed data. International Journal of Geographical Information Science, 24(6), pp.859-871.
Drăgut, L., Eisank, C., Strasser, T., 2011. Local variance for multi-scale analysis in geomorphometry. Geomorphology. 130, pp.162-172.
Drăgut, L., Csillik, O., Eisank, C., Tiede, D., 2014. Automated parameterisation for multi-scale image segmentation on multiple layers. ISPRS Journal of Photogrammetry and Remote Sensing. 88, pp. 119-127.
Definiens 2008. eCognition Developer 7.0 User Guide. Definiens AG, Munich, Germany.
Espindola, G.M., Camara, G., Reis, I.A., Bins, L.S., Monteiro, A.M., 2006. Parameter selection for region‐ growing image segmentation algorithms using spatial autocorrelation. International Journal of Remote Sensing, 27(14), pp. 3035-3040.
Hofmann, P., Strobl, J., Blaschke, T., Kux, H., 2008. Detecting informal settlements from QuickBird data in Rio de Janeiro using an object-based approach. In: T Blaschke, S. Lang, and G.J. Hay, (Eds.), Object-based image analysis concepts for knowledge driven remote sensing applications. Springer, pp. 531-554.
Johnson, B. and Xie, Z., 2011. Unsupervised image segmentation evaluation and refinement using a multi-scale approach. ISPRS Journal of Photogrammetry and Remote Sensing, 66, pp.473-483.
Gao, Y., Mas, J.F., Kerle, N., Navarrete Pacheco, J.A., 2011. Optimal region growing segmentation and its effect on classification accuracy. International Journal of Remote Sensing, 32(13), pp.3747-3763.
Kavzoglu, T. and Yildiz, M., 2014. Parameter-based performance analysis of object-based image analysis using aerial and Quikbird-2 images. In: ISPRS Annals of Photogrammetry, Remote Sensing and Spatia l Information Sciences, II-7, pp.31-37.
Kavzoglu, T., Colkesen, I., Yomralioglu, T., 2015. Object Based Classification with Rotation Forest Ensemble Learning Algorithm Using Very High Resolution WorldView-2 Image. Remote Sensing Letters, 6(11), pp. 834-843.
Kim, M., Madden, M., Warner, T., 2009. Forest type mapping using object-specific texture measures from multispectral Ikonos imagery: segmentation quality and image classification issues. Photogrammetric Engineering & Remote Sensing, 75(7), pp.819-829.
Kim, M., Warner, T. A., Madden, M., Atkinson, D. S., 2011. Multi-scale GEOBIA with very high spatial resolution digital aerial imagery: scale, texture and image objects. International Journal of Remote Sensing, 32(10), pp.2825-2850.
Marpu, P. R., Neubert, M., Herold, H., Niemeyer, I., 2010. Enhanced evaluation of image segmentation results. Journal of Spatial Science, 55(1), pp.55-68.
Myint, S.W., Gober, P., Brazel, A., Grossman-Clarke, S., Weng, Q., 2011. Per-pixel vs. object-based classification of urban land cover extraction using high spatial resolution imagery. Remote Sensing Environment, 115, pp.1145-1161.
Tzotsos, A., Karantzalos, K., Argialas, D., 2011. Object-based image analysis through nonlinear scale-space filtering. ISPRS Journal of Photogrammetry and Remote Sensing, 66(1), pp. 2-16.
Witharana, C. and Civco, D. L., 2014. Optimizing multi-resolution segmentation scale using empirical methods: Exploring the sensitivity of the supervised discrepancy measure Euclidean distance 2 (ED2). ISPRS Journal of Photogrammetry and Remote Sensing. 87, pp. 108-121.