DEVELOPMENT AND EVALUATION OF SIMPLE MEASUREMENT SYSTEM USING
THE OBLIQUE PHOTO AND DEM
H. Nonaka, H. Sasaki, S. Fujimaki, S. Naruke, H. Kishimoto
Asia Air Survey Co., Ltd., Kawasaki, Japan - (hdk.nonaka, hss.sasaki, sig.fujimaki, sin.naruke, hrs.kishimoto)@ajiko.co.jp
Commission V, WG V/3
KEY WORDS: Photogrammetry, Measurement, DEM, Orientation, System Development
ABSTRACT:
When a disaster occurs, we must grasp and evaluate its damage as soon as possible. Then we try to estimate them from some kind of photographs, such as surveillance camera imagery, satellite imagery, photographs taken from a helicopter and so on. Especially in initial stage, estimation of decent damage situation for a short time is more important than investigation of damage situation for a long time.
One of the source of damage situation is the image taken by surveillance camera, satellite sensor and helicopter. If we can measure any targets in these imagery, we can estimate a length of a lava flow, a reach of a cinder and a sediment volume in volcanic eruption or landslide.
Therefore in order to measure various information for a short time, we developed a simplified measurement system which uses these photographs. This system requires DEM in addition to photographs, but it is possible to use previously acquired DEM. To measure an object, we require only two steps. One is the determination of the position and the posture in which the photograph is shot. We determine these parameters using DEM. The other step is the measurement of an object in photograph.
In this paper, we describe this system and show the experimental results to evaluate this system. In this experiment we measured the top of Mt. Usu by using two measurement method of this system. Then we can measure it about one hour and the difference between the measurement results and the airborne LiDAR data are less than 10 meter.
1. INTRODUCTION
When a disaster occurs, we must grasp and evaluate its damage as soon as possible. Then we try to estimate them from some kind of photographs, such as surveillance camera imagery, satellite imagery, photographs taken from a helicopter and so on. Especially in initial stage, estimation of decent damage situation for a short time is more important than investigation of damage situation for a long time.
One of the source of damage situation is the image taken by surveillance camera, satellite sensor and helicopter. If we can measure any targets in these imagery, we can estimate a length of a lava flow, a reach of a cinder and a sediment volume in volcanic eruption or landslide.
Therefore in order to measure various information for a short time, we developed a simplified measurement system which uses these photographs. This system requires DEM in addition to photographs, but it is possible to use previously acquired DEM. To measure an object, we require only two steps. One is the determination of the position and the posture in which the photograph is shot. We determine these parameters using DEM. The other step is the measurement of an object in photograph. In this paper, we describe about this system, and evaluate this system by measuring the top of Mt. Usu.
2. SYSTEM CONSTRUCTION
2.1 System Overview
The aim of this system is to measure the three dimensional coordinates of some phenomena in the photograph, such as lava flow, cinder of a volcanic eruption and landslide dam. The
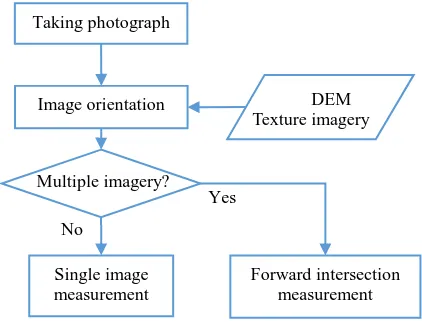
processing flow of this system is shown in figure.1. At first we take the photograph of the measurement target using a digital camera, surveillance camera and so on. In the next step, we get the position, posture and angle of view of which this photograph were taken. We call these values orientation parameter. In this step, we use DEM and texture imagery such as aerial imagery, satellite imagery and topographical map. In the last step, we measure the objects in the photograph by using single image measurement method or forward intersection measurement method.
Figure 1. Processing flow of this system
As mentioned above, we use DEM and texture imagery to determine the orientation parameter. So this system require
Taking photograph
Image orientation
Multiple imagery?
Single image measurement
Forward intersection measurement Yes
No
DEM Texture imagery The International Archives of the Photogrammetry, Remote Sensing and Spatial Information Sciences, Volume XLI-B5, 2016
XXIII ISPRS Congress, 12–19 July 2016, Prague, Czech Republic
This contribution has been peer-reviewed.
these data. But we can use the DEM and texture imagery acquired before a disaster occurred. We can use aerial photograph or terrain visualization imagery. For example, there are elevation map, altitude tints map or Red Relief Image Map (RRIM). The suitable texture image will be determined by which the photograph is urban area or mountain area. When the target of the photograph is urban area, aerial photograph is better. On the other hand, when the target is the mountain area, a terrain visualization image is better, because in these area, we use the terrain, such as ridges and valleys, as the guide to perform image orientation. In this paper, we used the RRIM as texture image, because RRIM (Fujii et.al, 2012) can show the terrain characteristics clearly.
2.2 Single Image Measurement
By using Single image measurement method, we can measure the three-dimensional coordinate value from only one image. This process is following.
(1) Make the same view as the image on the display by using three-dimensional terrain viewer given its orientation parameter.
(2) Designate the position of the target on the image, and get its image coordinate value.
(3) Get the depth length of the designated position from the depth buffer (z-buffer) of the three-dimensional terrain viewer.
(4) Calculate the three-dimensional coordinate value of the target from its image coordinate value and orientation parameter.
The benefit of single image measurement method is that this method require only one image. Especially when we measure a target from surveillance camera, a target is often taken of an image with only one camera. So in this case, this method is very useful.
On the other hand, depth length of the image is calculated by using DEM, so the position on which the terrain is changed cannot be measured. In this case, we must measure the target indirectly. For example, in order to measure the height of landslide dam, we measure the position where sediment deposit touch the terrain which is not changed. The measurement process of this method is follows.
2.3 Forward Intersection Measurement
In forward intersection measurement method, we designate the target position on two imagery in order to calculate its three-dimensional coordinate. If the target is taken of three or more imagery, the other imagery which are not used for measurement can be used in order to evaluate of measurement result.
(1) Select one image as [Image A] which will be used to measure the target.
(2) Designate the position of the target on [Image A]. And calculate the line of sight from the taking position of [Image A] to the target from the image coordinate of the target and orientation parameter of [Image A].
(3) Display the line of sight on the other imagery. And select the image on which the line of sight is closest from the target as [Image B] which will be used to measure the target. If any lines of sight are far from the target, return to step (1) and select other image as [Image A].
(4) Designate the position of the target on [Image B]. And calculate the line of sight from the taking position of [Image B] to the target from the image coordinate of the target and orientation parameter of [Image B].
(5) Calculate the three-dimensional coordinate of the middle point between the closest points of these lines of sight. This coordinate is the coordinate of the target.
The benefit of forward intersection measurement method is that terrain change does not influence the result of this method, and any target can be measured even if it is in air. So we can measure the flying cinder, volcanic plume, sediment deposit and so on.
3. EXPERIMENT AND EVALUATION
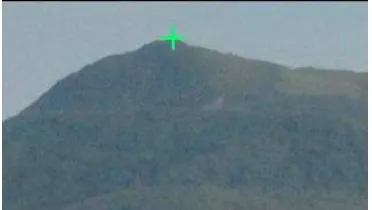
In order to evaluate this system, we take photographs of Mt. Usu from some point around Toya lake, and measure the top of this mountain. Mt. Usu has some protrusions of exposed rock, this altitude is 733m. We measure the top of this protrusion (figure 2).
Figure 2. The top of Mt. Usu (measurement target)
3.1 Experimental Site and Imagery
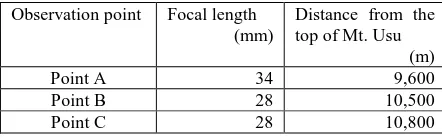
The photographs of Mt. Usu are taken by using Nikon D700 to which is attached zoom lens 28-300mm. The camera is connected with GPS unit and append the position to each imagery. In this paper, we select the three photographs from photographs which taken of Mt. Usu. These three photographs are taken from the observation point A, B and C. In this paper, we call these photographs as ImageA, ImageB and ImageC. These points are shown in figure 3 and the focal length and the length from the top of Mt. Usu to the observation points are shown in table 1.
Observation point Focal length (mm)
Distance from the top of Mt. Usu
(m)
Point A 34 9,600
Point B 28 10,500
Point C 28 10,800
Table 1. Focal length and distance of photographs
To perform image orientation, we use 1m mesh DEM which extracted from airborne LiDAR around Mt. Usu, and 10m mesh DEM published from GSI as NSDI outside of the range of The International Archives of the Photogrammetry, Remote Sensing and Spatial Information Sciences, Volume XLI-B5, 2016
XXIII ISPRS Congress, 12–19 July 2016, Prague, Czech Republic
This contribution has been peer-reviewed.
airborne LiDAR survey as DEM. And we use the RRIM which generated from these DEM data as texture image.
Observation point A
Observation point C Observation point B
Mt. Usu
Figure 3. Observation points and Mt. Usu
Figure 4. DEM and RRIM
3.2 Image Orientation
Image orientation is performed on the window figure 5. On this window, the photograph which is performed image orientation is displayed in left area, and the view of three-dimensional terrain viewer in right area. In this step, we adjust the view position, view posture, view angle and so on in order to generate same view on the terrain viewer. When we judge whether terrain viewer make the same view as the photograph, this system overlay this view on the photograph and make this view transparent.
In this experiment, we use the position and altitude which is stored in each image (in EXIF tag) as these position, and did not adjust position, and calculate view angle from each focal length. That is, we adjusted only posture information.
Figure 5 show the result of image orientation of ImageA. We perform the image orientation to ImageB and ImageC. In this step, we require from 5 to 15 minutes to perform the image orientation of one image.
Figure 5. Image orientation
3.3 Result of Single Image Measurement
In this step, we measure the top of Mt. Usu by using single image measurement method. To measure the target, we use ImageA, ImageB and ImageC, these imagery are performed image orientation.
To measure the target, we only designate the target on image. Figure6 show the result of single image measurement. Table2 show the measured altitude value and difference from altitude of the target.
The difference of ImageB and ImageC are about 10m, but difference of ImageA is over 30m. This result caused from accuracy of image orientation.
Figure 6. Measurement result of ImageB
Observation point Altitude
(m)
Difference from altitude of top
(m)
Point A 703 -30
Point B 724 -9
Point C 724.5 -8.5
Table2. Result of single image measurement
3.4 Result of Forward Intersection Measurement
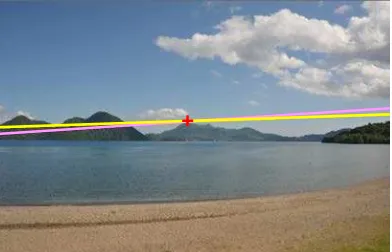
To evaluate the forward intersection measurement, we use the ImageA and ImageC. We designate the target position on these image. This positions are shown Figure7 and Figure8 as cross mark. In these figure, the lines of sight are shown on the other image. According to the result of this measurement, the altitude of the top of Mt. Usu is 735m, and the difference of the altitude of Mt. Usu is +2m.
Next we evaluate the result by using ImageB. Two lines of sight are shown on ImageB (Figure9). Measurement point is around The International Archives of the Photogrammetry, Remote Sensing and Spatial Information Sciences, Volume XLI-B5, 2016
XXIII ISPRS Congress, 12–19 July 2016, Prague, Czech Republic
This contribution has been peer-reviewed.
the cross point of these lines. If this point is close from the target, it can be said it is dependable.
At last, we evaluate the horizontal position of measured points. This point are shown in Figure10 and Figure11. This result shows two dimensional length of these points is very close.
Figure 7. ImageA and measurement result
Figure 8. ImageC and measurement result
Figure 9. Evaluation of measurement result on ImageB
Observation point A
Observation point C
Target point
Figure 10. Measurement result (Horizontal position)
Measurement result
Target position
Figure 11. Measurement result (Detail)
4. CONCLUSION
In this paper, we describe the system in which orientation parameter of an image is determined by using DEM, and evaluate this system through measuring the top of Mt. Usu. The benefits of this system is that we can measure any target on an imagery in short time.
To measure a target, we require about from 5 to 15 minutes for each image as image orientation time. In this evaluation, we can finish all measurement process about in 1 hour. This system is useful to get the preliminary value when a disaster occurs. This system has two measurement method. One is single image measurement method. In this method, the measurement target is limited, but it is require only one image.
The other method is forward intersection measurement method. In this method, we can measure any targets even if it is in air. And if the target are taken of three or more photographs, we can evaluate the accuracy of the measurement result.
On the other hand, this system is dependent on user’s subjectivity, so measurement results are varies.
In our future tasks, there is a ensuring the accuracy of image orientation and supressing the difference of measurement results.
REFERENCES
N. Fujii, K. Saito, T. Chiba, I. Sata, T. Yoshinaga, K. Tasaki, THE NEW THREE-DIMENSIONAL VISUALIZATION METHOD OF HERITAGE SITES BY LIDAR DATA, Int. Arch. Photogramm. Remote Sens. Spatial Inf. Sci., XXXIX-B5, 87-92, doi:10.5194/isprsarchives-XXXIX-B5-87-2012, 2012. The International Archives of the Photogrammetry, Remote Sensing and Spatial Information Sciences, Volume XLI-B5, 2016
XXIII ISPRS Congress, 12–19 July 2016, Prague, Czech Republic
This contribution has been peer-reviewed.