SMART AERONAUTICAL CHART MANAGEMENT SYSTEM DESIGN
M. E. Pakdila,b, R. N. Celika, Ö. Kayab, Y. C. Konak a,b, C. Guney a
a ITU, Civil Engineering Faculty, 80626 Maslak Istanbul, Turkey - (pakdilme, celikn, konak, guneycan)@itu.edu.tr b Pegasus Airlines, AEROPARK, Osmanli Bulvari No:11/A, 34912 Pendik Istanbul, Turkey – (mete.pakdil, omer.kaya,
celil.konak)@flypgs.com
KEY WORDS: Aeronautical, GIS, AIP, AIXM, ARINC, Chart Production, Annex 4, Annex 15
ABSTRACT:
Civil aviation is developing rapidly, and the number of domestic and international operations is increasing exponentially eve ry year than the previous one. Airline companies with increased air traffic and the number of passengers increase the demand of new aircrafts. An aircraft needs not only fuel but also pilot and aeronautical information (charts, digital navigation information, flight plan, and etc.) to perform flight operation. One of the most important components in aeronautical information is the terminal chart. Authorized institution in every state is responsible to publish their terminal charts for certain periods. Although these charts are produced in accordance with ICAO’s Annex 4 and Annex 15, cartographic representation and page layout differs in each state’s publication. This situation makes difficult to read them by pilots. In this paper, standard instrument departure (SID) charts are analysed to produce by use of cutting-edge and competitive technologies instead of classical computer-aided drawing and vector based graphic applications that are currently used by main chart producers. The goal is to design efficient and commercial chart management system that is able to produce aeronautical charts with same cartographic representation for all states.
1. INTRODUCTION
In Middle East, Asia and Europe, in spite of the recession in the economy, aircraft orders through a newly established and developing airline companies' continues to increase. Moreover, large commercial aircraft manufacturers such as Airbus and Boeing allocate majority of their budgets to research and development projects for competition. Aircraft manufacturers are giving priority to research and development projects for fuel economy since fuel costs are largest outgoing in air transportation but an aircraft needs not only fuel but also aeronautical information (aeronautical charts, digital navigation information, flight plan, and etc.) to complete a flight. Authorized institution in every state is responsible to publish their terminal charts for certain periods. There are few companies that collect every state’s aeronautical charts to reproduce them in a standard page layout and cartographic representation to make readable and accessible for pilots. There are two dominant players in the market, these are; Jeppesen (United States of America) and Lufthansa System (Germany) (Pakdil, 2014). These companies set rules for the competition. The number of aircrafts and aerodromes are increasing day by day. Aeronautical information charges airlines per aircraft and aerodromes in operation, the cost of this information is increasing dramatically every year, and airlines are becoming more dependent to these companies.
In this study, the standard instrument departure (SID) chart, one of the instrument flight route (IFR) chart types, is analyzed to produce by use of cutting-edge and competitive technologies instead of classical computer-aided drawing and vector based graphic applications. A system with all components is designed to produce aeronautical charts at a low cost in an efficient way.
The remainder of this paper is organized as follows: Section 2 presents data sources of the system with data standards; Section 3 describes aeronautical charts; Section 4 specifies system components.
2. DATA SOURCES
Every state authorizes an institution to produce, publish and distribute the AIP (Aeronautical Information Publication) that contains many aeronautical charts and their related information such as navigation aids, waypoints, aerodromes, and communication information (Pakdil, et al., 2014). Eurocontrol has published a specification for an electronic AIP (eAIP). This specification aims to produce AIPs in digital format for easy distribution and storage. Therefore, an electronic AIP is a digital version of the paper AIP, usually available in PDF format.
Eurocontrol established European AIS Database (EAD) that is the world’s largest Aeronautical Information System (AIS), a centralized database of aeronautical information (Eurocontrol, 2014). The EAD currently has 41 fully integrated member states that are distribute their AIPs as electronic format on this system (Figure 1) (Huges, 2012).
Figure 1. Eurocontrol EAD members ISPRS Annals of the Photogrammetry, Remote Sensing and Spatial Information Sciences, Volume II-2/W2, 2015
The EAD system has two types of clients; data provider and data user. Data users are able to download from information is uploaded by data providers throughout the system. The EAD is also hosting data repository that is based on Aeronautical Information Exchange Model (AIXM).
2.1 Data Standards
2.1.1 Aeronautical Information Exchange Model (AIXM)
FAA (Federal Aviation Administration) and Eurocontrol are developed AIXM (Aeronautical Information Exchange Model) using XML structure and other standards like ARINC 424. It models the important aeronautical features, properties (attributes and associations) and business rules that make up aeronautical information. As such, it can be used as the basis for the design of a database and provides technical and semantic interoperability.
The AIXM represents real world based on theoretical construct which can be represented and understood by automated systems. Furthermore, it provides a basis for logical data structures used during software implementation. Importantly, it is standardized aeronautical data by all actors in aviation industry. Although the AIXM is large and complex, it is only used in automated processes to make sure that diverse systems can communicate correctly. The model is never be used directly by pilots, AIS staff or other humans. It can be used in; automated production of AIP, automated aeronautical chart creation and publication systems, and etc. The model is designed using the Unified Modelling Language (UML). Thus it is easily converted to any object oriented programming language or used in database modeling without extra efforts.
2.1.2 ARINC 424
Aeronautical charts in AIP are represented in AIXM as terminal procedures. Terminal procedures are described in the schema based on the ARINC 424 specification. The ARINC 424 is an aeronautical specification developed and maintained by the aviation industry which has been used for the exchange of navigation and communication data between avionic system manufacturers. One of the major chapters of the specification is dedicated to deals with the encoding of terminal procedures (SID, STAR, Approaches).
The ARINC 424 defines in particular the concept of Path & Terminators (P&T). P&T encodes a chart’s flight trajectories as sequenced procedure legs in order to represent a complete procedure. To learn encoding standard and its business rules need to take special training by designated training centers. The last version of specification (version 20) was released in December 2011. The specification is maintained by the A424 committee which groups the major aeronautical actors.
3. AERONAUTICAL CHARTS
Terminal charts make possible pilots guide their aircraft in the terminal area. Terminal charts not only provide the two dimensional information, but also often portray three dimensional air traffic service systems. Terminal charts are published in AIP format that is defined by both ICAO Annex 4 and Annex 15 standards. Annex 4 describes contents, symbology for aeronautical charts. During the instrument flights, pilots are benefits from aerodrome, standard instrument departure,
en-route, standard arrival, instrument approach charts with supplementary charts.
3.1 Aerodrome Chart
Aerodrome chart provides information of the terminal area such as taxiways, natural objects, buildings, tower, and radio navigation aids. It is drawn at an optimal scale selected to show all information.
3.2 Standard Instrument Departure (SID) Chart
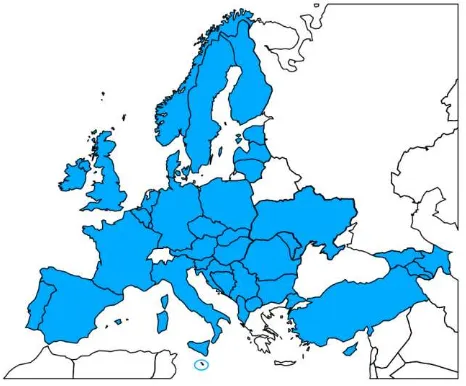
Standard Departure Chart guides pilots from take-off to en-route phase of the flight (Lankford, 2002). It is drawn at an optimal scale selected to show all information. A conformal projection is used (Figure 2) (Annex 4, 2009).
Figure 2. An example of SID chart
3.3 En-Route Chart
En-route chart depicts the air traffic service system, radio navigation aids and other aeronautical information important to en-route phase (Annex 4, 2009). It should be easy-to-use in a cockpit that has limited space.
3.4 Standard Arrival (STAR) Chart
Standard arrival (STAR) chart shows flight procedure from the end of en-route to initial point of the approach procedure. The ISPRS Annals of the Photogrammetry, Remote Sensing and Spatial Information Sciences, Volume II-2/W2, 2015
main purpose is to decrease both pilot’s and controller’s work load.
3.5 Instrument Approach Chart
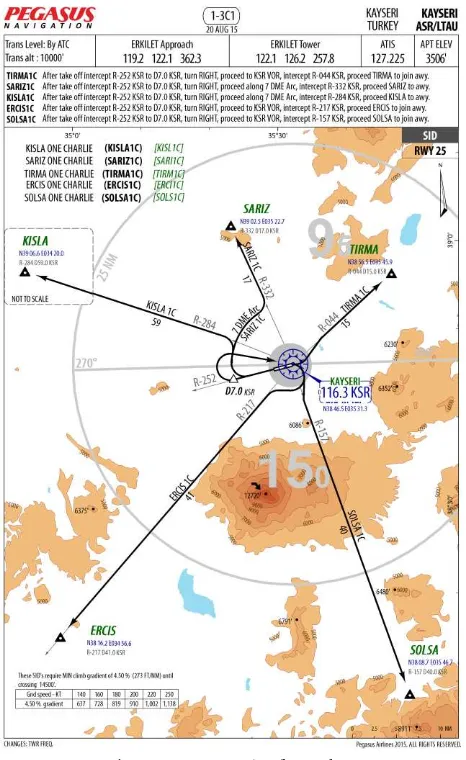
It is used after the arrival chart to land aircraft on the runway. The main distinguishing feature of this type is the profile is having the profile view shows vertical portrait of the procedure (Figure 3).
Figure 3. An example of Instrument Approach Chart
4. CHART PRODUCTION SYSTEM
The system lies on four main components; data management, cartographic production, workflow management, and distribution.
4.1 Data Management
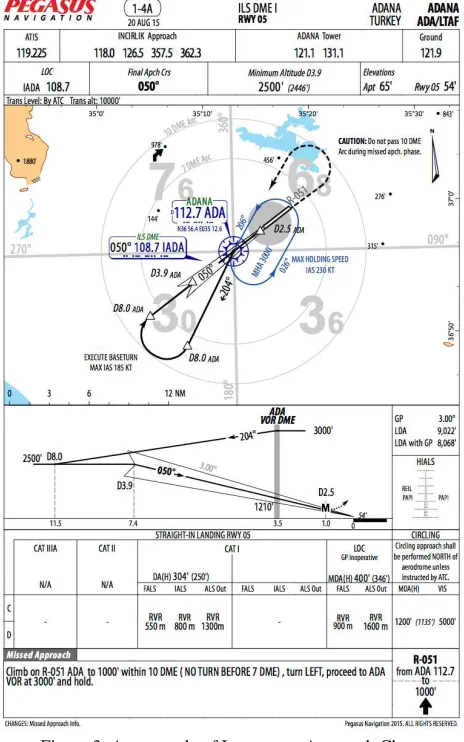
The primary source is the AIXM formatted data that is obtained from Eurocontrol EAD system based on Aeronautical Information Regulation and Control (AIRAC) cycles. Each single AIRAC cycle represents interval of 28 days (Annex 15, 2010). Every feature in an AIXM data has an effective date. The database is designed based on AIXM 4.5 model, so the designed database model is capable to store different versions of an feature that are effective for a certain time (Figure 4). A web based multiuser data management software was developed for manual data editing. In case of missing or invalid data is detected by validation procedures, an authorized user can edit via this web
based software (Figure 5). Not only AIXM data, but also e-AIPs from states not a member of EAD system are analysed and populated into database. Some feature types have spatial information, so the database can also handle spatial features. When the data is validated, it is transferred to a separate database for the cartographic production. The cartographic production database is also based on AIXM 4.5 model, but it also plays a role to store cartographic representation rules, symbologies, and chart layouts.
Figure 4. Components of the data management software
Figure 5. A screenshot from web based data management software
4.2 Cartographic Production
A geographic information system (GIS) software is used for production, data exchange between applications, aeronautical chart layout design, and cartographic representation. ESRI’s (Environmental Systems Research Institute, USA) ArcGIS for Aviation is selected to use in cartographic production, and is a solution that combines different ESRI products for aviation market. It is delivered with an Extract-Transform-Load (ETL) software from FME company. The ETL software plays a role between systems to exchange data in different types of format and environment (Figure 6). In addition to the solution, ArcGIS itself is a platform that enables to develop new add-ins and provide wide customization options to design it for a specific purpose. ArcGIS for Aviation works with a special database model based on AIXM 5.1 & 4.5 with some additions for product specific requirements (Brunk, B. K. and Porosnicu, E., 2005).
The cartographic representation rules are programmed to standardize and accelerate production and stored into the ArcGIS for Aviation database. All rules are defined with collaboration of Pegasus Airlines’ selected pilots and submitted feedbacks through the mobile application. Outputs are designed and ISPRS Annals of the Photogrammetry, Remote Sensing and Spatial Information Sciences, Volume II-2/W2, 2015
optimized only for digital distribution and presentation on mobile devices.
Figure 6. Data flow between data management software and GIS software
At the end of the production, products are imported into workflow management software for review and distribution steps.
4.3 Workflow Management
Aeronautical chart production process is designed to consist of three steps. These are respectively; procedure encoding, cartographic production, and review (Figure 7).
Figure 7. Production steps and transitions
Workflow management software is a multiuser application, and every user has a role that defines which process is allowed to assign (Figure 8). For instance, a user has the procedure encoder role can only assign to the procedure encoding step. When the procedure encoder complete assigned task, the process automatically is proceeded to next step that is the cartographic production. Moreover, transitions between steps are two-way.
Figure 8. A screenshot from the work flow management software
4.4 Distribution
To distribute products to users, a Windows RT based mobile application was developed (Figure 9). The main factor of choosing Windows RT platform is the mobile device that is selected by the Pegasus Airlines. Although there were many mobile device options in the market, only iPad (by Apple) and Toughpad FZ-G1 (by Panasonic) had got required certificates for cockpit usage in that time (Pakdil et al., 2014). Touch enabled mobile application provides following features;
Pan, Zoom In, and Zoom Out Rotate
Brightness Control Night Mode Bookmarks
Figure 9. A screenshot inside the mobile application
5. CONCLUSIONS
In this study, different hardware, software, and methodologies are tested and applied. Most difficult part is to have accurate data since the data sources do not always provide accuracy. Thus, many spatial and non-spatial validation rules were developed. Another challenge is choosing best cartographic representation rule for users who are pilots. Expectations of pilots should be analysed very well before take an action for any kind of cartographic representation rule. It was big opportunity that Pegasus Airlines’ pilots were accessible easily during the development and production. Their feedbacks played important role for the decision making.
This study’s scope will be enlarged to all types of IFR charts. However, each chart production lasts one hour averagely. It may be shortened with new improvements. To decrease costs, commercial applications may be replaced with open source alternatives. These issues are the future works of this study.
6. ACKNOWLEDGEMENTS
This study was supported by: (i) the Ministry of Science, Industry and Technology (ii) Istanbul Technical University, (iii) Pegasus Airlines. Therefore, authors acknowledge to all these institutions and companies.
7. REFERENCES
Annex 4 (2009). Aeronautical Charts, International Civil Aviation Organization.
Annex 15 (2010). Aeronautical Information Services, International Civil Aviation Organization.
AIXM 4.5 XML Schema. (t.y.). Eurocontrol. 04.05.2014, Retrieved from https://db.tt/217ch8jv
ARINC Specification 424-19 (2008). Navigation System Data Base, Aeronautical Radio, Inc.
Brunk, B. K. and Porosnicu, E. (2005). Aeronautical Information Exchange Model (AIXM) GIS interoperability through GML, 25th Annual Esri International User Conference, San Diego, California, USA, 25th-29th July.
Eurcontrol. (2014). The European AIS Database. Retrieved from https://www.eurocontrol.int/articles/european-ais-database-ead
Hughes, D. (2012). EAD Overview, AIXM 5.1 Seminar, Brussel, Belgium, 4th -5th December.
Lankford, T. T. (2002). Using Aeronautical Charts, McGraw-Hill.
Pakdil M. E., Kaya Ö., Çelik R. N. (2014). Pegasus Havayolları Uçuş Haritası Yönetim Sisteminde ArcGIS'in Rolü, Invited Speaker, 19. ESRI User Conference 2014, 22nd - 23th October 2014, METU Congress Center, Ankara, Turkey
Pakdil M. E., Kaya Ö., Çelik R. N. (2014). Smart Flight Chart Management System, Invited Speaker, INTERGEO EURASIA 2014 Congress, 28th - 29th April 2014, WOW Congress Center, Istanbul, Turkey
Pakdil E. M. (2014). Smart Aeronautical Chart Management System Design: 1st Phase Departure Chart Production, Master Thesis Library, Istanbul Technical University.