A NOVEL IHS-GA FUSION METHOD BASED ON ENHANCEMENT VEGETATED
AREA
S. Niazi a,* , M. Mokhtarzade b, F. Saeedzadehc
a Faculty of Geodesy and Geomatics Engineering, K. N. Toosi University of Technology, Valiasr street, Tehran, Iran-([email protected])
b Faculty of Geodesy and Geomatics Engineering, K. N. Toosi University of Technology, Valiasr street, Tehran, Iran-([email protected])
a Faculty of Geodesy and Geomatics Engineering, K. N. Toosi University of Technology, Valiasr street, Tehran, Iran-([email protected])
KEY WORDS: Pan sharpening, IHS-GA method, Enhance Vegetated area
ABSTRACT
Pan sharpening methods aim to produce a more informative image containing the positive aspects of both source images. However, the pan sharpening process usually introduces some spectral and spatial distortions in the resulting fused image. The amount of these distortions varies highly depending on the pan sharpening technique as well as the type of data. Among the existing pan sharpening methods, the Intensity-Hue-Saturation (IHS) technique is the most widely used for its efficiency and high spatial resolution. When the IHS method is used for IKONOS or QuickBird imagery, there is a significant color distortion which is mainly due to the wavelengths range of the panchromatic image. Regarding the fact that in the green vegetated regions panchromatic gray values are much larger than the gray values of intensity image. A novel method is proposed which spatially adjusts the intensity image in vegetated areas. To do sothe normalized difference vegetation index (NDVI) is used to identify vegetation areas where the green band is enhanced according to the red and NIR bands. In this way an intensity image is obtained in which the gray values are comparable to the panchromatic image. Beside the genetic optimization algorithm is used to find the optimum weight parameters in order to gain the best intensity image. Visual and statistical analysis proved the efficiency of the proposed method as it significantly improved the fusion quality in comparison to conventional IHS technique. The accuracy of the proposed pan sharpening technique was also evaluated in terms of different spatial and spectral metrics. In this study, 7 metrics (Correlation Coefficient, ERGAS, RASE, RMSE, SAM, SID and Spatial Coefficient) have been used in order to determine the quality of the pan-sharpened images. Experiments were conducted on two different data sets obtained by two different imaging sensors, IKONOS and QuickBird. The result of this showed that the evaluation metrics are more promising for our fused image in comparison to other pan sharpening methods.
1. INTRODUCTION
Most of the newest remote sensing systems, such as Landsat8, SPOT, IKONOS, QuickBird, EO-1 and ALOS provide sensors with one high spatial resolution panchromatic (PAN) and several multispectral (MS) bands simultaneously. Meanwhile, an increasing number of applications (e.g. feature detection, change monitoring, land cover classification, etc.) often demandthe use of images with both high spatial and high spectralresolution. As a result, the fusion of high resolution PAN image and low resolution multi-spectral images hasbecome a powerful solution and many pan-sharpening methodshave been proposed over the last two decades (Pohl et al. 1998, Lau et al. 2000, Wang et al. 2005).
The pan-sharpening of low resolution multispectral (MS) and high resolution panchromatic (PAN) satellite images is a very important concern for numerous remote sensing applications such as classification, segmentation, and object detection. An effective pan-sharpening technique is a useful tool not only for increasing the interpretability of human observers but also for improving the accuracy of image analysis such as feature extraction, modeling and classification (Yang et al. 2012). The general idea behind image sharpening is to preserve the spectral values of the MS image in the pan-sharpened image and to improve the spatial resolution simultaneously (Konus and Ehlers. 2007). Different algorithms may lead to different pan sharpening qualities (Zhang. 2004).
Corresponding author
*
To date, various algorithms for image pan-sharpening have been developed in order to combine the spatial information of high resolution PAN image with the spectral information of a lower resolution MS image to produce high resolution MS image (Alparone et al. 2007). In the remote sensing community, probably the most popular pan sharpening methods are the Intensity-Hue-Saturation (IHS)(Schetsellar. 1998, Choi et al. 2000, Choi. 2006, Myungjin. 2006), the Principal Component Analysis (PCA) (Chavez Sarp and Kwarteng. 1989, Shettigara. 1992, Vrabel et al. 1996, Shah. 2008, Yang and Gong. 2012), the Brovey transform (Earth Resource Mapping Pty Ltd. 1990, Chaves. 1991, Du et al. 2007, Bovolo et al. 2010) and Wavelet-based image fusion(Otazu et al. 2005, Zhang. 2004).
IHS based methods are among the most common fusion methods due to their simple computation, high spatial resolution and efficiency. Many modifications have been proposed to enhance its spectral quality. These pan-sharpening techniques are performed on the pixel level because of the minimum information loss during the sharpening process, so the digital classification accuracy of the pixel level fusion is the highest (Zhang. 2008).
sharpening method to address this issue. In order to evaluate the spectral and spatial quality of the proposed method, several metrics were computed, such as ERGAS (L. Wald. 2000), SAM (Goetz et al. 1992), SID (Chang et al. 1999), RASE (Ranchin et al. 2000), Correlation Coefficients (Chavez et al. 1989), RMSE and spatial.
2. IHS Pan-Sharpening Technique
IHS (Intensity-Hue-Saturation) (Carper et al. 1990, Tu et al. 2004), probably is the most common image fusion technique for remote sensing applications and is used in many commercial pan-sharpening softwares. This method converts a color image from RGB space to the IHS color space. In next step the I (intensity) band is replaced by the panchromatic image. Before fusing the images, a histogram matching is performed on the multispectral and the panchromatic image. The MS image is then converted to IHS color space using the following linear transformation (Palsson et al. 2012): process in the next step is to scale the Pan image so that it has the same mean and variance as the intensity component (Palsson et al, 2012):
Where σ and µ are the standard deviation and mean, respectively. The intensity component is then replaced with the appropriately scaled Pan Image and finally the inverse IHS transformation is taken to get the fused image. This process is equivalent to (Palsson et al. 2012): efficient and is called the Fast IHS technique (FIHS) (Tu et al. 2001), making IHS ideal for the large volumes imageries produced by satellite sensors.
Ideally the fused image produced by Fast IHS would have a higher spatial resolution and sharper edges than the original color image. At the same time it is desired to have no distributed spectral content in the fused image. However, because the panchromatic image was not created from the same wavelengths of light as the RGB image, this technique produces a fused image with some color distortions (Choi. 2008). This problem becomes worse with higher difference between the intensity band and panchromatic image. Various modifications are proposed to the IHS method to address these problems.
One of the first modifications of the IHS method extends the IHS method from three bands to four by incorporating an infrared
component (Tu et al. 2005). Regarding the fact that the panchromatic sensors pick up infrared light (IR) in addition to visible wavelengths, this modification caused the intensity image to be better matched with the panchromatic image. To address this issue, researchers have extended this method for other
multispectral images by using
i =1/N where N is the number of bands (Zhang et al. 2004; Choi et al. 2006).A similar modification of IHS, called the ‘Fast Intensity -Hue-Saturation fusion technique with Spectral Adjustment’ (FIHS-SA) method, incorporates four bands with weighting coefficients on the green and blue bands to minimize the difference between intensity and the panchromatic images. These weighting coefficients were calculated experimentally a fuse IKONOS images (Tu et al. 2005). In 2008 Choi expanded this work and experimentally determined the coefficients for the red and infrared bands for IKONOS images (Choi. 2008). The green and blue band coefficients were taken from the 2005 paper by Tu. Since these coefficients were calculated using IKONOS data, these parameters are not ideal for fusing QuickBird images (Tu et al. 2005).
3. Methodology
In this section a new method is developed for the sake of spatial and spectral distortion reduction in the IHS fusion technique. In the proposed method, the optimum weight parameters of equation (5), are found via Genetic Algorithms. The optimized weight parameters are then used to produce the intensity image.
1 2 3 4
I
R
G
B
NIR
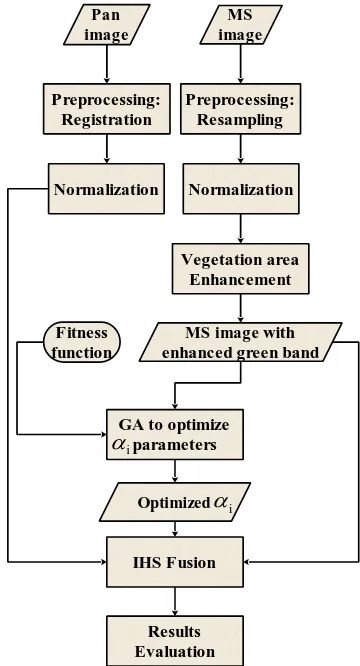
(5)As shown in Figure 1, the inputs of the proposed Genetic Algorithm are MS and Pan Images. To this goal some preprocessing are necessary. The MS image was resampled to the PAN image pixel size by nearest neighbor method and then two images were registered by the ENVI4.8 software. After normalization, the process of the weight parameters computation was started by the Genetic Algorithm. After finishing Genetic Algorithm the PAN and Enhanced MS images were fused by the optimum weight parameters in the IHS method.
According to Figure 1, this method has two main steps which are: 1) production of a new Green band (enhanced green band), 2) Genetic algorithm for estimating the weight parameters.
Step 1 .Traditional IHS fusion method suffers from color distortion when dealing with IKONOS or QuickBird images. NDVI (normalized difference vegetation index) is the most common vegetation index that is computed from the NIR and measurements acquired in the near-infrared and red bands, respectively. NDVI varies between -1 and 1. It is related to the fraction of photo-synthetically active radiation. Vegetated areas typically have NDVI values greater than zero. The higher the NDVI, the denser and more greener the vegetation.
In this paper vegetated areas are first found via thresholding on the NDVI and then green band is enhanced in these areas. For this enhancement the idea of (Miloud et al. 2010) is used with some modifications. In this method the difference of NIR and Red bands are applied to correct the Green band. This concepts are presented in the following pseudo code.
/ / process to make the Enhanced vegetated band .
For all image pixels( i= 0,1,...,N; j= 0,1,...,M) in MS image optimum values of 0.5 and 0.25 were selected for IKONOS and QuickBird images in that order.
Step 2. IHS method converts a color image from RGB space to the IHS color space. In next step I (intensity) band is replaced by the panchromatic image. Intensity image is produced as a linear combination of MS bands (Equation 6) and, thus, its weight parameters have a direct effect on the final fusion result. In previous researches these parameters were set to equal values but in recent studies different experimental values are also used for each data set (Tu et al. 2001, Choi. 2008). In the proposed method weight parameters are estimated by Genetic Algorithm. To this goal, the Greennew band with the other bands (Red, NIR, and Blue) are imported to the binary genetic algorithm to achieve the best optimum weight parameters for computing the fused image. Higher amounts of GA cost function reflect more desired results. In our proposed method the cost function was designed as the
linear combination of some metrics shown in the following relation:
(1 ) (1 )
FRMSEERGAS QAVE RASESAMSID Spatial (7)
The definition of these metrics are explained in below.
ERGAS (Wald. 2000) is an acronym in French for “Erreur relative globale adimensionnelle de synthese” which translates to “relative dimensionless global error in synthesis”.
A Universal Image Quality Index (Q-average) models any distortion as a combination of three different factors: loss of correlation, luminance distortion, and contrast distortion (Bovik. 2002).
The relative average spectral error (RASE) characterizes the average performance of the method of image fusion in the spectral bands (Ranchin et al. 2000).
The Spectral Angle Mapper (SAM) (Goetz et al. 1992) is a metric that calculates the spectral similarity between two spectral vectors as a spectral angle.
Spectral Information Divergence (SID) (Chang et al. 1999) originates from information theory. Each pixel spectrum is viewed as a random variable and SID measures the difference or discrepancy of the probabilistic behaviors between two spectral vectors, taken from the MS image and final fused image, respectively.
The Spatial metric used in this paper is based on computing the correlation coefficient between the high-frequency data of each MS band and the high frequency data of the Pan image. The initial random population size was set to 50 and the maximum number of generations was selected equal to 100. The chromosome length was 28. The optimum
4. Performance evaluation of the pan-sharpened images
Two datasets were used in this study. The first one was a Quick Bird subset in an urban area and the other was an IKONOS image of a semi urban area containing agricultural field.
Spatial quality can be judged visually, but color changes more difficult to be recognized in this manner (Rahmani et al. 2008). The spectral quality of pan-sharpened images was determined according to the changes in colors of the fused images as compared to the MS reference images. In this study, seven metrics (Correlation Coefficient, ERGAS, RASE, RMSE, SAM, SID and Spatial Coefficient) were used in order to determinethe quality of the pan-sharpened images. Before the analysis, each MS image was resampled to the equivalent size of its corresponding PAN image (Rahmani. 2008, Alperton. 2008, and Zhang. 2008).
5. RESULT 5.1. IKONOS data set
Table 1: Assessing the fusion methods (IKONOS data set)
Figure 2. chart of results(IKONOS data sat)
MS image PAN image
FAST IHS Adaptive IHS
IKONOS IHS IHS -GA
Figure 3. outputs of methods(IKONOS data sat)
5.2. QuickBird data set
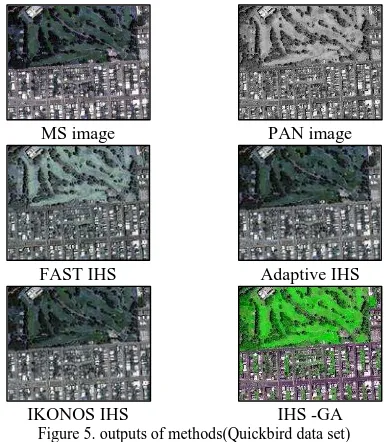
The second study area is an urban San Francisco, California, USA. The dataset consists of a low-resolution (2.4m) multispectral image with four bands R, G, B and NIR and a high-resolution (0.6m) panchromatic image of high-resolution. The contained results for this data set are presented in table2 where in addition to the proposed IHS-GA four well known extensions of IHS are also evaluated to give us the comparison opportunity. This table content is also depicted in Figure 4 for a more comprehensive view. Figure 5 presents the obtained fused images of the proposed method.
Table 2: Assessing the fusion methods (Quickbird data set)
Figure 4. chart of results(QuickBird data sat)
MS image PAN image
FAST IHS Adaptive IHS
IKONOS IHS IHS -GA
Figure 5. outputs of methods(Quickbird data set)
In general, the performance of a pan-sharpening method can be subjectively and objectively evaluated. For subjective evaluation, the true color display (Figures 3&5) of the objects in IHS-GA fused images (Enhanced vegetation areas, Building and roads) are visually evaluated for being clear and sharp as well as having natural colors similar to those of the original MS image. According to In Figures 3&5, the IHS-GA method has clearly sharped the original image and greatly improved its spatial quality. On the contrary spectral distortion can be seen in the FAST IHS and IKONOS IHS results of both datasets.
The noticeably color improvement of IHS-GAmethod is mainly due to the enhancement of vegetation areas. A more detailed look shows that vegetation areas are much more clear and sharp in the fused image of IHS-GA method.
Next we look at the metrics to evaluate the spectral and spatial quality.The values in Tables 1-2 correspond to the images in Figures 3&5 respectively. In all Tables, the values of the metrics are closer to the reference value when using the IHS-GA method. The Adaptive IHS fused image perform better than the FAST HIS and IKONOS IHS. Theperformance of IHS-GA is concededly
0.000 1.000 2.000 3.000 4.000 5.000 6.000 7.000 8.000 9.000 10.000
C.C ERGAS RASE RMSE SAM SID S.C
FAST IHS Adaptive IHS Ikonos IHS IHS-GA refrence
0.000 1.000 2.000 3.000 4.000 5.000 6.000 7.000 8.000 9.000 10.000
C.C ERGAS RASE RMSE SAM SID S.C
FAST IHS Adaptive IHS Ikonos IHS IHS-GA refrence
method C.C ERGAS RASE RMSE SAM SID S.C FAST IHS(Tu et al. 2001) 0.001 5.810 0.962 8.442 3.533 0.005 0.569 Adaptive IHS(Rahmani et al. 2008) 0.003 3.812 1.384 1.214 0.810 0.003 0.844 Ikonos IHS(Choi. 2008) 0.008 5.563 1.056 0.927 4.983 0.008 0.881 IHS-GA 0.087 0.454 0.106 0.428 1.308 0.001 0.972 refrence 0.000 0.000 0.000 0.000 0.000 0.000 1.000
better than its components. Note that, the spectral distortions of the IKONOS data are generally more than QuickBird data set. This is because the IKONOS data is taken from semi urban region and there are fewer strong edges to be sharpened. According to the results, the two points can be concluded. First, the Fast IHS method produces the images with very high spatial quality whereas the spectral quality depends on the various types of used data. Second, we cannot definite choose the best fusion method, for the spectral quality of results depended on the inputs data. Meanwhile, the evaluation metrics indicate that in IHS-GA the mentioned problems are partiality solved.
6. CONCLUSION
In contrast to previous studies related to fusion techniques (e. g. Rahmani. 2008, Zhang. 2008), which only used spectral metrics in their researches, it is better to consider the both spatial and spectral ones. In this study, the different spatial and spectral metrics were used. The IHS pan-sharpening method results good spatial qualityand is a commonly used algorithm for its speed and simplicity .To improve its spectral quality we proposed a novel IHS-GA fusion method based on enhancement vegetation area. The merging of these techniques (Enhanced Vegetation Area, GA and IHS method) improves the spectral quality of the results while keeping its spatial qualities. The performance evaluation metrics confirmed the capacity of the IHS-GA method.
7. REFERENCES
Alparone, L., Alazzi, B., Baronti, S., Garzelli, A., Nencini, F., Selva, M., 2008. Multispectral and panchromatic data fusion assessment without reference. In: Photogrammetric Engineering & Remote Sensing.
Bovolo F. Bruzzone L. Capobianco L. Garzelli A. Marchesi S. (2010). Analysis of effect of pan-sharpening in change detection on VHR Images. IEEE Transaction on Geoscience and Remote Sensing Letters, 7 (1): 53-57. doi: http://dx.doi.org/10.1109/ LGRS.2009.2029248.
Bovik, Alan C., and Zhou Wang. "A Universal Image Quality Index." IEEE Signal Processing Letters (2002).
Carper, Lillesand, and Kiefer, (1990). The use of intensity-hue-saturation transformations for merging spot panchromatic and multispectral image data, Photogramm. Eng. Remote Sens. vol. 56, no. 4, pp. 459–467.
Chavez P.S. Kwarteng A.Y. (1989). Extracting spectral contrast in Landsat Thematic Mapper image data using selective principal component analysis. Photogrammetric Engineering and Remote Sensing, 55: 339-348.
Chavez P.S. Sides S.C. Anderson J.A. (1991). Comparison of three different methods to merge multiresolution a nd multispectral data: TM & Spot Pan. Photogrammetric Engineering & Remote Sensing, 57: 295-303.
Chang, (1999).Spectral information divergence for hyperspectral image analysis, inProc. IEEE Int. Geoscience and Remote Sensing Symp. IGARSS’99, vol. 1, pp. 509–511.
Choi M. (2006). A new intensity-hue-saturation fusion approach to image fusion with a tradeoff parameter. IEEE Transaction on Geoscience and Remote Sensing, 44 (6 :)1672-1682. doi:
http://dx.doi.org/10.1109/TGRS.2006.869923.
Du Q. Younan N.H. King R. Shah V.P. (2007). On the performance evaluation of pansharpening techniques.IEEE Transaction on Geoscience and Remote Sensing Letters, 4 (4): 518-522. doi: http://dx.doi.org/10.1109/LGRS.2007.896328.
Earth Resource Mapping Pty Ltd. (1990). The Brovey transform explained, EMU Forum, 2 (11). Available at: http: // www. ermapper.com/ forum_new/emuf2-11.htm # aiticle_5 (last accessed 05.05.2013).
.Goetz, Yuhas,and.Boardman, (1992). Discrimination among semi-arid landscape endmembers using the Spectral Angle Mapper (SAM) algorithm, Summaries 3rd Annu. JPL Airborne Geoscience Workshop, vol. 1, pp. 147–149.
Klonus S. Ehlers M. (2007). Image fusion using the Ehlers spectral characteristics preserving algorithm.GIScience and Remote Sensing, 44 (2): 93-116.
Lau, W., King, B. A., Li, Z., (2000). The influences of image classification by fusion of spatially oriented images. International Archives of Photogrammetry and Remote Sensing, 33 (Part B7), pp. 752-759.
Luciano Alparone, Lucien Wald, Jocelyn Chanussot, Claire Thomas, Paolo Gamba, et al. (2007). Comparison of Pansharpening Algorithms: Outcome of the 2006 GRS-S Data Fusion Contest. IEEE Transactions on Geoscience and Remote Sensing, Institute of Electrical and Electronics Engineers (IEEE), 2007, 45 (10), pp.3012-3021. <10.1109/TGRS.2007.904923>. <Hal-00177641>
Miloud Chikr El Mezouar, Nasreddine Taleb, Kidiyo Kpalma, and Joseph Ronsin. (2010). An Improved Intensity-Hue-Saturation for a High-Resolution Image Fusion Technique Minimizing Color Distortion. IJICT, Vol. 3, No. 1, February 2010 / ISSN: 0973-5836 / Serials Publications, India.
Myungjin C. (2006). New Intensity-Hue-Saturation Fusion Approach to Image Fusion with a Tradeoff Parameter. IEEE Transaction on Geoscience and Remote Sensing, 44 (6): 1672-1682. doi: http://dx.doi.org/10.1109/TGRS.2006.869923.
Otazu and Gonzalez-Ausicana. (2005).Introduction of Sensor Spectral Response into Image Fusion Methods: Application to Wavelet-Based Methods. IEEE Transactions of Geoscience and Remote Sens. vol. 43, pp. 2376-2385.
Palsson, F., Sveinsson, J. R., Benediktsson, J. A., & Aanaes, H. (2012). Classification of pansharpened urban satellite images. Selected Topics in Applied Earth Observations and Remote Sensing, IEEE Journal of, 5(1), 281-297.
Pohl, C., Genderen, J. L., (1998). Multisensor image fusion in remote sensing: concepts, methods and applications. International Journal of Remote Sensing, 19(5), pp. 823-854.
Rahmani, Sh., Strait, M., Merkurjev, (2008). Evaluation of pan-sharpening methods.
Shettigara V.K. (1992). A generalized component substitution technique for spatial enhancement of multispectral images using a higher resolution data set. Photogrammetry Engineering and Remote Sensing, 58: 561-567.
Shah V.P. Younan Nh. King R.L. (2008). An Effictient Pan-Sharpening Method via a Combined Adaptive PCA Approach and Contourlets. IEEE Transaction on Geoscience and Remote
Sensing, 46 (5): 1323-1335. doi:
http://dx.doi.org/10.1109/TGRS.2008.916211.
Schetsellar E.M. (1998). Fusion by the IHS transform: Should we use cylindrical or spherical coordinates. International Journal of Remote Sensing, 19 (4): 759-765. doi: http://dx.doi.org/10.1080/014311698215982.
Su, Shyn and P. Huang. (2001).A New Look at IHS-like Image Fusion Methods. Information Fusion, Vol. 2. pp. 177-186.
Tu, T., Haung, Su, Sh., Shyu, H., P.S., Hung, (2001). A new look at HIS-like image fusion methods. In: Information Fusion.
Tu, Huang, Hung, and C.P. Chang, (2004).A fast intensityhue-saturation fusion technique with spectral adjustment for IKONOS imagery, IEEE Geosci. Remote Sens. Lett. vol. 1, no. 4, pp. 309–312.
Tu, T., Lee, Y., Chang, Ch., Huang, P., (2005). Adjustable intensity-hue-saturation and brovey transform fusion technique for IKONOS/Quickbird imagery. In: Optical Engineering.
Vrabel J. (1996). Multispectral Imagery Band Sharpening Study. Photogrammetric Engineering & Remote Sensing, 62: 1075-1083.
Wald, (2000). Quality of high resolution synthesized images: Is there a simple criterion, in Proc. 3rd Conf. Fusion of Earth Data: Merging Point Measurements, Raster Maps and Remotely Sensed Images,T. Ranchin and L. Wald, Eds. SEE/URISCA, Nice, France.
Yang S. Wang M. Jiao L. (2012). Fusion of multispectral and panchromatic images based on suppor t value transform and adaptive principal component analysis. Information Fusion, 13 (3): 177-184. Doi http://dx.doi.org/10.1016/j.inffus.2010.09.003.
Yang W. Gong Y. (2012). Multi-spectral and panchromatic
images fusion based on PCA and fractional spline wavelet. International Journal of Remote Sensing, 33 (22): 7060-7074. doi: http://dx.doi.org/10.1080/01431161.2012.698322.
Zhang Y. (2004). Understanding image fusion. Photogrammetric Engineering & Remote Sensing, 70: 657-661.