DIGITAL 3D BOROBODUR:
INTEGRATION OF 3D SURVEYING AND MODELING TECHNIQUES
Deni Suwardhi a, Fabio Menna b, Fabio Remondino b, Klaus Hanke c, Rizka Akmalia a
a
Remote Sensing and GIS Research Group, Institute of Technology Bandung, Indonesia Email: [email protected], rizka.akma lia01@g ma il.co m
b
3D Optical Metrology (3DOM) unit, Bruno Kessler Fou ndation (FBK), Trento, Italy Email: (fmenna, remondino)@fbk.eu
c
Surveying and Geoinformation Unit, University of Innsbruck, Austria – Email: [email protected]
Commission V, WG V/2
KEY WORDS : 3D surveying, multi-sensor, Borobudur temple, heritage documentation, p hotogrammetry
ABS TRACT:
The Borobudur temple (Indonesia) is one of the greatest Buddhist monuments in the world, now listed as an UNESCO World Heritage Site. The present state of the temple is the result of restorations after being exposed to natural disasters several times. Today there is still a growing rate of deterioration of the building stones whose causes need further researches. M onitoring programs, supported at institutional level, have been effectively executed to observe the problem. The paper presents the latest efforts to digitally document the Borobudur Temple and its surrounding area in 3D with photogrammetric techniques. UAV and terrestrial images were acquired to completely digitize the temple, produce DEM , orthoimages and maps at 1:100 and 1:1000 scale.
The results of the project are now employed by the local government organizations to manage the heritage area and plan new policies for the conservation and preservation of the UNESCO site. In order to help data management and policy makers, a web-based information system of the heritage area was also built to visualize and easily access all the data and achieved 3D results.
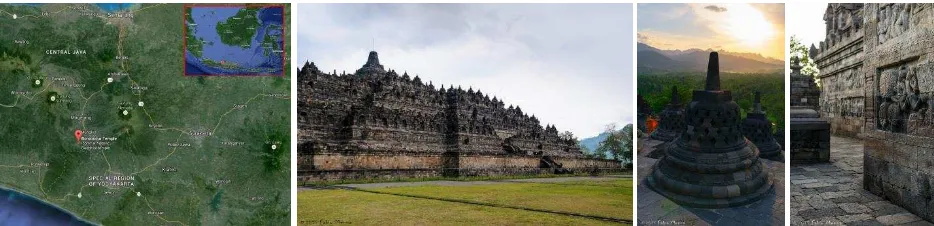
Figure 1: T he geographic location of the Borobudur UNESCO site (left) and some images of the temple with its stupa and bas -reliefs.
1. INTRODUCTION
Borobudur is the most outstanding temple in Indonesia. Located on the Borobudur plain, this temple sits majestically in an open area about forty kilometres north-west from Yogyakarta, Indonesia. It is located in the very central part of Java Island, Indonesia (Fig. 1). It was built around 824 AD by Samaratungga, a king of the Syailendra dynasty , a flourishing Buddhist kingdom.
The Borobudur building (Fig. 1) needed about 125 years of construction and was utilized by religious activities until the 11th century. About two centuries after the construction, Borobudur was not used by people because of the great disaster in Java Island and because of the civilization movement to East Java. Borobudur was forgotten until it was opened again by Raffless in 1814 (Durmacay, 1978), and then completely cleaned by Hartmann from Dutch Indies Government in 1835. Borobudur has been restored two times, the first restoration was done by Theodore van Erp on 1907-1911 while the second one was realized by UNESCO and the Indonesian Government in 1973-1983. The temple was inscribed as an UNESCO World Heritage Site in 1991 (number 592) and represents one of the largest Buddhist temples in south-east Asia.
The structural stability problems of the Borobudur temple were solved after the second restoration. After that, the structural stability has been continuously monitored to control the temple deformation both horizontally and vertically. The main problem of the Borobudur temple is its deterioration rate. Borobudur and its stones are at the mercy of sun rays and heavy rains all year long, thus accelerating the deterioration of the structures and decorations. The Borobudur site is also very often affected by volcanic ash. In autumn 2010 the eruption of M ount M erapi, located approximately 30 km from the temple, covered the entire temple with ca 2.5 cm of ash, killing also the nearby vegetation and damaging the historic monument due to its acidity. The temple complex was closed for many days to clean up that ash-fall while the upper levels remained closed to the public until late September 2011. The Borobudur Conservation Agency, with the help of UNESCO, was able to rid the temple's stones of volcanic sediment, to plant trees to stabilise temperatures and finally to support the living conditions of local residents (M asanori, 2011).
As one of the greatest UNESCO world heritage sites, its geometric documentation is important for monitoring its deterioration and preservation but also for spatial management and dissemination purposes.M onitoring the Borobudur temple requires great efforts due to the large and complex size of the The International Archives of the Photogrammetry, Remote Sensing and Spatial Information Sciences, Volume XL-5/W7, 2015
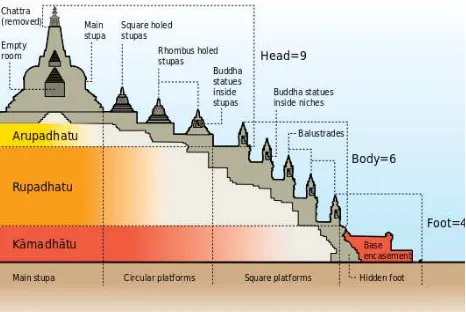
building (Fig. 2). The length of each side is 121 meter and the height of the whole building is 35 meter. It consist of three part: (i) the temple-foot, the lowest part consisting in two levels of foot structure; (ii) the body of the temple, consisting in four levels of main wall and five levels of balustrades with the sculpture gallery (bas-relief). The total number of panels of bas-relief is 1460. The upper part of the building, i.e. the head, consists of three level terraces with 72 small stupas and one main stupa at the centre.
Figure 2. Borobudur’s cross section and building ratio (source: Wikipedia).
On October 28th – November 1st, 2013 a workshop related to the application of aerial (UAV) and close-range photogrammetry for documenting cultural heritage sites was held in Borobudur. It was organized by the Remote Sensing and GIS Research Group of the Institute of Technology Bandung (ITB). The main aim of the workshop was to build an heritage information system, based on reality -based 3D surveying data, for the documentation and conservation of the Borobudur site. This paper steams from the outcomes of t he workshop and surveying operations realized during the event. The planning of the data acquisitions, the achieved results and some final comments are afterward presented.
2. MULTI-S ENS OR MULTI-RES OLUTION APPROACH
2.1 Related works
Since more than 20 years, sensor and data fusion is employed as very successful solution for the 3D documentation of large heritage sites. In a multi-resolution survey, we should be distinguished between (i) geometric modeling (3D shape acquisition, data registration and further processing) where multiple sensors and resolutions are combined to model features with the most adequate sampling step and (ii) appearance modeling (texturing, blending, simplification and rendering) where multiple images are used for realistic appearance and various LODs (Level of Details) are used to face 3D models complexity during the visualization. For the 3D documentation of large and complex sites, the state-of-the-art approach uses and integrates multiple sensors and technologies (photogrammetry, active sensors, topographic surveying, etc.) for the derivation of different geometric LODs of the scene under investigation, both in geometry and texture. Each LOD shows only the necessary information while each technique is used where best suited to exploit its intrinsic modeling advantages.
Stumpfel et al., (2003) digitally reunified the Parthenon of Athens and its sculptures using photogrammetry and stripe projection systems. Gruen et al. (2005) used a multi-resolution image-based approach to document the entire valley of Bamiyan and produced a GIS of the UNESCO area. El-Hakim et al. (2008) integrated terrestrial photogrammetry and different laser scanners to produce a textured 3D model the Erechteion of Athens. Guidi et al. (2009) used a resolution and multi-sensor approach to digitally reconstruct the entire Roman Forum in Pompeii. Remondino et al., (2009) merged drawings, images, range data and GPS measures for the detailed modeling of castles and their surrounding landscapes. Takase et al. (2009) used old maps, aerial and street photos, paintings, archaeological records and LiDAR data for the 3D reconstruction and visualization of the historic city of Kyoto in Japan. Kochi et al. (2012) integrated range-based and image-based point clouds for architectural modelling. Serna et al. (2015) fused active sensors data with images for colouring purposes.
2.2 The digital 3D Borobudur project
Similar to other projects, a multi-sensor multi-resolution approach was selected in order to realized different 3D products for better management and conservation of the heritage site. Photogrammetry was chosen as the most suitable 3D recording technique for the surveying and modelling of the site. Indeed, due to its complexity, dimensions, number of occlusions, necessary LODs and required products, active sensors were not able to fulfil the project specifications.
Different UAV platforms and digital cameras were employed. In order to plan the image acquisitions and provide a cost effective network configurations for each of the multi-LODs flights over Borobudur, a network design analysis was performed. Camera network design (Fraser, 1984; Kraus, 1997; M ikhail et al., 2001; Nocerino et al., 2014) is indeed a very important task to ensure a good quality of the acquired images and successive 3D model generation.
3. 3D S URVEYING OPERATIONS AND PHOTOGRAMMETRIC PRODUCTS
Within the 3 days of the 2013 workshop , the UNESCO area was surveyed by a group of 20 people using terrestrial and aerial (UAV) photogrammetry. A fixed-wing UAV was used to capture the surrounding area of the Borobudur temple (ca 1 km x 1 km). A hexa-copter was flown at lower altitude to capture the temple (ca 120 m x 120 m) at high resolution. Finally terrestrial images were used to capture and digitally model the details of the temple (e.g. relief on the walls).
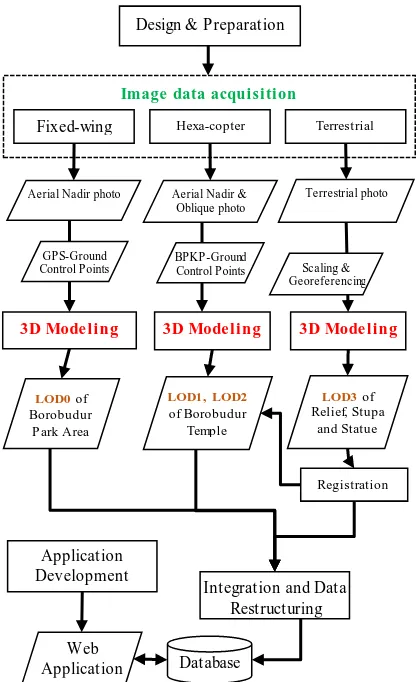
The flowchart which describes the process is shown in Figure 3. As visible in the flowchart, different acquisitions were realized to capture different LODs of the heritage site. Using UAVs, the 3D reconstruction p rocess of the temple can be completed at reasonable costs and time if compared to conventional mapping techniques. The employed UAVs were coupled with a control system for real-time data transmission and image orientation. 2.1 Ground Control Points
GCP measurement, performed with GNSS or total station instruments, is fundamental for scaling and georeferencing purposes but also to check the quality of the photogrammetric processing.
Figure 3. Workflow of the project: from data acquisition to database generation and web sharing.
BKPB (Borobudur Heritage Conservation) set up a control network made of 84 Ground Control Points (GCPs) in a local coordinate system (Fig. 4 - left), defining each point with permanent nails. During the UAV campaign, 6 new GCPs were measured using geodetic GNSS double frequency L1/L2 receivers with good distribution covering the AOI (Fig.4 - right). Implementing a rapid static differential positioning, every GCP must be measured not less than 30 minutes in
order to get sub-centimetre accuracy considering an adequate distance between the master and rover receivers (Fig. 5 - right). 2.2 Fixed-wing UAV
A fixed-wing was flown 280 m above the ground to cover around 1 km2. The aim was to generate a DEM and an orthophoto of the surrounding area of the temple. A flight plan was made before the flight (Fig. 6 - left), with a 80-60% overlap and a planned GSD of 7 cm. The camera mounted on the platform was the Sony NEX-7 (23.4 x 15.6 mm sensor size with a pixel of 3.9 micron) coupled with a 20 mm nominal focal length.
2.3 Hexa-copter UAV
Several experiments were done before the data acquisition to design the best flight lines to cover the temple with the hexa-copter platform (Fig. 5 - left). Finally five strips were designed to cover the area around the temple (Fig. 6 - right). Images were acquired in vertical as well as oblique mode, in order to capture the details of the vertical facades of the temple. For the vertical images, the UAV was flown at 50 m above the ground mounting a Sony Nex-5 camera with a 16 mm focal length. This flight aimed to map the temple in lower scale (1.5 cm GSD on the ground) than the fixed-wing. On the other hand the oblique images were acquired flying at 20 m, 30 m and 35 m above the ground (Figure 8) using again the same camera.
Figure 5: T he hexa-copter used for the low-altitude flight (left) and the GCPs measurement (right).
Figure 4. The BPKP GCPs network on the temple (left) and the GCP’s distribution for the UAV fixed-wing images (right). Design & Preparation
Image data acquisition
Fixed-wing Hexa-copter Terrestrial
3D Mode ling
Aerial Nadir photo Aerial Nadir & Oblique photo
Terrestrial photo
3D Mode ling 3D Mode ling
LOD0 of Borobudur
P ark Area
LOD1, LOD2 of Borobudur
Temple
LOD3 of Relief, Stupa
and Statue
Integration and Data Restructuring
Database Application
Development
Web Application GPS-Ground Control Points
BPKP-Ground Control Points
Registration Scaling & Georeferencing
Figure 6: T he planned flight strips for the fixed-wing UAV (GSD = 7 cm) and for the hexa-copter UAV (GSD = 1.5 cm).
2.4 Terrestrial Photo
Terrestrial photogrammetry aimed to capture high details of the structure, such as reliefs in the vertical walls or other decorations. A mix of parallel axis and convergent images were acquired to ensure a reliable self-calibration, achieve a complete 3D reconstruction of the details and collect suitable stereo-pairs for successive interpretations and analyses by the experts. The employed camera was a Sony RX100.
Da ta Scene Resolution Products
LOD0 fixed-wing
UAV
landscape & temple
ca 5 cm DEM,
ortho
LOD1 hexa-copter
UAV (nadir)
temple & stupa
ca 2 cm ortho, 3D
models
LOD2 hexa-copter
UAV (oblique)
stupa and ornaments
ca 1 cm 3D models
LOD3 terrestrial
images
bass-reliefs
sub-cm 3D models
T able 1: T he different LODs produced for the Borobudur area.
2.5 Photogrammetric results
The photogrammetric processing was performed considering the single datasets and using the available GCPs for the georeferencing and the successive merging procedure.
Using the achieved products (DEM , orthos, dense point clouds, 3D models), the various LODs were created (Table 1) for the database creation, visualization purposes and conservation analyses.
4. DATABAS E AND VIS UALIZATION
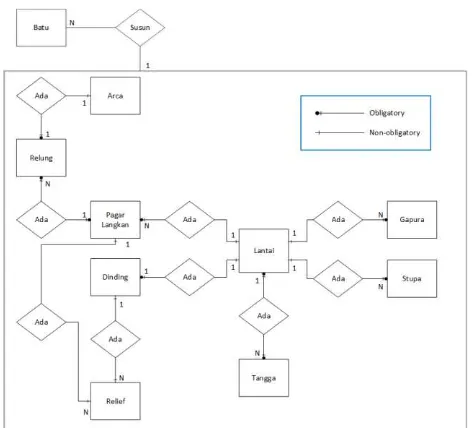
The development of geo-spatial database starts with the design of data model which shows what data are to be contained in the database and how the items in the database will be related to each other. The database design process is usually divided into three main activities, namely: conceptual, logical and physical data modeling. The entity -relationship diagram shown in Fig. 9 represents the proposed conceptual model of geo-spatial database of the Borobudur site. The attributes are not shown in the diagram for readability purpose, however they have been identified and included in its corresponding logical model.
Figure 7: DEM of the entire area produced from the UAV fixed-wing images.
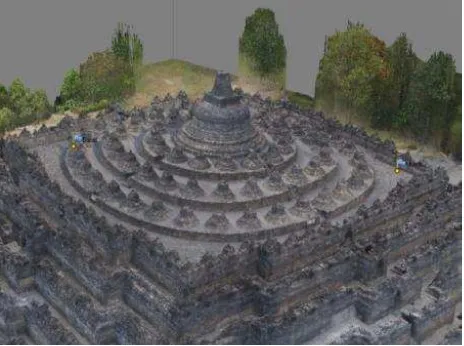
Figure 8: 3D model of Borobudur temple built from the UAV hexa-copter data.
Figure 9. ER-diagram as the database design result .
In physical data modeling, the logical data model developed has been transformed to physical data model using the syntax of PostgreSQL/PostGIS, which follows the object-relational database design.
The web application was developed for the visualization the Borobudur spatial database in PostGIS. Some open source libraries, such as OpenLayers and OpenWebGlobe, were used to realize the application (Fig. 10). OpenWebGlobe (Christen et al., 2012) is a WebGL based 3D geobrowser, which allows to process and visualize very large volumes of geospatial data. It consists of a complete SDK to develop web-based applications without the need of plugin. It supports various forms of image data, elevation data, point of interest and 3D models. It is useful for processing very large amount of data, up to terabytes, in highly parallel and scalable computing environments. But it is different from other globes in the way that the data must be pre-processed before loading on the Internet.
Figure 10. Web application for the visualization of the developed spatial database of the Borobudur area.
5. TOWARD 3D WEB-BAS ED MANAGEMENT AND ANALYS ES
As previously mentioned, the Borobudur temple is extremely vulnerable as it is exposed to heavy rains, earthquakes and volcanic activities. The site has been damaged by earthquakes, which are very strong in Java island, moving the ground surface as waves with imaginable consequences to the structural integrity of the temple. The ash of volcano M erapi, which erupted very frequently in the last few years (in average every 3-4 years), covers the temple detreating the ancient stones. On February 2014 the site was closed to visitors due to the ash coming from the Kelud volcano in East Java, located ca 200 kilometers east from Borobudur.
Therefore the Borobudur temple represents an example of a dynamic and complex context of conservation and restoration, which needs efficient and cost effective solutions. Each stone composing the temple and its outstanding reliefs must be classified, indexed and catalogued and its location georeferenced. For these purposes, 3D digital technologies, if wisely and systematically applied, represent a powerful solution for sharing and efficiently managing information about large and complex heritage environments. With this perspective, in the last years, the problem of visualizing and managing complex 3D data has been extensively investigated by different researchers who have presented web based solutions for visualization purposes (Silla, 2012; Potree, 2014; Potenziani et al., 2015) as well as for analyses and management (Fassi et al., 2011, 2015; De Luca, 2013) or in the form of navigable virtual reality environments based on unity game engine (Agugiaro et al., 2011; Hullo et al., 2015).
The above mentioned systems, very often structured with different LODs, may be enriched with additional features and tools for analyzing the 3D shape of each single stone relief as a whole. Pires et al. (2015) proposed V-PTM system based on Reflectance Transformation Imaging (RTI) built on 3D mesh models instead of using real RTI images specifically acquired with generally bulky and expensive equipment. This feature may help archeologists to better interpret and study the figures carved in the reliefs by easily changing the light source direction. As shown in Fig. 11a, the characteristics of the Borobudur stones make the figure’s readability very hard on color images while much more details are clearly highlighted by simply changing the illumination on the 3D model.
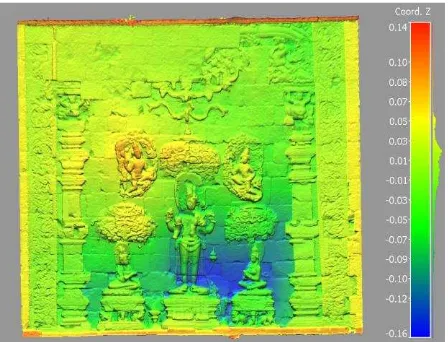
Another important study that is carried out on the reliefs of Borobudur temple is the analysis of shape deformations with respect to the ones ideally expected. This is an area-based analysis able to show global warps. Figure 12 shows a deformation (due to structural movements or inefficient restorations) of relief stones. The colour coded map displays a highly deformed surface due to movements / compressions of the structure. Repeated 3D modelling activities may keep track of local deformations of both reliefs and building structures as well.
a) b) c) d) e) f)
Figure 11. A carved figure in the reliefs of Borobudur temple: its deterioration and colours make the readability quite hard (a). Much more readable synthetic views of the same relief can be easily and automatically generated by changing the direction of light casted over a 3D mesh model and then given as input to obtain a V-PT M (b-f).
Figure 12: 3D surface model of a bass-relief and computed shape deformation with respect to the ideal / flat surface. A t ypical colour pattern is visible (depressions in blue, swelling in orange/red) showing deformations of the (units are meters).
6. CONCLUS IONS
The paper presented a multi-sensor multi-resolution approach to geometrically document the very complex and large UNESCO site in Borobudur. Photogrammetry was employed at multiple scales to produce various geometric LOD and deliver 3D models, orthophotos, maps and a spatial database for conservation and preservation purposes. All these products had to follow the specifications and needs of the local government organizations in charge of the management and conservation of the heritage site.
Topographic maps with absolute National Standard for Spatial Data Accuracy (NSSDA) errors of 0.25 m (accuracy), as good as a map in scale 1:1000, were achieved using GCPs and non-metric small format digital cameras mounted on a fixed-wing UAV platform. This provides a relatively inexpensive and flexible solution for generating DEM for large scale topographical mapping requirements in Indonesia where clouds at low altitude often do not permit standard photogrammetric acquisitions.
The produced map can be used for tourism and conservation purposes as well as for cadastral and landscape planning. Using the hexa-copter UAV data, a map 1:100 was realized, showing that UAV photogrammetry with small format non-metric cameras could give satisfactory result also at big scale. This map can be used for monitoring of deterioration and preserving the site.
For the sharing and visualization of the produced 3D data, the developed application enriched by Openwebglobe is avoiding lengthy loading time and poor visualization performance and it allows to easily access all the data.
REFERENCES
Agugiaro, G., Remondino, F., Girardi, G., von Schwerin, J., Richards-Rissetto, H., & de Amicis, R., 2011. QueryArch3D: Querying and Visualising 3D M odels of a M aya Archaeological Site in a Web-Based Interface. Geoinformatics FCE CTU, 6, 10-17.
Christen M ., Nebiker, S. and Loesch B., 2012. Web-based Large-scale 3D-Geovisualisation using WebGL – The OpenWebGlobe Project. International Journal of 3-D Information M odeling (IJ3DIM ).
De Luca, L., 2013: 3D M odelling and Semantic Enrichment in Cultural Heritage. Proc. 54th Photogrammetric Week.
Durmacay, J., 1978. Borobudur. Kuala Lumpur: Oxford University Press.
Fassi, F., Achille, C., Fregonese, L., 2011. Surveying and modelling the main spire of M ilan Cathedral using multiple data sources. The Photogrammetric Record, Vol. 26(136), pp. 462-487.
Fassi, F., Achille, C., M andelli, A., Rechichi, F., Parri, S., 2015. A new idea of BIM system for visualization, web sharing and using huge complex 3d models for facility management . International Archives of the Photogrammetry, Remote Sensing and Spatial Information Sciences, Vol. XL(5/W4), pp. 359-366. Fraser, C.S., 1984. Network design considerations for non-topographic photogrammetry. Photogrammetric Engineering and Remote Sensing, Vol. 50(8), pp. 1115-1126.
Guidi, G., Remondino, F., Russo, M ., M enna, F., Rizzi, A., Ercoli, S., 2009. A multi-resolution methodology for the 3D modeling of large and complex archaeological areas. Int. Journal of Architectural Computing, 7(1), 40-55.
Gruen, A., Remondino, F., Zhang, L., 2005. The Bamiyan project: multi-resolution image-based modeling. In: Recording, M odeling and Visualization of Cultural Heritage, Taylor & Francis / Balkema, ISBN 0415 39208 X, pp. 45-54.
Kochi, N., Kitamura, K., Sasaki, T., Kaneko, S., 2012. 3D M odeling of architecture by edge-matching and integrating the point clouds of laser scanner and those of digital camera. International Archives of Photogrammetry and Remote Sensing and Spatial Information Sciences, Vol. 39(B5).
Kwee, M . G., 2012. The Borobudur: A Psychology of Loving-kindness Carved in Stone. (K. Dhammasami, & D. Peoples, Eds.) The Journal of International Association of Buddhist Universities, 1-28.
Kraus, K., 1997. Photogrammetry. Volume 2: Advanced M ethods and Applications. Ferd-Dümmlers Verlag.
Hullo, J. F., Thibault, G., Boucheny, C., 2015. Advances in M ulti-Sensor Scanning and Visualization of Complex Plants: the Utmost Case of a Reactor Building. International Archives of the Photogrammetry, Remote Sensing and Spatial Information Sciences, Vol. XL(5/W4), pp. 163-169.
M asanori, N., 2011. Revitalization of Borobudur: Heritage tourism promotion and local community empowerment in cultural industries. ICOM OS 17th General Assembly .
M ikhail, E. M ., Bethel, J. S., M cGlone, J. C., 2001. Introduction to modern photogrammetry, Vol. 1, John Wiley & Sons Inc. National Standard for Spatial Data Accuracy – NSSDA: https://www.fgdc.gov/standards/projects/FGDC-standards-projects/accuracy/part3/index_html (accessed: 10 July, 2015). Nocerino, E., M enna, F., Remondino, F., 2014. Accuracy of typical photogrammetric networks in cultural heritage 3D modeling projects. International Archives of the Photogrammetry, Remote Sensing and Spatial Information Sciences, Vol XL(5), pp. 465-472.
Pires, H., Rubio, J. M ., Aranac, A. E., 2015. Techniques for revealing 3D hidden archeological features: morphological residual models as virtual-polynomial texture maps. International Archives of the Photogrammetry, Remote Sensing and Spatial Information Sciences, Vol. XL(5/W4), pp. 415-421. Potenziani, M ., Callieri, M ., Dellepiane, M ., Corsini, M ., Ponchio, F., Scopigno, R., 2015. 3DHOP: 3D Heritage Online Presenter Computers & Graphics, 2015 - In press.
Potree, 2014, http://potree.org/wp/ (accessed: 10 July 2015). Remondino, F., Gruen, A., von Schwerin, J., Eisenbeiss, H., Rizzi, A., Sauerbier, M ., Richards-Rissetto, H., 2009. M ulti-sensors 3D documentation of the M aya site of Copan. Proc. of 22nd CIPA Symposium, 11-15 Oct., Kyoto, Japan.
Serna, C. G., Pillay, R., Trémeau, A., 2015. Data Fusion of Objects Using Techniques Such as Laser Scanning, Structured Light and Photogrammetry for Cultural Heritage Applications. Computational Color Imaging (pp. 208–224). Springer
Silla, L., 2012, CyArk Releases New Online 3D Viewer Online at: http://www.cyark.org/news/cyark-releases-new-on line-3d- viewer (accessed: 10 July 2015).
Stumpfel, J., Tchou, C., Yun, N., M artinez, P., Hawkins, T., Jones, A., Emerson B, Debevec, P., 2003. Digital reunification of the Parthenon and its sculptures. Proc. VAST, pp. 41-50. Takase, Y., Yano, K., Nakaya, T., Isoda, Y., Tanaka, S., Kawasumi, T., et al., 2009. Virtual Kyoto – A comprehensive reconstruction and visualization of a historical city. Proc. of the 9th Conference on Optical 3-D M easurement Techniques, Vienna, Austria, Vol. I, pp. 11-20.