SfM FOR ORTHOPHOTO GENERATION: A WINNING APPROACH FOR CULTURAL
HERITAGE KNOWLEDGE
F. Chiabrando a , E. Donadio b, F. Rinaudo b
a Dept. of Environment Land and Infrastructure Eingeneering, Politecnico di Torino Corso Duca deglia Abruzzi 24, 10129 Torino, Italy – [email protected]
b
Dept. of Architecture and Design, Politecnico di Torino, Viale Mattioli 24, 10125 Torino, Italy- (elisabetta.donadio,fulvio.rinaudo)@polito.it
Commission VI, WG VI/4
KEY WORDS: Cultural Heritage, close range photogrammetry, RPAS, MicMac, Photoscan, multi-image matching.
ABSTRACT:
3D detailed models derived from digital survey techniques have increasingly developed and focused in many field of application. The high detailed content and accuracy of such models make them so attractive and usable for large sets of purposes in Cultural Heritage. The present paper focuses on one of the main techniques used nowadays for Cultural Heritage survey and documentation: the image matching approach or Structure from Motion (SfM) technique. According to the low cost nature and the rich content of derivable information, these techniques are extremely strategic in poor available resources sectors such as Cultural Heritage documentation.
After an overview of the employed algorithms and used approaches of SfM computer vision based techniques, the paper is focused in a critical analysis of the strategy used by two common employed software: the commercial suite Agisoft Photoscan and the open source tool MicMac realized by IGN France. The experimental section is focused on the description of applied tests (from RPAS data to terrestrial acquisitions), purposed to compare different solutions in various featured study cases. Finally, the accuracy assessment of the achieved products is compared and analyzed according to the strategy employed by the studied software.
1. INTRODUCTION
Dense image matching methods enable the extraction of 3D point clouds and the generation of 3D models through a processing of a set of unoriented images acquired from multiple views. Over the last decade, many algorithms for image processing techniques in relation to geomatic fields have been improved. The MSER: Maximally Stable Extremal Regions, SIFT: Scale Invariant Feature Transform (Lowe, 2004), SURF: Speed Up Robust Feature (Bay et al., 2006) are the most important algorithms that have given a renovation interest in digital photogrammetry to the detriment of LiDAR technique (always expensive and not very widespread).
Nowadays the image matching problem can be solved using stereopairs (stereomatching) (Hirschmuller, 2011) or via identification of correspondences in multiple images (multi-view stereo – MVS) (Pierrot-Deseilligny and Paparoditis, 2006). As explained by (Remondino et al., 2014), according to (Szeliski, 2010), stereo methods can be local or global. Local methods use the intensity values within a finite region to compute disparity at a given point, with implicit smoothing assumptions and a local “winner-take-all” optimization at each pixel, whereas global methods, making explicit smoothness assumptions, solve for a global optimization problem using an energy minimization approach.
The great innovation in the image matching process related to photogrammetry techniques consists in the implementation of the Structure from Motion (SfM) technique. While traditional photogrammetry derives calibration parameters of the camera and the camera poses mainly from well-distributed GCPs and tie points, a Structure from Motion (SfM) approach computes simultaneously both this relative projection geometry and a set of sparse 3D points. To do this, it extracts corresponding image
features from a series of overlapping photographs captured by a camera moving around the scene (Verhoeven et al, 2012). This image-matching methodology was developed and tested firstly for Remote Sensed data. At first, it has been planned to meet orientation solutions and then to perform DTM/DSM (Digital Terrain Model / Digital Surface Model) extraction from aerial or satellite strips; more recently, it is extensively used in close-range application concerning architectural and archaeological survey. It is well accepted that the tie points (TPs) searching is simpler working on traditional aerial strips than using close range ones, because of the major variance in geometry and radiometry of terrestrial acquisition.
The coordination of multidisciplinary sectors is under great attention, since the management of such detailed and flexible models in web-GIS systems is nowadays increasing in the field of CH (Krooks, et al., 2014; Pal Singh et al., 2014).
2. FROM DIGITAL PHOTOGRAMMETRY TO SfM
The chance to derive 3D information from images is strictly connected with the ability to pick out corresponding points in images shooting the same object from different positions. In analogical and analytical photogrammetry this action has always been performed manually, while with the advent of digital photogrammetry, many reasons and benefits have encouraged the semiautomatic and automatic procedure. Starting from this assumption, after a first revolution phase that involved the transition from analytical to digital, improving an automation of photogrammetric process (point extraction, orientation digital plotting etc), today we are assisting to a second revolution. This revolution is pushing digital photogrammetry (semi-automatic oriented) to the Structure from Motion approach, naturally related to photogrammetric basis (measures, accuracy etc) but very close to the computer vision approach: fully automatic with a measurement approach not very important. After an initial enthusiasm, which usually occur with new trends, a deeper analysis on the real potentiality for CH documentation of these techniques is today needed.
On the other hand, it is clearly admitted that these techniques allow everyone to do photogrammetry; this was one of the main objective of the researcher involved in this area.
The improvement is evidently connected to the algorithms development. Such algorithms are used in a wide variety of applications but were developed in the 1990s in the field of computer vision, which is the science that develops mathematical techniques to recover a variety of spatial and structural information from images.
Structure from Motion allows the generation of 3D data from a series of overlapping images, employing same basic tenets as stereoscopic photogrammetry. However, it differs from conventional photogrammetry, since camera pose and scene geometry are reconstructed simultaneously using a highly redundant, iterative bundle adjustment procedure. This process works through the automatic identification of matching featuresin multiple images without requiring the specification a priori of a network of targets...
Such features are tracked among all images and then refined iteratively using non-linear least-squares minimization, enabling initial estimations of camera positions and object coordinates. It is important to underline that this approach is most suited to sets of images with a high degree of overlap that captures full three-dimensional structure of the scene viewed from a wide array of positions.
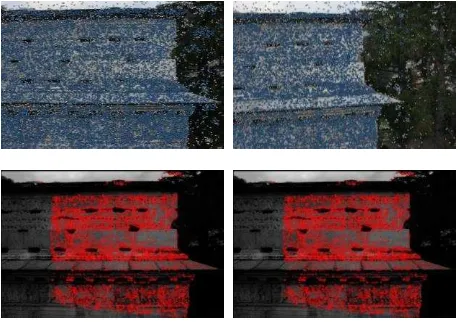
The afore mentioned SIFT (Scale Invariant Feature Transform) algorithm, developed by Lowe in 2004 (Lowe, 2004), allows the extraction of such feature points (Figure 1) in four steps: scale-space extrema detection, keypoint localization, orientation assignment and keypoint descriptor. In the first stage, it uses the difference of Gaussian function to identify potential points of interest; naturally according to the algorithm this points are invariant to scale and orientation. Difference of Gaussian is used instead of Gaussian to improve the computation speed. The low contrast points are rejected and the edge response are eliminated during the keypoint localization step. The Hessian matrix is used to compute the principal curvatures and eliminate the key points that have a ratio between the principal curvatures greater than the ratio. An orientation histogram was formed
from the gradient orientations of sample points within a region around the keypoint in order to get an orientation assignment (Lowe, 2004 ; Ke and Sukthankar, 2004).
Figure 1 Visualization of the extracted TPs in two overlapped images (Agisoft Photoscan above, MicMac below)
three-dimensional point clouds or triangular meshes, since MVS solutions operate on the pixel values instead of on the feature points (Seitz et al., 2006).
Another interesting approach is the semi global matching (SGM) algorithm, which was implemented by Hirschmuller (Hirschmuller, 2011), firstly in aerial application. This approach combines both global and local stereo methods for an accurate, pixel-wise matching with higher stability (Wenzel et al., 2013). While other global matching methods suffer from high computational efforts, SGM ensures efficient implementations at low runtime. (Wenzel et al., 2013).
It works computing a disparity map for each pair and then merging disparity maps sharing the same reference view into a unique final point cloud. Within a premodule, a network analysis and selection of suitable image pairs for the reconstruction process is performed. Epipolar images are then generated and a time and memory efficient SGM algorithm is applied to produce depth maps. All these maps are then converted in 3D coordinates using a fusion method based on geometric constraints that both help in reducing the number outliers and increase precision. This is particular successfully for repetitive or low textured images. In such areas, SMG is still able to retrieve reliable results. (Remondino et al., 2014). Starting from this scenario, several tests on different datasets were performed on UAV and terrestrial images in order to deeply understand the characteristic of two widely employed software: Photoscan and MicMac.
The processing steps were analyzed in order to understand the differences between such software and a typical photogrammetric approach (starting from the calibration up to the Orthophoto generation).
3. DATA PROCESSING STRATEGY AND RELATED PRODUCT. AN OVERVIEW OF THE EMPLOYED SOFTWARE
In this study, the images were processed using two different well known software tools: the commercial low-cost software Photoscan by AgiSoft LLC, and the open-source suite Apero – MicMac implemented by IGN (Istitut Geographique National) France.
Photoscan is an advanced image-based solution produced by the Russian-based company AgiSoft LLC for creating professional quality three-dimensional (3D) content from still images. This program has a simple interface and it enables the generation of sparse, dense point cloud, accurate three-dimensional textured meshes and other representations such as DSMs and orthophotos (Verhoeven, 2011). Built to operate on Windows systems but available on Linux and OS as well, Photoscan can handle a multitude of JPEG, TIFF, PNG, BMP or MPO files to generate three-dimensional data. The reconstruction process is composed by three simple steps, in which the user can set a large number of input parameters and, at any stage, disable/enable individual photographs, mask parts of the images or import textures and meshes created in other applications. The only assumption for a good reconstruction is that the scene to be reconstructed is visible on at least two photographs.
How mentioned before, in the first step of the process SfM technique enables the images alignment, calibration and the reconstruction of three-dimensional scene geometry and camera motion. To do this, the program detects image feature points (i.e. geometrical similarities such as object edges or other specific details) using an approach similar to the mentioned SIFT algorithm (a modification of the Lowe algorithm, since this is protected by the copyright) and, subsequently, it monitors the movement of those points throughout the sequence of multiple
images. Each point has its own local descriptor, based on its local neighbor-hood, which is subsequently used to detect point correspondences across the complete image set (G. Verhoeven et al., 2012). To perform this step, robust methods such as a modified version of RANSAC are used.
After this phase, the camera interior and exterior parameters, its positions and assets are defined in a local reference system. The interior orientation (focal length, principal point location as well as three radial and two tangential distortion coefficients) is computed basing on a radial model and the relative orientation (Azarbayejani and Pentland, 1995).
The resulting data is a sparse 3D point cloud corresponding to the locations of the estimated feature points.
In a second step, a dense, multiview stereo reconstruction on the aligned images is applied, in order to build geometric scene details. In this phase, the dense reconstruction algorithm works on the pixel values in order to generate detailed 3D meshed models.
In this phase, Photoscan allows users to choose among several dense stereo-matching algorithms (Exact, Smooth, Height Field and Fast), which differ in the way in which the individual depth maps are merged into the final digital model (G. Verhoeven et al., 2012). The final calculated model is equivalent to a digital surface model (DSM): a numerical representation of the morphology and its overlying objects. As well known since conventional orthorectification, such model is essential to generate true orthophotos, a bi-dimensional representation in which all objects with a certain height (such as houses, towers and trees) are accurately positioned and measurable. The computed mesh can be, finally, textured with the photographs. Using Photoscan it is possible to set only few parameters regarding the generation of the first alignment, the dense cloud and the texture. With the exception of the alignment, that has been set up at a medium range, all other steps of the workflow have been set up at the “high” input, that means that the algorithm extracts a point for each two pixel to generate the dense cloud.
Furthermore, it is important to highlight that according to the standard procedure the results are expressed in a local coordinate framework (that derives from the relative orientation). Since the applications connected to geomatic techniques and Cultural Heritage Survey require data with a defined coordinate system, Photoscan allows to set a coordinate system based on traditional ground control point (GCPs) coordinates or, when available, on camera position and attitude (the latter very useful and common using aerial data where the acquisition is connected to GNSS and an IMU).
The approach of Photoscan in this part of the data processing allows to define a simple affine transformation to the final model in order to minimize the error or using the camera alignment optimization based on camera or GCP coordinates to fix non-linear distortions of point cloud model (the so called blow effect, Figure 2). In this step, probably Photoscan performs an adjustment based on Gauss-Markov linear model. This approach differs from the standard aerial photogrammetric approach, in which georeferencing - which is achieved by the traditional Bundle Block Adjustment (BBA), sometimes assisted by data from a GNSS IMU system used for direct photogrammetry (Jacobsen 2004) precedes the 3D model generation.
Figure 2. A view of the blow effect
A different approach is performed by MicMac, which is a simplified software derived from the original implementation of Apero (Pierrot-Deseilligny and Paparoditis 2006).
Using this approach the surface measurement and reconstruction is formulated as an energy function minimization problem, using a pyramidal processing (Remondino et al., 2013). This strategy that could be defined as hierarchical is followed in order to optimize the results in terms of speed and quality; first the best homologous points are founded using highly subsampled set of images that allow to product rough layout data that can be refined step-by-step on images with gradually improving the resolution (pyramidal approach) and moreover enables a reduction of the research area for each pixel. As a result in the workflow, each pyramid level guides the matching at the next, higher resolution, level in order to improve the quality of the matching.
After the first points extraction MicMac allow to use a global method in order to process the entire surface all at once naturally with the disadvantage of the needed time for data processing. In order to optimize this process the developer of MicMac follow the approach of the dynamic programming and the graph cutting methods. These methods consist in looking for the minimum of an energy function made up of one part controlling the similarity between images and another part for the surface regularization to be reconstructed.
Traditionally MicMac allows the user to choose between two different processing strategies, called GeomImage and Ortho. In the GeomImage, the user selects a set of master images for the correlation procedure; then for each candidate 3D point a patch in the master image is identified and projected to all the neighboring images, and a global similarity is derived. Starting from the latest release of MicMac (April 2015) the GeomImage strategy has been improved with the new tool C3DC (QuickMap option) that improves the automation of the complete workflow. In particular the masking strategy has been improved including the possibility of making a 3D mask on the point cloud in order to speed up this part of the process.
Finally using TiPunch and Tequila the mesh using the well known Poisson algorithm (Kazhdan, et al 2006) and the texture could be generated as well.
On the other hand in the Ortho strategy, a voxel is defined according to the block size and camera-to-object distance; then every candidate 3D point is back-projected onto images and global similarity is derived.
Summarizing the pipeline of MicMac firstly consists in the tie-point extractions (Tapioca). In this first step a modified version of the SIFT algorithm is used for the computation of the TiePoints (Pierrot-Deseilligny and Cléry, 2011).
After this step the orientation and the camera parameters are computed. In this part two main different strategy could be followed in order to obtain a correct survey (with known dimensions). The simplified strategy after the relative orientation and camera calibration using Tapas allow to set-up the scale and an orientation to the object in order to transform the results from image coordinate to the real word using Bascule.
The second strategy is more oriented to the photogrammetric approach and allow to perform a traditional BBA (Campari) using the ground control points or pose centre coordinates (often employed in aerial photogrammetry) (Chiabrando et al., 2014). In the performed tests this second strategy has been followed.
Subsequently, a dense image matching for surface reconstruction is realized using a tool called Malt. The dense DSM is achieved starting from the derived camera poses and multi-stereo correlation results. Each pixel of the master image is projected in object space according to the image orientation parameters and the associated depth values. For each 3D point a RGB attribute from the master image is assigned (Pierrot-Deseilligny et al., 2011). Finally the single true orthoimages are generated using the same tool. After these step in order to achieve some final products an orthophoto mosaic using Tawny or a complete point cloud using Nuage2Ply could be generated as output (Mouget and. Lucet, 2014).
3.1. Orthophoto and Cultural Heritage documentation Thanks to the above-mentioned advances in the fields of computer vision and photogrammetry, as well as the improvements in processing power, it is currently possible to generate true orthophotos of large, almost randomly collected aerial photographs in an increasingly automatic way (G. Verhoeven et al., 2012).
The orthophoto is a very useful product for Cultural Heritage documentation since in this metric product is possible to combine radiometric information with real measure allowing a complete representation from every point of view (both terrestrial and aerial) of the analyzed object. Moreover, from the point of view of the actors involved in the restoration or requalification project this is a fundamental support for mapping materials, deteriorations or other important effects that damage a CH under investigation (Koska, et al., 2013;Rijsdijk, 2014).
Finally, using the achieved orthophoto it is possible to integrate traditional drawings with more descriptive information, also using this data as texture for virtual reality based application and 3D modeling purpose.
Today all the software based on matching approach allow to quickly and easily generate orthophotos but an accurate check is always necessary in order to understand their final real accuracy. To do this it is necessary to use several points not employed for image orientation and adjustment in the matching software. In order to check the accuracy of orthophotos generated by the two used software, some tests were realized on three different data set that cover the main areas of application for Cultural Heritage documentation. The case study are constituted by aerial data, by UAV, and close range data at different scale (from façade, vault and ceiling to object acquired from short distances).
4. EXPERIMENTAL SECTION
4.1. The hall of honour of the Stupinigi
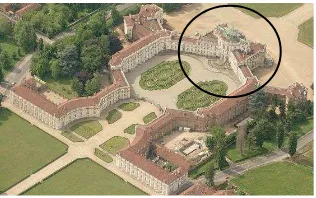
The first test was carried out on the vault of the hall of honour of the Stupinigi royal estate (TO, Italy), realized by the architect Filippo Juvarra for the Royal House of Savoy as a country residence for hunting from 1729 onwards (Figure 3).
Figure 3. The Stupinigi royal estate (in the circle the royal hall)
The hall of honor was the meeting point for hunting expeditions and it was also used for royal ceremonies. It is composed of an oval-based two-floor cylinder, closed by a vault composed of a rib vault in the centre and four bowl-shaped vaults linked together by plane surfaces and arcs. The hall is decorated with frescoes in trompe-l’oeil technique painted architectural frame. Moreover, most of the architectural elements in the hall (columns, capitals, friezes, and so on) are not sculpted but the relief is painted onto a smooth, plastered surface. Valeriani brothers from Venice under the direction of the architect, scenographer Filippo Juvarra, painted frescoes.
In the hall detailed metric surveys were carried out with a laser scanner clouds processing and orthophoto applications obtained by digital photogrammetry algorithms. The various data were processed in a unique, local coordinate system using a reference network of 9 points situated in the hall, partly at ground level and partly on the balcony on the first floor. Traditional high-precision total stations were used with redundant and reliable schema of traditional topographic measurements and the network was adjusted using the least squares method in order to reduce instrumental residuals and to control accidental errors. These points were used as the reference for measuring all the Ground Control Point coordinates, both through the positioning of targets and by collimating the natural points on the decorations.
High resolution photogrammetric images were acquired of the decorations and decorated surfaces in order to obtain a large scale model of the decoration details. For this purpose, a calibrated photogrammetric Canon EOS-1Ds Mark II camera with the following characteristic was used: Pixel size 7.2 x 7.2
m, sensor size 24x 36 mm, equipped with a 20 mm focal lens. The vault system was acquired by means of 19 nadir images from scaffolding about 8 meters above the ground floor arranged in the shape of a cross along the two axis of the hall. They overlap each other by about 80-90% and most of the surface is included in more than 9 images.
Since it was impossible to place some targets directly on the vault, some natural points, identified on the decoration drawings, were measured using topographic instrumentation, in order to reference the processing products to the local coordinate system of the whole object.
The images of the vault were processed using the two different software tools, naturally after the orientation phase some control points have been introduced in all the images in order to
orientate the model in the same coordinate system and estimate the accuracy of the final output.
A strict selection was performed on used GCPs on the vault since they were natural points identified from the details of the frescoes at ground level. The level of accuracy achievable in these conditions, without targets and shaded drawings as reference points, and their level of accuracy was not optimal. This problem was solved by measuring superabundant GCPs in order to be able to select the best ones. After this, the processing can be run again to obtain the optimization of the orientation in Photoscan and the BBA in MicMac and finally to extract the final products.
In MicMac the first step has been the computation of tie points (TPs) from all pairs of images, the second step has been the external orientation (with the camera calibration), following which a complete bundle block adjustment has been carried out using GCPs. Finally, multi image matching has been performed to generate the dense DSM. The last step has been the generation of the true orthophoto mosaic and the realization of the point cloud .
Table 1 shows the synthetic results of Photoscan and MicMac processing.
Photoscan MicMac
Number of images 19 19
Pose Distance 14.412 m 14.412 m
GSD 4.4 mm/pix 4.4 mm/pix
Coverage area 385.1 mq 385.1 mq
Tie points 119951 130029
Extracted points 4572658 4294953
Table 1 - Results of Photoscan (high settings) and MicMac model reconstruction processing
Finally starting from these points the DSM and the orthophoto of the vault was achieved. In the following figure 4 an achieved orthophoto with 2D drawing and contours is reported.
Figure 4. Orthophoto integrated in a 2D representation with contours (c)
4.2. The frieze of the Roman arch of Augusto in Susa
A second test case consisted in the photogrammetric survey of the frieze of the Roman Arch of Susa (Figure 5).
located in the area of the fortress, including the ruins of the Praetorium, the Aqueduct and the Arch of Augustus, which stands on the Roads of the Gauls. The Arch is in an excellent state of preservation and has a frieze and an inscription which remind the alliance between Celtics and Roman people.
Figure 5. The arch of Augusto in Susa
A multi-sensor complete survey was performed in 2013. The work has been supported by Politecnico di Torino with 5x1000 funds and by some local authorities (the Piedmont Region, City of Susa, local cultural associations). The photogrammetric survey of the arch have been focused on the frieze portion and has been fulfilled using a lift truck. A calibrated photogrammetric Canon EOS 5D Mark 2, with a 24 mm focal lens, ensuring an overlapping of 80-90% between adjacent images have been used. At the same time, several targets (GCPs) have been placed and measured on the frieze with a total station from a specific micro geodetic network (previously measured using GNSS techniques). As performed for the vault of Stupinigi, the data acquired were processed using both Photoscan and MicMac. In Table 2 the information about the achieved point clouds are reported.
Photoscan MicMac
Number of images 45 45
Pose Distance 7.01 m 7.01 m
GSD 1.90 mm 1.90 mm
Coverage area 61.67 mq 61.67 mq
Tie points 229195 806847
Extracted points 12488000 17777999
Table 2 - Results of Photoscan (high settings) and MicMac model reconstruction processing
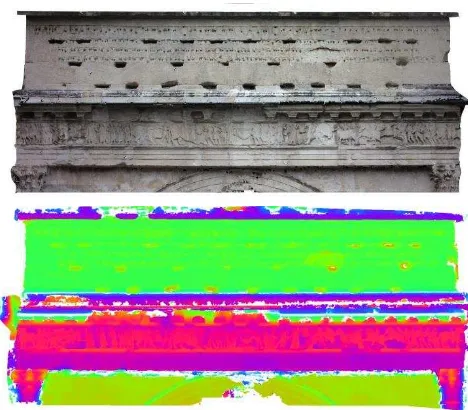
Figure 6. The achieved orthophotos and DSM (MicMac above and Photoscan below)
The achieved orthophotos and DSM are reported in the above figures. It is possible to notice that in this case Photoscan has allowed to obtain a most excellence radiometric equalization.
4.3. Domus of Putti Danzanti in Aquileia
The last analyzed case study is constituted by the archeological excavation of Aquileia (UD - Italy). The surveyed area contains the remains of the roman domus of Putti Danzanti and a portion of an ancient roman street (cardo) made up of a stone pavement, which shows the typical humpback section for the refluent water drainage.
The “Domus of Putti danzanti” is named after the polychrome mosaic with cupids found in the private dominus rooms. It is located in a very important area of the old city, right between the Forum and the river port. (Fontana F., et al., 2012)
Starting from 2011, the structures remains of the domus of Putti danzanti and the cardo have been object of a complete laser scanning and UAV photogrammetric survey achieved by the Geomatic group of Politecnico di Torino as a combined educational and research project (Chiabrando., et al., 2013). The UAV used in the 2011 flight over the domus consists of a low cost vertical take-off and landing: multi-rotor platform (HexaKopter) produced by Mikrokopter. It is equipped with enhanced technologies (remote pilot, GPS receiver, inertial sensors etc.) and it is able to achieve autonomous flight following predefined routes and, obviously, it is able to collect controlled images. The UAV was equipped with a mirror less camera a NEX – 5 with a pixel size of 5.22 µm and a 16 mm focal length. Since an high accuracy were required for the documentation purpose a very low flight was planned and performed with the employed platform (20 m).
In the following table 3 the information about the achieved point clouds are reported.
LPS Photoscan MicMac
N. of images 100 129 129
Flying altitude 20.2081 m 20.2081 m 20.2081 m
GSD 5.8 mm 5.8 mm 5.8 mm
Coverage area 6121,16 mq
6121,16 mq
6121,16 mq
Tie points 250 982601 1523654
Extracted points - 29672734 41479604
Table 3 - Results of LPS, Photoscan and MicMac process
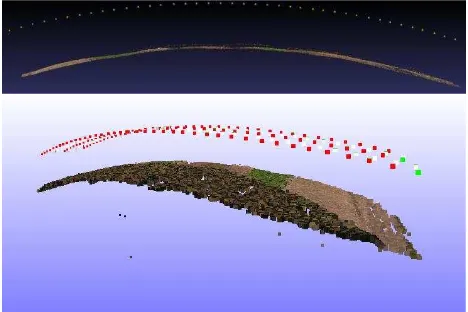
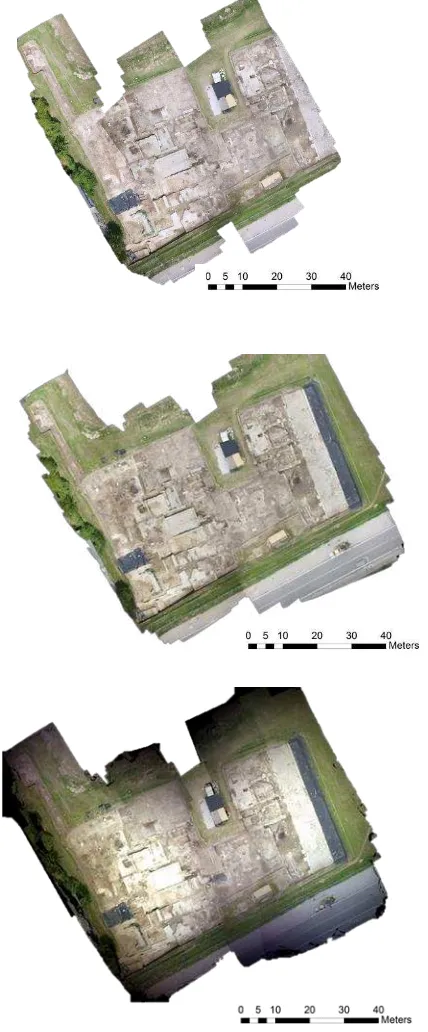
In the following figures the three achieved orthophotos are reported.
Figure 7. LPS, Photoscan and MicMac orthophoto.
4.2. Accuracy assessment
Finally, once the orthophotos have been processed, it has been possible to evaluate and compare their accuracy. This test has been carried out measuring the discrepancy (planimetric vector) between several check points previously measured with a Total station (the number of employed check points for each data set is reported in the following table) not employed in the orientation process and clearly visible in the orthophotos. In the following table 4 the discrepancies are reported.
PHOTOSCAN N. Check Points
Min Res.
Max
Res. RMSE
Stupinigi 19 0.002 m 0.009 m 0.005 m
Frieze 22 0.001 m 0.003 m 0.001 m
Aquileia 19 0.044 m 0.168 m 0.11 m
MICMAC
N. Check Points
Min Res.
Max
Res. RMSE
Stupinigi 19 0.002 m 0.031 m 0.01 m
Frieze 22 0.001 m 0.003 m 0.002 m
Aquileia 19 0.007 m 0.174 m 0.08 m
LPS
N. Check Points
Min Res.
Max
Res. RMSE
Aquileia 19 0.003 m 0.015 m 0.009 m
Table 4. Accuracy assessment of the achieved orthophotos
5. DISCUSSION
orrection of the images in Photoscan is quite superior but only when the radiometric discrepancy between the different poses are clearly visible (Figure 7). This aspect needs to be deeper investigated in MicMac since the orthomosaic were generated with default parameters. Furthermore a short consideration related to the orthophoto generated using a traditional semi-automatic digital photogrammetric software (LPS from Leica): as it is shown in table 4, the accuracy achieved with such traditional method was the best; this means, from our point of view, that the traditional photogrammetric approach is even more reliable and sometimes this could be still the best solution for a complete and accurate 3D survey. In conclusion is possible to state that we are assisting to a complete integration between SfM techniques with traditional digital photogrammetric ones. The future improvements need to be focused on the possibility of inserting or editing (manually) the Tie Points in order to enhance the orientation part when the automatic extraction fail and in the 3D drawing realization (digital plotting) that is even now required for CH documentation.
ACKNOWLEDGEMENTS
The authors should acknowledge all the other professors, researchers and students involved in data acquisition and processing. In particular: Prof. A. Spanò, Prof. A. Lingua, Arch. F.Noardo, Ing. I. Aicardi, Geom. P.Maschio and all the students of team Direct.
REFERENCES
Bay, H., Tuytelaars, T., Van Gool, L., 2006.. Surf: Speeded up robust features. In Computer vision–ECCV 2006, Springer Berlin Heidelberg, pp. 404-417.
Chiabrando, F., Fontana, F., Spano’, A., Murgia, E., 2013. 3D models from reality based survey techniques: the domus of “Putti danzanti” in Aquileia. In: Atti della XII International Conference of AIPMA, Context and Meaning, Athens, Greece, Vol. XVI-XX.
Chiabrando, F., Lingua, A., Noardo, F., Spanò, A., 2014. ISPRS Technical Commission V Symposium, 3D modelling of trompe l’oeil decorated vaults using dense matching techniques. In: ISPRS Annals of the Photogrammetry, Remote Sensing and Spatial Information Sciences, Riva Del Garda, Italy, Vol. II-5, pp. 97-104.
Fontana, F., Murgia, E., 2012. La domus dei "Putti danzanti" lungo la via Gemina: alcuni elementi dell'apparato decorativo. In: J. Bonetto, J., Salvadori, M., (a cura di), L’architettura privata ad Aquileia in età romana, Atti del convegno di studio, Padova, Italy, pp. 297-308.
Jacobsen, K., 2002. Calibration aspects in direct georeferencing of frame imagery. In: ISPRS Archives Vol.34(1), pp. 82-88.
Hirschmuller, H., 2011. Semi Global Matching – Motivation, Developments and Applications, Photogrammetric Week, Stuttgart, Germany, pp. 173-184.
Kazhdan, M., Bolitho, M., & Hoppe, H. 2006. Poisson surface reconstruction. In Proceedings of the fourth Eurographics symposium on Geometry processing, Vol. VII.
Koska, B., Kremen, T., 2013. The combination of laser scanning and structure from motion technology for creation of accurate exterior and interior orthophotos of St. Nicholas baroque church. In: International Archives of the
Photogrammetry, Remote Sensing and Spatial Information Sciences, Trento, Italy, Vol. XL-5/W1, pp. 133-138.
Krooks, A., Kahkonen, J., Lehto, L., Latvala, P., Karjalainen, M., Honkavaara, E., 2014. WebGL Visualisation of 3D Environmental Models Based on Finnish Open Geospatial Data Sets. In: The International Archives of the Photogrammetry, Remote Sensing and Spatial Information Sciences, Zurich, Switzerland, Vol. XL-3, pp. 163-169.
Lingua, A., Marenchino, D., Nex, F., 2009. Performance Analysis of the SIFT Operator for Automatic Feature Extraction and Matching in Photogrammetric Applications, Sensors, 9, ISSN 1424-8220, www.mdpi.com/journal/sensors, pp. 3745-3766.
Lowe, D. G., 2004. Distinctive Image Features from Scale-Invariant Keypoints, International Journal of Computer Vision, 60(2), pp. 91–110.
Mouget, A., Lucet, G., 2014. Photogrammetric archaeological survey with UAV. In: ISPRS Annals of the Photogrammetry, Remote Sensing and Spatial Information Sciences, Riva Del Garda, Italy, Vol. II-5, 251-258.
Pal Singh, S., Jain, K., Mandla, V. R., 2014. A new approach towards image based virtual 3D city modeling by using close range photogrammetry, In: ISPRS Annals of the Photogrammetry, Remote Sensing and Spatial Information Sciences, Riva Del Garda, Italy, Vol. II-5, pp. 329-337.
Pierrot-Deseilligny, M., & Paparoditis, N. 2006. A multiresolution and optimization-based image matching approach: An application to surface reconstruction from SPOT5-HRS stereo imagery. In: International Archives of Photogrammetry, Remote Sensing and Spatial Information Sciences, 36(part 1), w41.
Pierrot-Deseilligny, M., De Luca, L., Remondino, F., 2011. Automated image-based procedures for accurate artifacts 3D modelling and orthoimage generation, Geoinformatics FCE CTU Journal, 6.9.
Remondino, F., Spera, M. G., Nocerino, E., Menna, F., Nex. F., 2014. State of the art in high density image matching. The Photogrammetric Record, 29.146, pp. 144-166
Rijsdijk, M., 2014. Full Automatically Generated True Orthophotos, Sensational 3D Pointclouds and Dense Matching Techniques in Topographical Mapping. In: FIG Congress Engaging the Challenges, Kuala Lumpur, Malaysia.
Szeliski, R., 2010. Computer Vision: Algorithms and Applications. Springer Science & Business Media
Verhoeven, G., 2011. Taking Computer Vision Aloft - Archaeological Three-dimensional Reconstructions from Aerial Photographswith Photoscan, Archaeological Prospection, 18, pp. 67-73.
Verhoeven, G., Taelman, D., Vermeulen, F., 2012. Computer vision based orthophoto mapping of complex archaeological sites: the ancient quarry of Pitaranha (Portugal-Spain), Archaeometry. 54.6, pp. 1114-1129.