VULNERABILITY ASSESSMENT USING LIDAR DATA
IN SILANG-STA. ROSA SUBWATERSHED, PHILIPPINES
M. A. Bragais a*, D. B. Magcale-Macandoga, J. L. Arizapa b, K. M. Manalo b
a Institute of Biological Sciences, University of the Philippine Los Baños, College, Laguna 4031, Philippines; [email protected]
b College of Human Ecology, University of the Philippines Los Baños College, Laguna 4031, Philippines
Commission VIII, WG VIII/1
KEY WORDS: LiDAR DEM, unsteady flow analysis, disaster and risk adaptation and mitigation, watershed management
ABSTRACT:
Silang-Sta. Rosa Subwatershed is experiencing rapid urbanization. Its downstream area is already urbanized and the development is moving fast upstream. With the rapid land conversion of pervious to impervious areas and increase frequency of intense rainfall events, the downstream of the watershed is at risk of flood hazard. The widely used freeware HEC-RAS (Hydrologic Engineering Center- River Analysis System) model was used to implement the 2D unsteady flow analysis to develop a flood hazard map. The LiDAR derived digital elevation model (DEM) with 1m resolution provided detailed terrain that is vital for producing reliable flood extent map that can be used for early warning system.
With the detailed information from the simulation like areas to be flooded, the predicted depth and duration, we can now provide specific flood forecasting and mitigation plan even at community level. The methodology of using 2D unsteady flow modelling and high resolution DEM in a watershed can be replicated to other neighbouring watersheds specially those areas that are not yet urbanized so that their development will be guided to be flood hazard resilient. LGUs all over the country will benefit from having a high resolution flood hazard map.
1. INTRODUCTION
The Silang-Sta. Rosa subwatershed is threatened by increasing surface runoff due to ongoing urban sprawl in the downstream to the upstream of the watershed. The increased impervious surfaces lessen water infiltration and promotes higher surface runoff that generates flooding in the low-lying areas of the watershed. The upstream areas of the watershed are now being converted into built-up areas, hence the perennial flooding in the downstream areas of the watershed is expected to worsen unless effective mitigation and adaptation measures are conducted. The local government units (LGUs) are finding ways to mitigate flood hazard especially with the threat of increasing intensities of rainfall events which is one of the effects of climate change. To help the LGUs in their mitigation and adaptation measures, accurate and scientific approach should be implemented. With the help of high resolution maps, reliable projections and effective disaster and risk adaptation and mitigation activities can be implemented at the community level.
The strategy of having high resolution maps for better planning have been initiated by the government in the past years. One of the major efforts is the adaptation of the LiDAR (Light detection and ranging) technology which started in 2011 through the Disaster Risk and Exposure Assessment for Mitigation (DREAM) Program of the Philippine government. The DREAM program was formed by the Department of Science and Technology (DOST) and the University of the Philippines Diliman to produce finer-scale flood hazard maps and inundation models for 6-hour early warning system for the 18 major river basins in the country using the airborne LiDAR technology. In 2013, the Phil-LiDAR 1 project was formed which is to expand the coverage the DREAM program not only
in the critical river basins but for most of the floodplains in the country. Fortunately, the downstream of the Silang-Sta. Rosa subwatershed have LiDAR data coverage, however it is not yet included in the priority areas for flood hazard mapping of the Phil-LiDAR 1 project.
Since the downstream of Silang-Sta. Rosa subwatershed is perennially flooded, the use of the available LiDAR data was requested and a separate flood modelling and research study was conducted. Unlike the methodology of the Phil-LiDAR 1 which uses only one-dimensional (1D) unsteady flow analysis of the HEC-RAS software, two-dimensional (2D) unsteady flow analysis was implemented for the majority of the downstream of the subwatershed.
2. METHODOLOGY
2.1 The Study Site
The study was conducted in Silang-Sta. Rosa subwatershed in the province of Laguna and Cavite, Philippines (14°17’50” N, 121°05’40” E). It is located at the western portion of the Laguna Lake Basin and administratively composed of the cities of Biñan, Sta. Rosa, and Cabuyao in the province of Laguna; and Silang Municipality and Tagaytay City in Cavite province (Figure 1).
Figure 1. Location map of the study area.
The subwatershed is divided into two parts, the upstream and the downstream. The upstream, located in parts of Silang and Tagaytay in Cavite, has a gradually sloping terrain while the downstream in Biñan, Santa Rosa, and Cabuyao part is characterized as flood plains. Areas in the upstream are mostly agricultural planted with coffee, pineapple, banana, coconut and root crops as major crops while areas in the downstream part are characterized by industrial and residential built-up areas with dispersed patches of lowland rice areas and grasslands.
2.2 Data Collection
Secondary data like climate, soil, and socioeconomic were obtained from Comprehensive Land Use Plans (CLUP) of Sta. Rosa, Biñan, Cabuyao, and Silang. Some geographical data like boundary shapefiles were downloaded from www.gadm.org.
Primary data were collected at the subwatershed through actual field measurements. Precipitation data was measured through an Odyssey tipping bucket rain gauge (TBRG) stationed inside the subwatershed, at Barangay Pooc I, Silang, Cavite. The TBRG was calibrated to tip with every 0.2 mm of rainfall collected. Water level, on the other hand, was recorded using the Odyssey capacitive water level logger (CWLL) mounted at the watershed outlet in Macabling dam, Santa Rosa City. Both the TBRG and CWLL were visited every other week to download the measurements into a personal computer.
Additional actual precipitation and discharge are available from the Department of Science and Technology (DOST) data repository available in the internet (repo.pscigrid.gov.ph). These data are being collected by rain gauges and stream gauges stationed throughout the country used by DOST Project Noah (noah.dost.gov.ph). There are three available rain gauges and two stream gauges near/inside the SSR subwatershed. The rain gauges are located in Silang, Cavite in the upstream; Carmona, Cavite in the midstream; Sta. Rosa, Laguna in the downstream. While the two stream gauges are located in the Technopark Bridge, Sta Rosa, Laguna in the midstream and in the Macabling Dam, Sta Rosa, Laguna in the Downstream (Figure 2).
Figure 2. Available rain gauges and stream gauges
2.3 LiDAR Data
Light detection and ranging or LiDAR data was used to achieve better resolution for the flooded area. The data was requested from the Phil-LiDAR project which is a national project of the Department of Science and Technology-Grants-in-Aid (DOST-GIA) with the aim of a detailed assessment of resources towards better disaster mitigation (Phil-LiDAR 2) and to develop 3D hazard maps for the Philippine river systems (Phil-LiDAR 1).
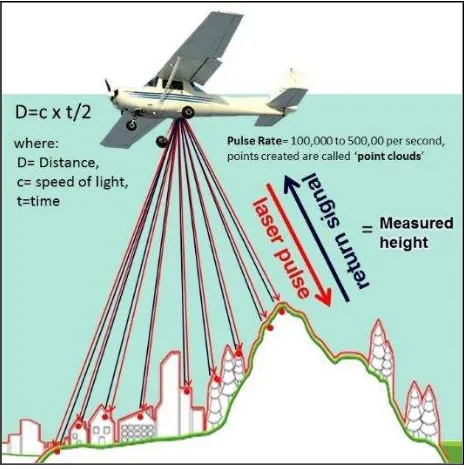
The LiDAR technology is an emerging remote sensing tool capable of providing spatial data and information for hazard assessments, disaster risk management, flood modelling, urban development and site assessments. The Phil-LiDAR project uses airborne LiDAR technology which means, it uses a small airplane to scan the area and measure the distance on the ground using the reflected laser light (Figure 3). It provides accurate and precise elevation and surface models which is needed for detail flood simulation.
Figure 3. Airborne LiDAR data acquisition
The LiDAR system measures time converted to distance (D) as
shown in Equation 1. The measured points called “point clouds” (Figure 4) are recorded for further processing to produce LiDAR DEM like digital terrain model (DTM) and digital surface model (DSM).
D= c x t /2 (1)
where D = distance c = speed of light t = time
Figure 4. LiDAR point cloud processing using LAStools software
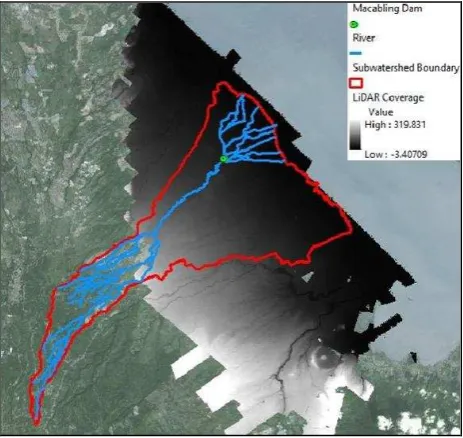
The LiDAR derived DTM in the downstream of Silang-Sta. Rosa subwatershed (Figure 5) was requested from the Phil-LiDAR project. This high resolution DTM was used for the hydraulic modelling in downstream of the subwatershed to produced detailed flood extent or inundation map.
Figure 5. LiDAR data coverage in the downstream of the subwatershed
2.4 Modelling
The study used HEC-RAS (Hydrologic Engineering Center-River Analysis System), a freeware designed and coded by the Hydrologic Engineering Center, for one dimensional and two dimensional hydraulic analysis for steady and unsteady flow in rivers (www.hec.usace.army.mil). HEC-RAS uses the hydrograph produced using HEC-HMS (Hydrologic Engineering Center-Hydrologic Modeling System) as input for the volume of water that will flow in the downstream.
The LiDAR derived DTM was also used for visualization using the ArcScene software from ArcGIS package to show the water flow in 2D or 3D views. The flood extent was validated using the existing flood hazard map of the Mines and Geosciences Bureau (MGB) dated 2008.
2.5 2D Unsteady Flow Analysis
The two dimensional (2D) unsteady flow analysis is one of the new offerings from HEC-RAS. Aside from the usual one dimensional (1D) unsteady flow analysis, modellers can now perform 1D unsteady flow modelling, 2D unsteady flow modelling, as well as combined 1D and 2D unsteady flow routing. For this study, 1D channels with 2D floodplain areas was used to capture the characteristics of the floodplain. The 2D methodology which uses mesh for the whole floodplain is ideal for the characteristics of the Silang-Sta. Rosa subwatershed where there are a lot of tributaries branching out from the main river. The program uses two equations, either the full 2D Saint Venant equations or the 2D Diffusion Wave equations. The modeller can easily switch from the two equations but for this particular study, the 2D Diffusion Wave equations was used since it allows the software to run faster, and have greater stability properties. It is the more flexible equation thus we can use larger time steps for the simulation.
This new technique also provides detailed flood mapping and flood animations. It is offered by the new RAS Mapper features which is based on the detailed underlying terrain provided by the LiDAR DTM. The wetted area will be based on the details of the LiDAR DTM, and not the computational mesh cell size.
2.6 Parameterization
Tributaries, land cover, soil, and precipitation components were gathered to characterize the subwatershed. These data were either primary (field measured or computer generated) or secondary (from literature) in nature. The tributaries were generated using both LiDAR data and Google earth images. The curve number were generated using the 2014 land cover classified by Johnson et al. (2015) and soil type from DREAM program (2011).
The data were processed using Arc GIS 10.0, Google Earth, Microsoft Office Excel, and GIS extensions like HEC
3. RESULTS AND DISCUSSION
3.1 Modelling
Inputs for HEC-HMS were prepared using ArcMap 10.0 software, specifically the software extension HEC Geo-HMS was used to generate basin model (Figure 6).
Figure 6. Basin model generation
Basin model contains the characteristics of the upstream part of the watershed specifically its terrain, land cover, tributaries, and soil characteristics. Rainfall-runoff simulation was implemented using HEC-HMS with the generated basin model, observed precipitation, and observed discharge data as inputs.
The output from the HEC-HMS is the rainfall-runoff curve as shown in Figure 7. The calibrated discharge volume (computed outflow) was used as input in HEC-RAS modelling to develop a flood extent map in the downstream.
Figure 7. HEC-HMS results with the generated rainfall-runoff curve
To have a detailed simulation, the LiDAR derived DTM was used as the terrain input. Channel characteristics were lifted from the S3R2 (2012) study and digitized from Google Earth (Figure 8).
Figure 8. Input terrain and tributaries
The roads and other structures blocking the streams were removed in the input raster (downstream DTM). The raster modification was done using spatial analyst tools in ArcGIS 10.0 software to eliminate the obstructions in the streams. The modified terrain was used in the hydraulic modelling to facilitate the discharge flow in the downstream.
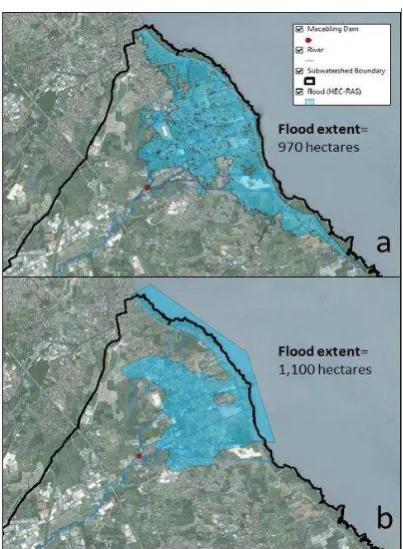
The two dimensional (2D) unsteady flow analysis offers easier floodplain set up as sown in Figure 9. In 1D analysis, several cross-section lines should be constructed to acquire the characteristics of the floodplain. While in 2D analysis, only a mesh covering the whole floodplain should be constructed to define the characteristics of the target are. The 2D methodology is ideal for the characteristic of the Silang-Sta. Rosa subwatershed where there are a lot of tributaries branching out
from the main river and forms several outlets. The 2D method is easier to execute and provides greater stability in the simulation.
Figure 9. Comparison between the 1D (a) and 2D (b) methods
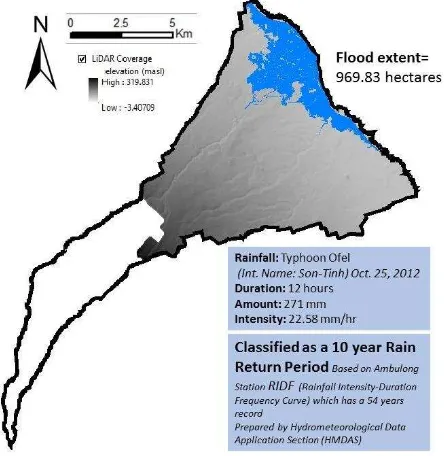
The simulation using the 2D unsteady flow analysis was successfully executed. The model run was stable and resulted to a more reliable flood extent covering approximately 970 hectares in the floodplain of the subwatershed (Figure 10).
Figure 10. Flood extent map using the 2D unsteady flow analysis
The area where the flooding occurs was overlain to the MGB’s flood hazard map to visually validate the result. It falls inside flood hazard map and provides finer information to where exactly the flood will occur (Figure 11). The temporal aspect can also be analysed using the animation feature of the software.
Figure 11. Flood extent map using the 2D unsteady flow analysis (a) and MGB susceptibility map (b)
3.2 Visualization
The flood model was visualized using RAS Mapper tool in HEC-RAS were in the flood water is shown in 2D overlain in the terrain from LiDAR DTM. For a more detailed visualization, the ArcScene software offers 3D visualization and animation function (Figure 12). LiDAR DTM and 1 meter resolution orthophoto were used to create realistic and detailed terrain of the area. The 3D visualization and animation enables the planners to see the submerged areas at a given flood height and time.
Figure 12. 3D visualization of the flooded area using ArcScene
4. CONCLUSIONS
The Philippines is being hit by about 20 typhoons every year. Up-to-date and detailed flood hazards map is needed for better risk reduction and mitigation strategies. Rain-generated floods are more apparent in urban areas where ground surface are mostly impermeable, thus, runoff generation is faster. Low lying urbanized areas, like the City of Biñan, Santa Rosa, and Cabuyao have suffered flooding in recent typhoon events.
The initiative of the Philippine government to have higher resolution data through the DREAM and Phil-LiDAR programs will benefit the whole country especially at the community level. The LiDAR derived DTM provides finer resolution which is very critical in inundation mapping in the watershed. The use of HEC RAS 2D unsteady flow analysis is one effective way of utilizing the LiDAR DTM. The 2D unsteady flow analysis proves to be more efficient to use in areas with complicated downstream tributaries. Simulation set-up needs minimal effort and the simulation run shows greater stability. This characteristic is very important in mainstreaming this kind of technology. The methodology can be easily replicated in other similar areas. The study will be very useful for the local government in risk reduction planning and environmental impact assessment. Output from this study will be used as input for the detailed impact analysis study using LiDAR classified land cover of the subwatershed.
ACKNOWLEDGEMENTS
The author would like to thank the Department of Science and Technology (DOST), the University of the Philippines Diliman, the DREAM program, the Municipality of Silang, Cities of Biñan, Santa Rosa, and Cabuyao and the UPLB Phil-LiDAR 2 for all the valuable support in the conduct of this study.
REFERENCES
Brunner, G. W., 2015. HEC‐RAS, River Analysis System, 2D
Modeling User’s Manual Version 5.0. US Army Corps of
Engineers Institute for Water Resources Hydrologic Engineering Center (HEC), 609 Second Street Davis, CA 95616-4687.
Johnson, B. A., M. A. Bragais, I. Endo, D. B. Magcale-Macandog, and P. M. Magcale-Macandog, 2015. Image Segmentation Parameter Optimization Considering Within- and Between-Segment Heterogeneity at Multiple Scale Levels: Test Case for Mapping Residential Areas Using Landsat Imagery. ISPRS International Journal of Geo-Information. 4, 2292-2305.
Scharffenberg, W. A. and M. J. Fleming, 2010. Hydrologic Modeling System HEC-HMS, User’s Manual. US Army Corps of Engineers Institute for Water Resources Hydrologic Engineering Center (HEC), 609 Second Street, Davis, CA 95616-4687.
Tamayo-Zafaralla, M., D. M. Macandog, V. Camacho, L. Vidal, M. Mutia, G. C. Lachica, D. A. Luna, J. C. Miel, and M. V. Sumilang, 2012. Ecological profile of the Silang-Santa Rosa river and a program for the restoration/rehabilitation of its degraded streams. Santa Rosa, Philippines: Submitted to Save Silang-Santa Rosa River Foundation, Inc. (S3R2).
UP-TCAGP, 2015. DREAM LiDAR Data Acquisition and Processing for Lucena River Floodplain, Disaster Risk and Exposure Assessment for Mitigation (DREAM) Program, DOST Grants-In-Aid Program, 55pp.
Warner, J. C., G. W. Brunner, B. C. Wolfe, and S. S. Piper, 2010. HEC-RAS, River Analysis System Applications Guide. US Army Corps of Engineers Institute for Water Resources Hydrologic Engineering Center (HEC), 609 Second Street, Davis, CA 95616-4687.