Road Traffic Accident Analysis of Ajmer City Using Remote Sensing and GIS Technology
Parul Bhalla, Shiva Tripathi, and Sarvesh Palria
Dept. of Remote Sensing and Geo-Informatics
M.D.S. University Ajmer, Rajasthan
Email: [email protected]
KEYWORDS: GIS, Remote Sensing (RS), Global Positioning System (GPS), LULC, Accident Prone site.
ABSTRACT:
With advancement in technology, new and sophisticated models of vehicle are available and their numbers are increasing day by day. A traffic accident has multi-facet characteristics associated with it. In India 93% of crashes occur due to Human induced factor (wholly or partly). For proper traffic accident analysis use of GIS technology has become an inevitable tool. The traditional accident database is a summary spreadsheet format using codes and mileposts to denote location, type and severity of accidents. Geo-referenced accident database is location-referenced. It incorporates a GIS graphical interface with the accident information to allow for query searches on various accident attributes. Ajmer city, headquarter of Ajmer district, Rajasthan has been selected as the study area. According to Police records, 1531 accidents occur during 2009-2013. Maximum accident occurs in 2009 and the maximum death in 2013. Cars, jeeps, auto, pickup and tempo are mostly responsible for accidents and that the occurrence of accidents is mostly concentrated between 4PM to 10PM.
GIS has proved to be a good tool for analyzing multifaceted nature of accidents. While road safety is a critical issue, yet it is handled in an adhoc manner. This Study is a demonstration of application of GIS for developing an efficient database on road accidents taking Ajmer City as a study. If such type of database is developed for other cities, a proper analysis of accidents can be undertaken and suitable management strategies for traffic regulation can be successfully proposed.
INTRODUCTION:
An Accident or a mishap is an unforeseen and unplanned event or circumstance, often with lack of intention or necessity. It usually implies a generally negative outcome which might have been avoided or prevented had circumstances leading up to the accident been recognized, and acted upon, prior to its occurrence. Injury prevention refers to activities designed to foresee and avoid accidents.
A traffic collision, also known as a traffic accident, motor vehicle collision, motor vehicle accident, car accident, automobile accident, road traffic collision, road traffic accident, occurs when a vehicle collides with another vehicle, animal, or other stationary obstruction, such as a tree or utility pole. Traffic collisions may result in injury, death, vehicle damage, and property damage. A number of factors contribute to the risk of collision, including vehicle design, speed of operation, road design, road environment, driver skill and/or impairment, and driver behavior.
Accident analysis is carried out in order to determine the cause or causes of an accident or series of accidents so as to prevent further incidents of a similar kind. It is also known as accident investigation. It may be performed by a range of experts, including forensic scientists, forensic engineers or health and safety advisers. It is observed that most of these accidents result from human error and carelessness on the part of the drivers or pedestrians. However, the probability of
occurrence, and its severity, can often be reduced by the application of proper traffic control devices, and sound roadway design practice. The success or failure of such control devices and design specifications however, depend extensively upon the analysis of traffic accident records at specific locations. It has long been recognized that one of effective means towards accident reduction lies in a systematic and scientific approach based on the use of accurate and reliable traffic accident data.
This research aims to solve this problem by establishing the GIS road accident database for the selected study area, Ajmer city
A Remote Sensing (RS) and Geographic Information Systems (GIS) technology is more useful in management functions and decision support systems which are more helpful in the planning process of urbanization. GIS provides relational link between different streams of accident data – FIR Data, Inventory Data, etc. GIS provides new capabilities of data comparison and analysis that were not available in non-GIS linear reference system GIS enables the safety experts to compare accidents along a road way segment with land use and zoning data or population and other demographic data to gain a better understanding of the relationship of crash incidents or the zone-data could be integrated with accidents records to provide a true picture Visual ability of GIS permits the mapping of FIR data, Inventory data and geometry data.
time and increase in vehicle operating cost. Absence of road hierarchy, non-uniform carriageway of the major traffic carrying corridors, heterogeneous traffic constituting cars, two wheelers, auto rickshaws, animal carriages are the main causes of congestion in the city. Rapid urbanization and increase in vehicles have resulted in the city road networks exceeding their carrying capacity, in turn resulting in to low operating speeds, road safety hazards and environmental pollution. The key constraint for traffic movement along major arterial road network is the absence of an alternative road network. Presently there is only one north-south corridor, which carries almost the entire city traffic between Gandhi Bhawan and Martindale Bridge. The rail network running across the city acts as a major constraint on free flow of traffic because it intersects the road network at a number of locations resulting in regular traffic congestion during peak hours
OBJECTIVES:
The objectives of the study are as follows:
1. Road accident analysis according to yearly, monthly and vehicular variations.
2. To identify the traffic congestion areas at peak time: We will examine the traffic conditions in the areas where the traffic is heavy at a particular time, especially near schools, offices, etc 3. To find the Accident prone site of study area: Here we will find the areas where most of the accidents are caused, as well as we’ll find the major cause of these accidents.
4. To suggest the alternate ways to improve the traffic conditions of study area: We’ll suggest the measures to improve the traffic conditions as well as to decrease the accident rate by decreasing the cause of accidents.
DESCRIPTION OF STUDY AREA:
The historic city of Ajmer is situated in the geographic centre of Rajasthan and lies about 135 kms south-west of the state capital, Jaipur. It stretches from 26˚26’ North to 26˚23’ North and
74˚36’ East to 74˚40’ east. The city of Ajmer is the district
headquarters. Ajmer city has an area of 81.74 km2 and a population of 572,589 (2011 census). City has nine Police Stations and all nine Police Station has been Selected for Study.
Figure 1 Location Map of Study Area
Figure 2 Base Map of Study Area
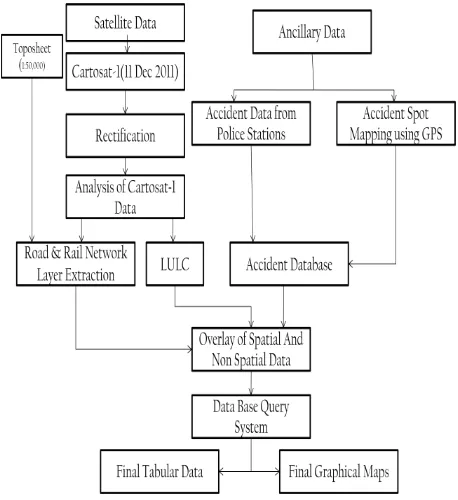
MATERIALS AND METODOLOGY:
In order to conduct the study Cartosat-I satellite data was used to extract road, rail network and to prepare Landuse/Landcover of study area. Other ancillary data used was Police station control area and their boundary and road accident data acquired from Police station. Also GPS positions were taken of accident spots.
Firstly, accidental data from all nine Police Station of Ajmer City was collected. After the collection of accident data, accident spots were mapped using GPS device (Trimble Juno). After mapping of the accidental spots, the database of accident sites was done and verification of the database from Land Use and Land Cover was also done. Then overlay of spatial and non-spatial data, the non-spatial data includes Road Network, Rail Network and LULC where as non-spatial database include data of Accident location. After this, the data base queries through communities in developing countries which require serious attention in searching for preventive measures to minimize this problem. To achieve the sustainable community road accident prevention, an accident database must be firstly established. Lack of accident database leads to the difficulty in searching for proper measures and is the major hindrance to create effective management of road accidents for communities. Present research aims to solve this problem by creating the GIS road accident database for the selected study area. It intends to make systematical use of the hospital's injury surveillance data. On the basis of the data collected, total 1531 accident have recorded according to FIR reports available at various Police Stations, during 2009 to 2013. The accident related information is multi-dimensional in nature, it is not possible to show all the information, and hence as illustration, the distribution of accident is shown as per type of accident only. However, all data characteristics of accident as listed above have been entered into the spatial database.
Table 1: Police Station wise accident data for year 2009-2013 Total Accidents During 2009-2013
Sr. No.
Police Station Total Number of
* The Dargah Police Station Area is No Vehicle Entry Zone
Accident analysis on yearly basis:
Here the query was carried on the whole data set as per year and categorized as per level of injury and concerned Police Station. The procedure for query using ARC GIS in order to show the distribution of different levels of accidents injury under each police station from the years 2009-2013. .It has been observed that the total number of accident for the particular year is more or less same for the other years. However, the number of total accidents and grievous injury is continuously increasing/ moderate. In year 2013, accidents have increased. Maps are a powerful and effective way to show what pattern is occurring with accident data spatially and all the maps were prepared for nine different Police Stations for five different years.
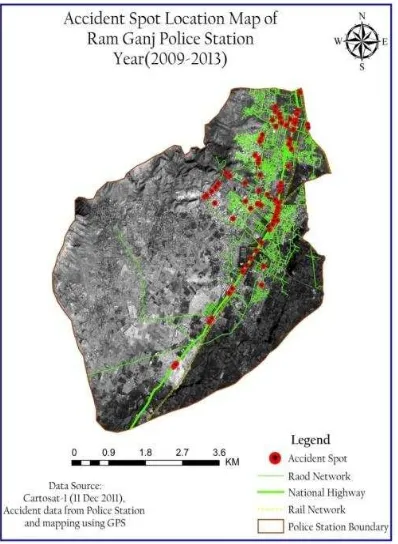
Figure 4: Graph of Accidents of RamGanj Police Station (2009-2013)
Figure 5: Accident Spot Map of Ram Ganj Police Station (2009-2013)
Accidents of Ram Ganj Police
Station
Accident
Figure 6: Graph of Accidents of Adarsh Nagar Police Station (2009-2013)
Figure 7: Accident Spot Map of Adarsh Nagar Police Station (2009-2013)
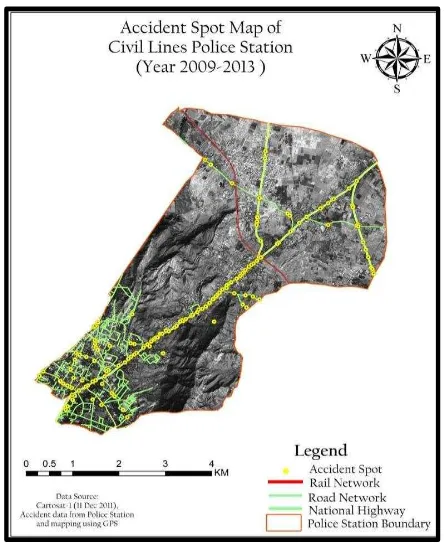
Figure 8: Graph of Accidents of Civil Lines Police Station (2009-2013)
Figure 9: Accident Spot Map of Civil Lines Police Station (2009-2013)
Figure 10: Accident Spot Map of Ajmer City (2009-2013)
0 50 100
2009 2010 2011 2012 2013
Accidents of Adarsh Nagar Police
Station
Accident
0 50 100
2009 2010 2011 2012 2013
Accidents of Civil Lines Police
Station
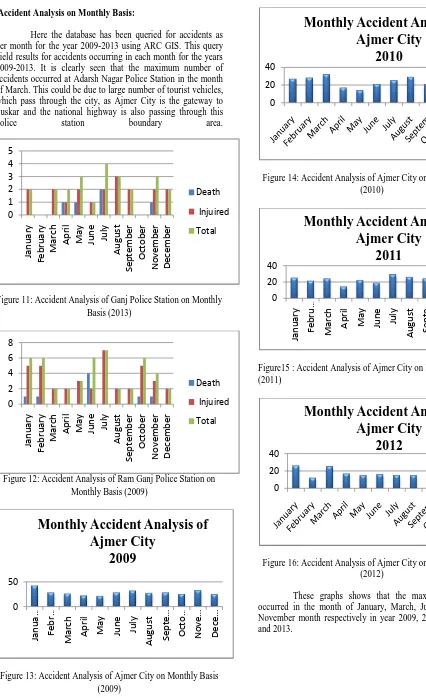
Accident Analysis on Monthly Basis:
Here the database has been queried for accidents as per month for the year 2009-2013 using ARC GIS. This query yield results for accidents occurring in each month for the years 2009-2013. It is clearly seen that the maximum number of accidents occurred at Adarsh Nagar Police Station in the month of March. This could be due to large number of tourist vehicles, which pass through the city, as Ajmer City is the gateway to Puskar and the national highway is also passing through this
police station boundary area.
Figure 11: Accident Analysis of Ganj Police Station on Monthly Basis (2013)
Figure 12: Accident Analysis of Ram Ganj Police Station on Monthly Basis (2009)
Figure 13: Accident Analysis of Ajmer City on Monthly Basis (2009)
Figure 14: Accident Analysis of Ajmer City on Monthly Basis (2010)
Figure15 : Accident Analysis of Ajmer City on Monthly Basis (2011)
Figure 17: Accident Analysis of Ajmer City on Monthly Basis (2013)
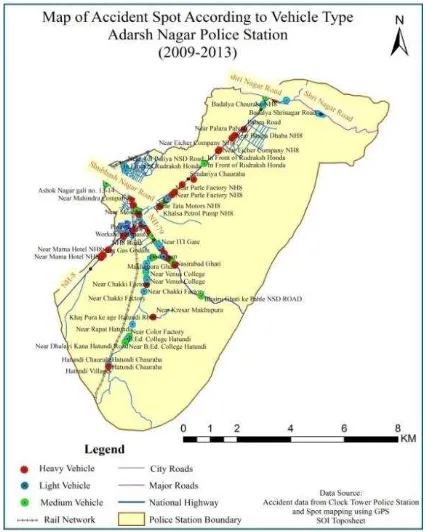
Accident Analysis on Vehicle Basis:
The query to the database is performed using type of vehicle involved in accidents. The vehicles have been classified into three categories:
(a) Heavy Vehicles – Truck, Bus and Tractor. (b) Medium Vehicles – Private Car, Jeep, Van, Auto-Rickshaw, Taxi, Pickup.
(c) Light Vehicles – Motorcycle, Scooter, Cycle.
It can be clearly seen that medium type of vehicles are more involved in accidents as compared to other type of vehicles on the major city roads. This is due to the fact the normally tourists passing through the town travels in Cars, Taxis, Vans and Jeeps. Also light vehicles are next in number with regards to accidents. The possible reason could be the availability of different types of motorcycles and scooters which high engine power and pick up capabilities. Another reason for such high number of accidents involving medium and light vehicles may be due to disregard for traffic rules. The remedial measures for enforcement of traffic rules have to be strictly enforced by traffic police.
On the other side the heavy type of vehicle is mainly involves on the National Highways and many time the accident cause death. This is because many drivers do not follow the highway rules like lane rule.
Figure 18: Accident Spot Map of Adarsh Nagar Police Station on Vehicle Basis (2009-2013)
Figure 19: Accident Spot Map of Kotwali Police Station on Vehicle Basis (2009-2013)
0 20 40
Monthly Accident Analysis of
Ajmer City
Figure 20: Accident Spot Map of Christian Ganj Police Station on Vehicle Basis (2009-2013)
Accident Analysis According to Time:
Accidents display a specific trend as per time of the day. The number of accidents occurred during the evening time is more than in the night time and day time. In this study, the time of accident occurrence has been split into four time stop.
(a) 4 AM to 10 AM – Morning Time (School and Office Rush time).
(b) 10 AM to 4 PM – Day Time.
(c) 4 PM to 10 PM – House wife shopping rush and evening rush time.
(d) 10 PM to 4 AM (next day) – Night time.
The query to the database has been carried out as per time stop and categories as per level of injury incurred. It is observed that maximum number of accidents occurred during 4 PM to 10 PM and may be attributed to the combined rush in evening along with poor lighting. This gives a clear indication that proper traffic management along with proper street lighting is required.
Figure shows the total accidents occur in Ajmer City according to time. And it shows that the peak time of accidents in city is 4 PM to 10 PM.
Figure 21: Accident Spot Map of Ajmer City at Peak Hours (2009-2013)
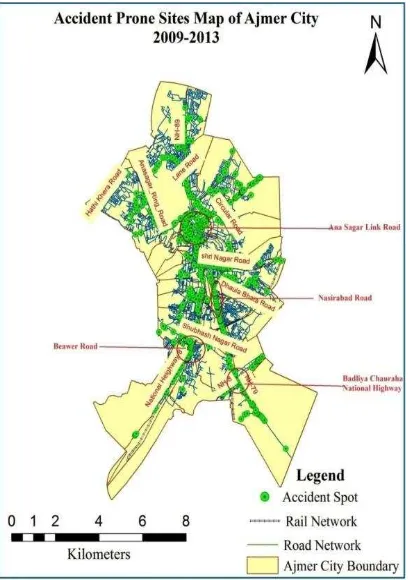
Accident Prone Site of Study Area:
On the basis of total number of accidents occurs at Ajmer city, it is observed that maximum accidents occurred at Ana Sagar Link Road, Nasirabad Road, Near Badliya Chauraha NH-8 and Beawar Road. The cause of accidents are the busy route of city because the tourists come here to see Ana Sagar and for worship at Dargah and this road is also the gate way to Pushkar. Nasirabad Road, Badliya Chauraha and Beawar Road are the main roads to connect the city with Highways.
CONCLUSION:
We have prepared the database of accidents of Ajmer City and finally we observed that maximum accident the area. Also, we found that maximum accident area also caused because common people do not follow the proper traffic rules and thus they face accident. So the common people should follow the proper traffic rule and the local government also needs to prepare a proper plan to reduce the accident rate. The study clearly indicates there is an urgent need to adopt proper traffic management procedures to check the growth of accidents. Nearly 23% of accidents cause death. GIS has proved to be a good tool for analyzing multifaceted nature of accidents. While road safety is a critical issue, yet it is handled in an adhoc manner. This Study is a demonstration of application of GIS for developing an efficient database on road accidents taking Ajmer City as a study. If such type of database is developed, a proper analysis of accidents can be undertaken and suitable management strategies for traffic regulation can be successfully proposed and hence the accidents rate can be reduced.
REFERENCES:
1. "Accident Investigation". U.S. Department of Labor, Occupational Safety & Health Administration. Archived from the original on 17 May 2007. Retrieved 2007-05-12.
2. Edan J.D., Aliyu A. and Sarkinzango I., “USING GIS
AND GPS TECHNIQUES IN MAPPING ROAD ACCIDENT PRONE AREAS IN JALINGO TOWN TARABA STATE, NIGERIA”, Journal of Environmental Sciences and Resources Management Volume 5, Number 2, 2013.
3. Ghosh S.K., Parida M., Uraon Jay K., “TRAFFIC
ACCIDENT ANALYSIS FOR DEHRADUN CITY USING GIS”, Journal of the Institute of Town Planners India(ITPI), Volume 1:3 year 2004. 4. Liang Lim Yu, Mohamad Dadang Ma’some, Hua
Law Teik, “TRAFFIC ACCIDENT APPLICATION USING GEOGRAPHIC INFORMATION SYSTEM”, Journal of the Eastern Asia Society for Transportation Studies, Vol. 6, pp. 3574 - 3589, 2005.
5. Nagne Ajay D., Gawali Bharti W. “TRANSPORTATION NETWORK ANALYSIS BY USING REMOTE SENSING AND GIS A REVIEW”, International Journal of Engineering Research and Applications (IJERA), Vol. 3, Issue 3, May-Jun 2013, pp.070-076.
6. Pathak Akhilesh, Desania N.L. & Verma Rajesh, “Profile of Road Traffic Accidents & Head Injury in Jaipur (Rajasthan)” J Indian Acad Forensic Med, 30(1).
7. Rasmussen, Jens (1997). "Risk management in a dynamic society: A modeling problem". Safety Science 27 (2–3): 183–213.
8. Ruengsorn Danai, Chadbunchachai Witaya, “DEVELOPMENT OF GIS BASED TRAFFIC ACCIDENT DATABASE THROUGH TRAUMA MANAGEMENT SYSTEM: THE DEVELOPING COUNTRIES EXPERIENCES, A CASE STUDY OF KHON KAEN, THAILAND”, Journal of the Eastern Asia Society for Transportation Studies, Vol.4, No.5. Page number 293 to 308 October, 2001.
9. Singh Sanjeev Kumar and Mishra Ashish, “Road
Accident Analysis: A Case Study of Patna City” Urban Transport Journal 2(2): 60-75.
10. STATISTICAL ABSTRACT - 2012-13, Transport Department, Govt. of Rajasthan.
11. Walker Christopher, “ROAD ACCIDENT ANALYSIS – A VISUAL APPROACH Using a GIS Approach to Analysing Accident Information” Journal of the Data Dimensions Pty Ltd Deer Park Victoria Australia.