www.elsevier.nlrlocateraqua-online
Regulating the local environmental impact of
intensive, marine fish farming
II. The monitoring programme of the MOM system
ž
Modelling–Ongrowing fish farms–Monitoring
/
Pia Kupka Hansen
a, Arne Ervik
a,), Morten Schaanning
b,
Per Johannessen
c, Jan Aure
d, Terje Jahnsen
e, Anders Stigebrandt
fa
Department of Aquaculture, Institute of Marine Research, P.O. Box 1870, Nordnes, N-5817 Bergen, Norway
b
Norwegian Institute of Water Research, P.O. Box 173, Kjelsas, N-0411 Oslo, Norway˚
c
Institute of Fisheries and Marine Biology, UniÕersity of Bergen, Høyteknologisenteret, 5020 Bergen, Norway
d
Department of Marine EnÕironment, Institute of Marine Research, P.O. Box 1870, Nordnes, N-5817 Bergen, Norway
e
Directorate of Fisheries, Department of Aquaculture, Strandgt. 229, N-5804 Bergen, Norway
f
Department of Oceanography, UniÕersity of Gothenburg, S-41381 Gothenburg, Sweden Received 18 February 1999; received in revised form 21 July 2000; accepted 18 September 2000
Abstract
A programme for monitoring the impact of organic waste from marine fish farms is presented.
Ž .
It consists of three types of investigation of increasing complexity and accuracy A, B and C , which are applied more frequently with increasing environmental impact. The A-investigation is a simple measurement of sedimentation rate beneath the net cages; the B-investigation is a sediment investigation providing a trend monitoring of the sediment condition, and the C-investigation is a comprehensive investigation of the benthic macrofaunal community structure. The A- and B-investigations were designed specifically for fish farming and the latter utilises several parameters in order to make the investigation more robust. The C-investigation employs well-established methods and procedures, which have been used previously in monitoring programmes.
Ž .
Environmental quality standards EQS have been set for the B- and C-investigation. The monitoring programme is part of a larger management system in Norway called Modelling–
Ž .
Ongrowing fish farms–Monitoring MOM .q2001 Elsevier Science B.V. All rights reserved.
Keywords: Fish farming; Environmental impact; Monitoring; Organic material; Sediment
)Corresponding author.
Ž .
E-mail address: [email protected] A. Ervik .
0044-8486r01r$ - see front matterq2001 Elsevier Science B.V. All rights reserved. Ž .
( ) P.K. Hansen et al.rAquaculture 194 2001 75–92 76
1. Introduction
Intensive marine fish farming has a high production per unit area and large fish farms generate large amounts of particulate organic waste, as well as soluble-inorganic
Ž .
excretory waste Ackefors and Enell, 1994; Einen et al., 1995 . Depending on the quantity and composition of the effluents and the susceptibility of the receiving environment, these emissions may have various, and sometimes severe, ecological impacts. They may also influence other coastal zone activities, including negative
Ž
feedback on the aquaculture activity itself e.g. Lumb, 1989; Iwama, 1991; Black et al.,
.
1996 .
Monitoring investigations of various degrees of complexity have been employed in
Ž
order to minimise the harmful effects of aquaculture activities e.g. O’Connor et al.,
.
1991; Hensey, 1992; Henderson and Ross, 1995; Wildish et al., 1999 . Reviews of monitoring strategies and methods revealed the need for standardised approaches, which are flexible enough to cover the wide range of environments in which fish farms are
Ž .
located Cochrane et al., 1994; Codling et al., 1995 .
To properly manage the scale of enrichment from fish farming and to ensure that the ecological change does not exceed predetermined levels, monitoring should be regarded as a component of a larger management framework. This should include a system of
Ž . Ž .
environmental quality objectives EQO and standards EQS , as well as the means of
Ž .
environmental impact assessment GESAMP, 1996 . Furthermore, guidelines for appro-priate actions if the EQS are breached should also be included.
Manuals for procedures and management plans have been developed in Scotland
ŽMackay, 1998 and in Canada Anonymous, 1995 . In Norway, a management system. Ž .
Ž .
called Modelling–Ongrowing fish farms–Monitoring MOM has been developed to safeguard the long-term use of fish farm sites. The system concentrates on organic enrichment. The concept and the structure of the MOM system have been presented by
Ž .
Ervik et al. 1997 . In this paper, we present the monitoring programme and the results of a field trial.
2. Environmental effects
The monitoring of environmental impact of aquaculture is Athe regular collection, generally under regulatory mandate, of biological, chemical or physical data from pre-determined locations such that ecological changes attributable to aquaculture wastes
Ž .
can be quantified and evaluatedB GESAMP, 1996 .
We have applied four criteria in selecting the environmental impact on which to place
Ž .
most emphasis: 1 The impact must have significance for both the natural environment
Ž .
and for the condition of the farmed fish. 2 The impact must be amenable for monitoring. This implies that it must provide a clear signal that can be distinguished from background levels and that the impact should be integrated over time. As the objective of the monitoring is to evaluate and limit biological changes, biological
Ž . Ž .
parameters are normally preferable to chemical ones GESAMP, 1996 . 3 Sufficient
Ž .
cost-effective and convenient to perform by routine methods. The advantage of frequent investigations must be balanced against the scientific benefits of more advanced methods.
2.1. Fish farm discharges and benthic impact
Fish farms generate orthophosphate and nitrogenous nutrients and high concentrations have been observed in adjacent surface waters. However, concentrations decline rapidly with distance from the net cages as a result of dilution and assimilation in phytoplankton
Ž
or algae growing on net cages and installations e.g. Aure et al., 1988; Hensey, 1992;
.
Wildish et al., 1993 . Widespread surface eutrophication has not been reported in
Ž .
Norway Skjoldal et al., 1997 .
Carbon flux to the seabed below the net cages may be several orders of magnitude
Ž
higher than natural fluxes in adjacent waters Gowen et al., 1988; Hall et al., 1990;
.
Samuelsen et al., 1992; Findlay et al., 1995 . Increased loads of organic material to the sediment shift decomposition processes from aerobic to anaerobic, and sulphate
reduc-Ž .
tion may predominate Holmer and Christensen, 1992 . Typical features of such sediments are substantially lowered redox potentials and the presence of hydrogen sulphide in the pore waters, mats of sulphide-oxidising bacteria and severe disturbance
Ž
of the macrobenthic community e.g. Lumb and Fowler, 1989; Hargrave et al., 1993;
.
Brown et al., 1987 . In sediments with severe organic enrichment, methanogenic
Ž
bacteria proliferate causing gas ebullition Martens and Val Klump, 1984; Lumb and
. Ž .
Fowler, 1989 and a lowering of pH Schaanning, 1994 . Analyses of gas released from such sediments have shown it to consist of methane with up to 1800 ppm of hydrogen
Ž .
sulphide Samuelsen et al., 1988 .
Benthic impact is relevant with regard to both the environment and, depending on the depth of water under the farm, the condition of the fish. Furthermore, since effects are integrated over time, they are convenient for monitoring and the impact can be measured by cost-effective routine methods. In many cases, information on changes in the sediment due to sediment organic enrichment is sufficient to allow decisions regarding reasonable EQS values to be made.
The monitoring system of MOM puts the main emphasis on benthic impact. The monitoring focuses on the area close to the fish farm, where the impact is most pronounced, but it also covers a gradient from the farm into the surrounding environ-ment. Vulnerable sedimentation areas are given special attention.
We have defined the holding capacity of a fish farm site as the maximum fish production that allows a viable macrofauna to be maintained in the sediment. At site level, there are no criteria attached to the faunal community in terms of abundance, number of species or species composition; the only requirement is that macrofauna be present in the sediment. In the surrounding environment, however, less impact is tolerated and the benthic infauna community structure is evaluated using general
Ž
environmental quality standards set by the Norwegian Pollution Control Authority see
.
Table 1 .
( ) P.K. Hansen et al.rAquaculture 194 2001 75–92 78
Table 1
Ž .
Classification of soft bottom fauna in Norwegian fjords and coastal waters after Molvær et al., 1997
Parameters Classification
Ž .I Very good Ž .II Good ŽIII Less good. ŽIV Bad. Ž .V Very bad
Ž .
Hurlberts index ESns100 )26 26–18 18–11 11–6 -6
Ž .
Shannon–Wiener index H )4 4–3 3–2 2–1 -1
environment, the oxygen concentration of the basin water is monitored. The oxygen concentration in net cages has a direct impact on the well being of the fish and fish farmers are advised to monitor oxygen separately. Water column parameters may be included in the monitoring programme where appropriate.
3. The monitoring programme
3.1. General design
Ž .
The monitoring programme consists of three types of investigations A, B and C , which include a number of variables, providing flexibility and robustness. The A-, B-and C-investigations are of increasing complexity B-and accuracy B-and they are performed more frequently as the degree of environmental impact increases. In order to accomplish this, two terms are employed: the degree of exploitation and the level of monitoring. The degree of exploitation is an expression of the amount of impact from the fish farm compared with the holding capacity of the site. The site is overexploited if the holding
Ž
capacity is exceeded. We distinguish between three rising degrees of exploitation 1, 2
.
and 3 , with three corresponding levels of monitoring, where the investigations are performed at specific frequencies. Thus, the frequency of monitoring depends on the degree of environmental impact. For the A- and B-investigations, the frequencies of monitoring are shown in Table 2. The local environmental authorities will decide the frequency of performing the C-investigation.
Standard procedures have been used wherever possible and other procedures are
Ž .
currently being standardised through the Norwegian General Standardizing Body NAS .
Table 2
Ž . Ž .
The relationship between the degree of exploitation DEX of the site, the level of monitoring LOM and the frequency of performing the A- and B-investigations
Type of investigation
A B
DEX 1™ LOM 1 every 3rd month every 2nd year
DEX 2™ LOM 2 every 2nd month every year
Ž .
3.2. Impact zones
The various emissions from fish farms have different potential for dispersing and influencing the water column and the seabed and various zones of impact around fish
Ž .
farms have been identified Silvert, 1992; Henderson and Ross, 1995 . In MOM, three zones of environmental impact are recognised: the local, the intermediate and the regional. Each zone is characterised by an area of influence and type of impact and each
Ž .
has been assigned monitoring investigations Table 3 . A higher degree of impact is tolerated in the local impact zone than in the intermediate and the regional impact zones and this is reflected in the EQS. Therefore, the investigation performed in the regional impact zone is more comprehensive since it must be able to detect more subtle changes in the environment than the investigation in the local impact zone.
3.3. The A-inÕestigation
This investigation is a simple measurement of the rate of sedimentation of organic material below the fish farm. It provides the fish farmer with immediate information regarding the load beneath the net cages in order to avoid overloading the site. The sedimentation rate is a function of the amount of organic solid waste, as well as of the current and depth and may vary considerably with the feeding strategy.
The sedimentation rate is measured by deploying two sediment traps 2 m above the seabed at the periphery of the net cages that either contain the most fish, receive the largest amounts of feed or where the B-investigation has revealed heavy impact. Collection lasts for 2 weeks and the frequency of collection at the different levels of monitoring is shown in Table 2.
The A-investigation is performed by each fish farmer as a part of their internal control routines. The investigation is meant to provide a time series of the sedimentation and no EQS has been defined. The interpretation of the results will be based on previous measurements and compared with the results of the B-investigation. The variation in sedimentation rates must be seen in relation to the amounts of feed used and fish produced.
3.4. The B-inÕestigation
The B-investigation is performed in the local impact zone and combines three groups of parameters. It is inexpensive and easy to perform and should be carried out frequently
Ž .
in cases where the impact is severe cf. Table 2 .
()
P.K.
Hansen
et
al.
r
Aquaculture
194
2001
75
–
92
80
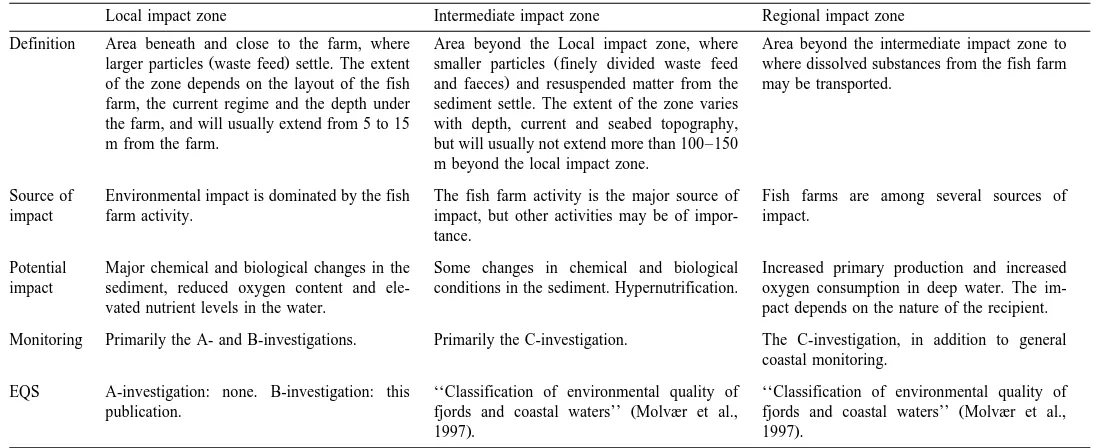
Table 3
Zonation in MOM. The table describes the source and the potential of each type of impact as well as the investigations that are included in the monitoring programme
Ž .
and the types of Environmental Quality Standards EQS employed
Local impact zone Intermediate impact zone Regional impact zone
Definition Area beneath and close to the farm, where Area beyond the Local impact zone, where Area beyond the intermediate impact zone to
Ž . Ž
larger particles waste feed settle. The extent smaller particles finely divided waste feed where dissolved substances from the fish farm
.
of the zone depends on the layout of the fish and faeces and resuspended matter from the may be transported. farm, the current regime and the depth under sediment settle. The extent of the zone varies
the farm, and will usually extend from 5 to 15 with depth, current and seabed topography, m from the farm. but will usually not extend more than 100–150
m beyond the local impact zone.
Source of Environmental impact is dominated by the fish The fish farm activity is the major source of Fish farms are among several sources of impact farm activity. impact, but other activities may be of impor- impact.
tance.
Potential Major chemical and biological changes in the Some changes in chemical and biological Increased primary production and increased impact sediment, reduced oxygen content and ele- conditions in the sediment. Hypernutrification. oxygen consumption in deep water. The
im-vated nutrient levels in the water. pact depends on the nature of the recipient.
Monitoring Primarily the A- and B-investigations. Primarily the C-investigation. The C-investigation, in addition to general coastal monitoring.
EQS A-investigation: none. B-investigation: this ‘‘Classification of environmental quality of ‘‘Classification of environmental quality of
Ž Ž
publication. fjords and coastal waters’’ Molvær et al., fjords and coastal waters’’ Molvær et al.,
. .
B-investigation, since it is considered more important to determine the sediment condition at the site in relation to the threshold for unacceptable sediment conditions. The sampling is performed using light equipment operated from the net cage floats or from small craft. Samples are collected by a small gravity core sampler with transparent
Ž 2.
corers or a modified van Veen grab )200 cm . A portable winch is used at deep stations.
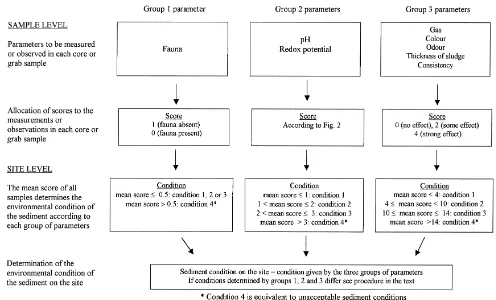
The three groups of parameters used in the B-investigation are: biological parameters
Žmacro-infauna. ŽGroup 1 , chemical parameters pH and redox potential. Ž . ŽGroup 2 and.
Ž .
sensory parameters Group 3 . The use of several parameters makes the evaluation more robust and the results are less sensitive to variation in any one parameter. EQS values have been established for each group, rather than for individual parameters. Four categories of environmental conditions have been defined, in which category four is equivalent to unacceptable sediment conditions. The Group 1 parameter is only used to distinguish between acceptable and unacceptable sediment conditions, whereas Groups 2 and 3 parameters are also used to distinguish between different categories of acceptable sediment conditions. A scoring system has been developed for the three groups of parameters and the lower the score the better the environmental condition. No laboratory work is required for the B-investigation, and the results can be presented to the fish farmer immediately after the investigation has been carried out.
3.4.1. Group 1 parameter
The Group 1 parameter is a determination of whether the sediment contains a macro-infauna and is directly linked to the environmental quality objective, which states that a viable macro-infauna must be present under the fish farm.
The sediment is sieved through a 1-mm mesh sieve and the presence of animals
Ž .
yields a score of 0 and the absence a score of 1 Fig. 1 . If a sample contains little sediment, fauna may not have been collected even if the bottom condition is good. This is often the case where there is hard bottom with little accumulation of fish farm waste. The condition of such a sample may still be acceptable if the results of the other two groups of parameters show either conditions 1, 2 or 3. If a full sample does not contain fauna, the sediment condition is unacceptable, which will also be revealed by the other two groups of parameters. Since fauna cannot always be expected to be found even if the sediment is not impacted, it is accepted that not all samples at a site contain fauna. If the mean score of all the samples taken at a given site is F0.5, the sediment condition is 1, 2 or 3, which are all acceptable. If the mean score is )0.5, the condition of the
Ž .
sediment is considered unacceptable condition 4 according to the Group 1 parameter.
3.4.2. Group 2 parameters
The Group 2 parameters are based on direct measurements of pH and redox potential by electrodes inserted in the sediment immediately after sampling in transparent corers
ŽHansen et al., 1997 . Changes in these parameters are largely controlled by three major.
decomposition processes in marine sediments: oxygen respiration, sulphate reduction
Ž .
()
P.K.
Hansen
et
al.
r
Aquaculture
194
2001
75
–
92
82
Ž .
sediments Bagander and Niemisto, 1978; Pearson and Stanley, 1979 . It has also been
˚
¨
used to assess environmental impacts of fish farms and for developing benthic enrich-ment index, although it may be difficult in some sedienrich-ments to attain stable readings from
Ž
the electrodes e.g. Hargrave, 1994; Henderson and Ross, 1995; Hargrave et al., 1997;
.
Wildish et al., 1999 . However, when the sediment is severely effected by organic material and it becomes more important to be able to distinguish between sediment conditions, the redox potential usually becomes more stable. pH has been less used in sediment investigations. A pH of 7.0 has been defined as the lower threshold of pH in
Ž .
recent anoxic marine sediments Ben-Yaakov, 1973 , but several observations of
Ž
sediments at fish farms Schaanning, 1991, 1994; Schaanning and Dragsund, 1993;
. Ž
Cochrane et al., 1994 and more recent studies Bahr, personal communication; Jarp,
.
personal communication have shown that pH may fall below 7.0 in samples that contain gas bubbles. Thus, pH appears to be a reliable parameter for predicting the risk of gas ebullition. The gas consists mostly of methane and carbon dioxide, but it may transfer
Ž
toxic hydrogen sulphide from the anaerobic sediment into the water Braaten et al.,
.
1983; Samuelsen et al., 1988; Lumb and Fowler, 1989 .
pH and redox potential are measured in the water above the sediment and at 2-cm depth intervals in the core sample. If cores cannot be collected, the electrodes may be inserted directly into the grab sample.
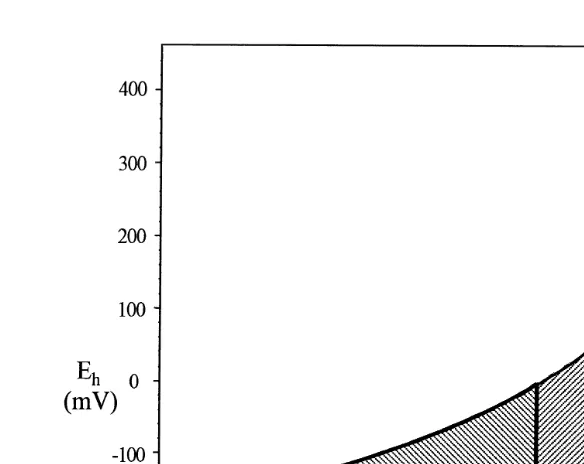
Fig. 2 is based on measurements of pH and redox potential in marine sediment
Ž
beneath Norwegian fish farms Schaanning, 1991, 1994; Schaanning and Dragsund,
.
1993 . A score is allocated to the pH and redox potential measured in each sample. The score boundaries in Fig. 2 have been determined on the basis of descriptions of organic
Ž .
enrichment Pearson and Stanley, 1979; Grey, 1981 . The method gives high resolution in heavily enriched sediments where the macrobenthic community is absent or severely disturbed. A score of 0 will correspond to a well-oxygenated environment with low organic input and favourable conditions for the presence of viable benthic communities. Increasing input of organic matter will drive the sediment environment through succes-sive stages of increasing oxygen deficits and corresponding changes in microbial
Ž .
communities Zehnder and Stumm, 1988 . A score of 2 frequently represents an environment with hydrogen sulphide, which gives low redox potentials in the pore water
ŽBagander and Niemisto, 1978 . A score of 5 represents an environment with methane
˚
¨
.gas in the sediment and low pH values.1 Scores of 1 or 3 are allocated to transition zones.
If measurements are made at several depths in core samples, the lowest pH and the corresponding redox potential are used to assign scores. This implies that in sediments with a redox discontinuity layer, site assessment will frequently be based on values
1As shown in Schaanning 1991 , the stoichiometry of sulphate reduction: C H 0Ž . Ž .q1r2SO2ysHCO3y
2 4
q1r2HSyq1r2Hqshows that buffering by HSy at a pH corresponding to the first dissociation constant of Ž .
hydrogen sulphide pK will prevent the pH from decreasing to values much below 7.0, whereas the
Ž . 3y q
stoichiometry of methane production: C H 02 q1r2H Os1r2HCO2 q1r2CH4q1r2H shows that this
Ž .
( ) P.K. Hansen et al.rAquaculture 194 2001 75–92 84
Ž . Ž .
Fig. 2. Investigations by Schaanning 1991, 1994 and Schaanning and Dragsund 1993 showed that measurements of pH and redox potentials in fish farm sediments fell within the boundaries of the hatched area. For use in MOM, the hatched area has been divided into five compartments with increasing scores associated
Ž .
with higher organic input and decreasing values of pH and Eh Fig. 1 .
recorded below this layer. As seen from Fig. 2, this may result in the allocation of a lower score than might have been obtained from data recorded at depths closer to the sediment–water interface. In coarser sediment types on the other hand, sharp redox-clines may be absent or present only below the sampling depth of the light grab or core equipment. Furthermore, in sediments that have recently been enriched with organic material, the redox potential gradient may be inverted, so that the potential increases with increasing depth.
The rationale for using the minimum values is based on the following considerations:
Ž .1 The simplicity of the rule. 2 The freedom it provides with regard to sample qualityŽ . Ž .
and electrode design. 3 The reduction in the variance resulting from measuring in the steep gradients frequently present within the top few millimeters of the sediments.
The sediment condition of the site according to Group 2 parameters is determined using the mean score of all samples collected within the area investigated, as shown in Fig. 1.
3.4.3. Group 3 parameters
The Group 3 parameters are a number of sensory sediment variables, which change with increasing organic enrichment: sediment colour, odour and consistency, gas
Ž .
These parameters provide valuable information about the condition of the sediment and
Ž
have been included as visual observations in sediment studies and in monitoring e.g.
.
Hall et al., 1990; Codling et al., 1995; Holmer and Christensen, 1996; Dyer, 1998 . However, since most of these parameters are observed rather than measured, they have not previously been regarded as suitable for the development of EQS. The information provided by these parameters has been standardised for use in the B-investigation by assigning numerical values to the sensory variables. The more effected the sediment by organic enrichment, the higher the score allocated to the parameter. Sediment colour is allocated a score of 0 if it is light, grey or brown and 2 if it is black or brown due to organic accumulation. The odour and consistency of the sediment are each allocated scores of 0, 2 or 4 depending on the extent to which the parameter is affected as a result of organic enrichment. Gas bubbles in the sediment are either absent, which registers a score of 0, or present, giving a score of 4. If the gas bubbles are too small to see, the pH measurement will probably indicate that methane is being formed. The thickness of accumulated sludge is measured and allocated a score from 0 to 4. The maximum score of 4 is given where accumulations are more than 8-cm thick. The allocation of scores to the individual variables may entail some subjectivity. Therefore, the variables are not considered individually, but the scores from all Group 3 parameters in one sample are added in order to avoid placing too much emphasis on individual observations. The mean score of a minimum of 10 samples is calculated and the sediment condition falls into one of four categories as shown in Fig. 1. A mean score of zero is equivalent to undisturbed conditions while a mean score higher than 14 defines a sediment condition, which is deemed unacceptable.
3.4.4. Determination of site condition
The environmental condition of the site is expressed by combining the conditions determined by the three groups of parameters. Acceptable sediment conditions according to Group 1 means that the environmental condition of the location is 1, 2 or 3. If Groups 2 and 3 indicate the same sediment conditions, then this is considered the condition of the site. If Groups 2 and 3 indicate different conditions, Group 2 takes precedence over Group 3.
Unacceptable conditions according to Group 1 may be caused by unacceptable sediment conditions or by small sample sizes from hard bottoms with little accumulation of organic matter. In the first case, Groups 2 and 3 will also give unacceptable sediment conditions. In the second case, the condition of the site is determined by Groups 2 and 3. If they differ, Group 2 takes precedence over Group 3.
3.5. The C-inÕestigation
This investigation is a study of the benthic community structure along a transect drawn from the fish farm towards sedimentation areas or sensitive parts of the intermediate and regional impact zones. Three sampling stations are used, one close to the fish farm, one at the deepest area in the surrounding environment and one in
Ž
between. The benthic infauna is sensitive to organic loading Pearson and Rosenberg,
.
( ) P.K. Hansen et al.rAquaculture 194 2001 75–92 86
the effect of organic effluents from fish farms, being considered sensitive enough to
Ž
detect more subtle impact e.g. Weston, 1990; Ritz et al., 1989; Johannessen et al., 1994;
.
Henderson and Ross, 1995; Findlay et al., 1995 . However, the investigation is rather comprehensive, requires qualified taxonomists and therefore is relatively costly. The C-investigation is used in the intermediate and regional impact zones where changes in the sediment condition are expected to be less severe than in the local impact zone and where less impact is tolerated. It is carried out less frequently than the A- and B-investigations.
The C-investigation is performed according to the Norwegian Standard for sampling
Ž .
and investigation of benthic infauna Anonymous, 1998 . A set of general EQS has been
Ž .
developed by the Norwegian Pollution Control Authority Molvær et al., 1997 and
Ž .
these are employed for the intermediate and regional impact zones Table 1 .
4. Field trial of the B-investigation
The B-investigation was tested with regard to training of personnel, practicality of fieldwork and comparison of the three groups of parameters.
Forty-four fish farm sites in Southern, Western, Mid- and Northern Norway partici-pated in the field trial. The fish farms were located in depths of water between 30 and 100 m, had productions between 90 and 1330 tonnesryear and had been in operation for at least 1 year at the time of the field trial.
A total of 218 sediment samples were collected. At the time of the field trial, six sampling stations were established at each site. However, after the trial, the number of sampling stations was increased to 10 as described in Section 3.4. Samples were retrieved generally from all stations, but in some cases this was not possible due to the nature of the seabed. A recent relocation of Norwegian fish farms from sheltered sites to more exposed locations has resulted in many sites with hard bottom, rock, gravel or coarse sand, which are unsuitable for core sampling and sometimes even for grab sampling. Core samples could be retrieved at nine sites, although not at all sampling stations, and a total of 30 cores were collected. The other 35 sites were investigated
Ž 2.
using a modified van Veen grab 250 cm and 188 samples were collected.
4.1. Comparison of parameters
The results from the three parameter groups were compared in order to determine whether the scoring system and the consequential determination of the environmental conditions were appropriate.
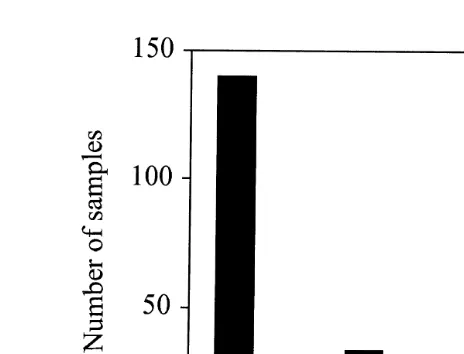
Ž .
Sixteen samples were classified as unacceptable according to Group 2 pH and Eh
Ž . Ž .
and Group 3 sensory parameters Fig. 3 . Animals were found in more than half of these samples despite low pH and redox potentials, a strong smell of hydrogen sulphide and, in some cases, spontaneous gas ebullition. The animals in these samples turned out to be the polychaete, Malacoceros fuliginosus, a species that is extremely tolerant of
Ž .
Ž . Ž .
Fig. 3. The number of samples with fauna black bars and without white bars in sediment where the
Ž . Ž
environmental condition see Site Level in Fig. 1 has been determined by Groups 2 and 3 parameters core
. Ž .
samples or only Group 3 parameters grab samples .
Ž
organically enriched than the above Johannessen et al., 1994; Cochrane et al., 1994;
.
Henderson and Ross, 1995 .
Fauna was not observed in 23 of the 178 samples taken from sediment classified as
Ž . Ž .
acceptable conditions 1, 2 and 3 by Groups 2 and 3 Fig. 3 . Five of these samples were collected by gravity corer with a small diameter that may not be appropriate for collecting fauna. The others were collected by grab. In some instances, the fauna may have been overlooked, and to minimise this possibility, a small magnifier is now used to examine the sieved sediment samples. Some samples were collected from hard bottoms
Žrock, gravel with only a thin layer of sediment, or the sediment was too hard to get.
proper samples. In these cases, however, there was no accumulation of organic waste and the environmental impact was otherwise acceptable.
Fig. 4a shows a comparison of the sediment condition determined by Groups 2 and 3 parameters for each of 30 core samples. The condition determined by the two groups of parameters agreed in 20 core samples. In six samples, the sediment seemed be more severely affected when determined by the Group 2 parameters than by Group 3.
Ž .
However, the sediment conditions were all acceptable conditions 1, 2 or 3 . For sediments highly affected by organic material, the Group 3 parameters showed the same or worse conditions than Group 2. Since Group 2 parameters can be measured on a continuous scale, it is expected that these variables will more accurately mirror the sediment condition than the more coarsely determined Group 3 parameters. The Group 3
Ž .
parameters more readily determine the sediment condition as unacceptable condition 4 than Group 2; however, in these cases, the sediment was also severely affected
Žcondition 3 according to the Group 2 parameters. Only in one case did the Groups 2.
and 3 parameters produce very different results.
The environmental condition of the site is determined for each parameter group
Ž .
( ) P.K. Hansen et al.rAquaculture 194 2001 75–92 88
Fig. 4. The environmental condition in the sediment determined by Group 2 parameters plotted against the
Ž . Ž .
condition determined by Group 3 parameters, a in individual core samples, b at site level. The numbers in
Ž . Ž .
brackets represents the number of samples ns30 a and the number of sites ns9 b which make up each point.
which cores could be collected, the environmental conditions according to Groups 2 and
Ž .
3 parameters were compared Fig. 4b . These were identical when conditions were very
Ž . Ž .
good condition 1 and on two sites where conditions were very bad condition 4 . In five cases, Group 2 yielded a category 1 degree worse than Group 3. There may, thus, be a risk of underestimating the impact on the sediment if the consistency of the sediment is such that core samples cannot be collected and the Group 2 parameters are therefore not measured. However, most sites where the sediment condition was
classi-Ž .
Ž . Ž .
Fig. 5. The percentage of samples taken by grab black bars and by core sampler white bars , respectively, in relation to the environmental condition of the sediment determined by Groups 2 and 3 parameters.
With minor modifications, Group 2 parameters may be determined directly from grab
Ž .
samples. In a recent investigation Schaanning, 1998 , pH and Eh were determined simply by inserting the electrodes into the material while it was still in the grab. The bottom substrates ranged from fine-grained soft sediments, through mud accumulated in between stones and gravel, to thin layers of organic waste scraped off steeply sloping rocky bottoms. It is thus possible that the B-investigation may be adapted to employ only grab samples.
5. The application of MOM
The MOM system is presently being implemented through the regulatory framework of Norwegian aquaculture. The A-investigation may be voluntary while the B-investiga-tion will be made compulsory and must be performed at the frequencies shown in Table 2. Many aquaculture companies have already adopted the B-investigation on a voluntary basis and some companies prefer more frequent monitoring than has been proposed in MOM. The application of the C-investigation has not yet been decided. The frequency of this investigation will probably be decided by the local environmental authorities.
At present, feed quotas regulate the production of Norwegian fish farms. In future, feed quotas may still be used to control the production of fish and the MOM system used to manage the environmental impact of fish farms. A database will be established in which the results of the B- and C-investigations can be continuously registered for regulatory purposes as well as for scientific use. After 2 to 3 years of operation, the monitoring programme will be reviewed and modifications may be made in the light of experience.
Acknowledgements
( ) P.K. Hansen et al.rAquaculture 194 2001 75–92 90
References
Ackefors, H., Enell, M., 1994. The release of nutrient and organic matter from aquaculture systems in Nordic countries. J. Appl. Ichthyol. 10, 225–241.
Anonymous, 1995. Environmental management plan for the marine finfish aquaculture industry in The Bay of Fundy, New Brunswick. Report. Department of Fisheries and Aquaculture, Fredericton, New Brunswick, 29 pp.
Anonymous, 1998. Water quality. Guidelines for quantitative investigations of sublittoral soft-bottom benthic
Ž
fauna in the marine environment. Norwegian Standards Association, NS 9423, Oslo, Norway, 16 pp. in
.
Norwegian .
Aure, J., Ervik, A., Johannessen, P., Ordemann, T., 1988. The environmental effects of sea water fish farms,
Ž
Fisken og Havet 1. Institute of Marine Research, Bergen, Norway, 94 pp. in Norwegian, abstract and
.
legends to figures in English .
Bagander, L.E., Niemisto, L., 1978. An evaluation of the use of redox measurements for characterising recent˚ ¨
sediments. Estuarine Coastal Mar. Sci. 6, 127–134.
Ben-Yaakov, S., 1973. pH-buffering of pore waters of recent anoxic marine sediments. Limnol. Oceanogr. 18, 86–94.
Black, K.D., Kiemer, M.C.B., Ezzi, I.A., 1996. The relationships between hydrodynamics, the concentration of hydrogen sulfide production by polluted sediments and fish health at several marine cage farms in Scotland and Ireland. J. Appl. Ichthyol. 12, 15–20.
Braaten, B., Aure, J., Ervik A., Boge, E., 1983. Pollution problems in Norwegian fish farming. ICES C.M. 1983rF:26, 11 pp.
Brown, J.R., Gowen, R.J., McLusky, D.S., 1987. The effect of salmon farming on the benthos of a Scottish sea loch. J. Exp. Mar. Biol. Ecol. 109, 39–51.
Cochrane, S.K.J., Pearson, T.h., Skotvold, T., 1994. Evaluation of methods and development of procedures for environmental monitoring of fish farms. Akvaplan-niva report No. 631.93.320, Tromsø, Norway, 39 pp. Codling, I.D., Dougherty, R., Hunter, J., Henderson, A., Naismith, I., 1995. Strategies for monitoring sediments and fauna around cage fish farms. Scotland and Northern Ireland Forum for Environmental Research, report No. SR 4018, Marlow, UK, 77 pp.
Costello, M.J., Read, P., 1994. Toxicity of sewage sludge to marine organisms: a review. Mar. Environ. Res. 37, 23–46.
Dyer, M., 1998. A comparison of sediment monitoring techniques for cage fish farming. Scotland and
Ž .
Northern Ireland Forum for Environmental Research, report No. SR 97 06 F, Marlow, UK, 40 pp., 12 appendices.
˚
Einen, O., Holmefjord, I., Talbot, C., Asgard, T., 1995. Auditing nutrient discharges from fish farms:˚
theoretical and practical considerations. Aquacult. Res. 26, 701–713.
Ervik, A., Hansen, P.K., Aure, J., Stigebrandt, J., Johannessen, P., Jahnsen, T., 1997. Regulating the local
Ž
environmental impact of extensive marine fish farming: I. The concept of MOM Modelling–Ongrowing
.
fish farms–Monitoring . Aquaculture 158, 85–94.
Findlay, R.H., Watling, L., Mayer, L.M., 1995. Environmental impact of salmon net-pen culture on marine benthic communities in Maine: a case study. Estuaries 18, 145–179.
GESAMP, 1996. Monitoring the ecological effects of coastal aquaculture wastes. Reports and studies No. 57, FAO, Rome, 38 pp.
Gowen, R., Brown, J., Bradbury, N., McLusky, D.S., 1988. Investigations into benthic enrichment, hypernutri-fication and eutrophication associated with mariculture in Scottish coastal waters. Report, University of Stirling, UK, 289 pp.
Grey, J.S., 1981. The Ecology of Marine Sediments. Cambridge Univ. Press, UK, 185 pp.
Hall, P.O.J., Anderson, L.G., Holby, O., Kollberg, S., Samuelsson, M.-O., 1990. Chemical fluxes and mass balances in a marine fish cage farm: I. Carbon. Mar. Ecol.: Prog. Ser. 61, 61–73.
Hansen, P., Ervik, K., Aure, A., Johannessen, J., Jahnsen, P., Stigebrandt, T., Schaanning, A., 1997. MOM. Concept and Revised Edition of Monitoring Programme 1997, Fisken og Havet 7. Institute of Marine Research, Bergen, Norway, 51 pp.
Ž .
Hargrave, B.T., Duplisea, D.E., Pheiffer, E., Wildish, D.J., 1993. Seasonal changes in benthic fluxes of dissolved oxygen and ammonium associated with marine cultured Atlantic salmon. Mar. Ecol.: Prog. Ser. 96, 249–257.
Hargrave, B.T., Phillips, G.A., Doucette, L.I., White, M.J., Milligan, T.G., Wildish, D.J., Cranston, R.E., 1997. Assessing benthic impacts of organic enrichment from marine aquaculture. Water, Air, Soil Pollut. 99, 641–650.
Henderson, A.R., Ross, D.J., 1995. Use of macrobenthic infaunal communities in the monitoring and control of the impact of marine cage fish farming. Aquacult. Res. 26, 659–678.
Ž .
Hensey, M.P., 1992. Environmental monitoring for fish farms in Ireland. In: De Pauw, N., Joyce, J. Eds. , Aquaculture and the Environment. European Aquaculture Society, Ghent, Belgium, pp. 145–153, Special Publications No. 16.
Holmer, M., Christensen, E., 1992. Impact of marine fish cage farming on metabolism and sulfate reduction of underlying sediments. Mar. Ecol.: Prog. Ser. 80, 191–201.
Holmer, M., Christensen, E., 1996. Seasonality of sulfate reduction and pore water solutes in a marine fish farm sediment: the importance of temperature and sedimentary organic matter. Biogeochemistry 32, 15–39.
Iwama, G.K., 1991. Interactions between aquaculture and the environment. Crit. Rev. Environ. Control 21, 177–216.
Johannessen, P.J., Botnen, H.B., Tvedten, Ø.F., 1994. Macrobenthos: before, during and after a fish farm. Aquacult. Fish. Manage. 25, 55–66.
Lumb, C.M., 1989. Self-pollution from Scottish Salmon Farms? Mar. Pollut. Bull. 20, 375–379.
Lumb, C., Fowler, S.L., 1989. Assessing the benthic impact of fish farming. In: McManus, J., Elliot, M.
ŽEds. , Developments in Estuarine and Coastal Study Techniques. EBSA 17 Symposium. Olsen and Olsen,.
Fredensborg, Denmark, pp. 75–78.
Mackay, D., 1998. Regulation and Monitoring of Marine Cage Fish Farming in Scotland. Scottish
Environ-Ž .
mental Protection Agency SEPA , Stirling, UK.
Martens, C.S., Val Klump, J., 1984. Biogeochemical cycling in an organic-rich coastal marine basin: 4. An organic carbon budget for sediments dominated by sulphate reduction and methanogenesis. Geochim. Cosmochim. Acta 48, 1987–2004.
Molvær, J., Knutzen, J., Magnusson, J., Rygg, B., Skei, J., Sørensen, J., 1997. Classification of the environmental quality of fjords and coastal waters. SFT Veiledning 97:03. Norwegian Pollution Control
Ž .
Authority, Oslo, Norway, 36 pp. in Norwegian .
O’Connor, B., Hartnett, M., Costelloe, J., 1991. Site selection and environmental monitoring in the mariculture
Ž .
industry: an integrated protocol. In: De Pauw, N., Joyce, J. Eds. , Aquaculture and the Environment. European Aquaculture Society Special Publications No 16, Ghent, Belgium, pp. 191–202.
Pearson, T.H., Rosenberg, R., 1978. Macrobenthic succession in relation to organic enrichment and pollution of the marine environment. Oceanogr. Mar. Biol. Annu. Rev. 16, 229–311.
Pearson, T.H., Stanley, S.O., 1979. Comparative measurement of the redox potential of marine sediments as a rapid means of assessing the effect of organic pollution. Mar. Biol. 53, 371–379.
Ritz, D.A., Lewis, M.E., 1989. Response to organic enrichment of infaunal macrobenthic communities under salmonid seacages. Mar. Biol. 103, 211–214.
Samuelsen, O.B., Ervik, A., Solheim, E., 1988. A qualitative and quantitative analysis of the sediment gas and diethylether extract of the sediment from salmon farms. Aquaculture 74, 277–285.
Samuelsen, O.B., Torsvik, V., Ervik, A., 1992. Long-range changes in oxytetracycline concentration and bacterial resistance towards oxytetracycline in a fish farm sediment after medication. Sci. Total Environ. 114, 25–36.
Schaanning, M., 1991. Effects of fish farms on marine sediments. Jordforsk, Report No. 212.409-1, Oslo,
Ž .
Norway, 44 pp. in Norwegian, abstract in English .
Schaanning, M.T., 1994. Distribution of sediment properties in coastal areas adjacent to fish farms and evaluation of five locations surveyed in October 1993. Niva report No. 3102, Norwegian Institute of Water Research, Oslo, Norway, 29 pp.
Schaanning, M.T., 1998. Sediment environment at fish farms in Lerangsvagen. Niva report No. 3919-98,˚
Ž .
Norwegian Institute of Water Research, Oslo, Norway, 25 pp. in Norwegian .
( ) P.K. Hansen et al.rAquaculture 194 2001 75–92 92
NivarOceanor report No. OCN R-93051, Norwegian Institute of Water Research, Oslo, Norway, 44 pp.
Žin Norwegian ..
Silvert, W., 1992. Assessing environmental impacts of finfish aquaculture in marine waters. Aquaculture 107, 67–79.
Skjoldal, H.R., Aure, J., Bakke, T., Dahl, F.E., Fredriksen, S., Gray, J.S., Heldal, M., Røed, L.P., Olsen, Y., Tangen, K., Molvær, J., 1997. The Norwegian North Sea Coastal Water. Euthrophication. Status and trends. Report from an expert group, Norwegian Pollution Control Authority, Oslo, Norway, 76 pp. Weston, D.P., 1990. Quantitative examination of macrobenthic community changes along an organic
enrich-ment gradient. Mar. Ecol. Prog. Ser. 61, 233–244.
Wildish, D.J., Keizer, P.D., Wilson, A.J., Martin, J.L., 1993. Seasonal changes of dissolved oxygen and plant nutrients in seawater near net pens in the macrotidal Bay of Fundy. Can. J. Aquat. Sci. 50, 303–311. Wildish, D.P., Akagi, H.M., Hamilton, N., Hargrave, B.T., 1999. A recommended method for monitoring
sediments to detect organic enrichment from mariculture in the Bay of Fundy. Can. Tech. Rep. Fish. Aquat. Sci. 2286, 31 p.
Zehnder, A.J.B., Stumm, W., 1988. Geochemistry and biogeochemistry of anaerobic habitats. In: Zehnder,
Ž .