EXPLORATION OF OIL SEEPAGES USING TARGET DETECTION ALGORITHMS IN
HYPERSPECTRAL IMAGES
S. A. Sayedain a, , M. J. Valadan zouj a, Y. Maghsoudi a
a
KNToosi University of Technology, Geomatics and Geodesy Faculty, Vali-e-asr, Tehran, Iran –
[email protected], (valadanzouj, ymaghsoudi,m_mokhtarzade)@kntu.ac.ir
KEY WORDS: Hyperspectral image, Target detection algorithms, Spectrometry, Hydrocarbon seeps
ABSTRACT:
The oil industry is one of the most important and high income industries for the oil-rich countries. In the oil industry, exploration of oil and gas seepages has a great help to estimate the quality and quantity of tanks products. Due to the expense of any exploration activity, reaching a high certainty about the presence of hydrocarbons in an area are the main objectives of exploration activities. In this regard, the use of satellite images and remote sensing techniques can reduce the risk and increase certainty. In this paper, by considering the impact of hydrocarbon seeps on the environment and the use of target detection algorithms, the identification of hydrocarbons seepages was conducted. Finally, four points as the locations of hydrocarbon seeps were identified, that two of them were well correlated with ground truth.
1. INTRODUCTION
In the activities related to the oil industry, especially petroleum exploration, remote sensing data can help. Among the advantages of this data, reducing cost and risk in exploration activities can be noted. In this paper, by considering the impact of hydrocarbon seeps on the environment and use of Hyperion hyperspectral image, related to ''Kamaron'' region in the southwest of Iran, and using different detection algorithms, hyperspectral images potential in detecting hydrocarbon seepages are evaluated. The input spectrum of the algorithm is achieved through the field spectrometry.
2. METHODOLOGIES
2.1 The General Approach
This study aimed to hydrocarbon seepages detection using target detection algorithms in hyperspectral images. After obtaining the desired image, the preprocessing step must be performed. This includes (for Hyperion sensor) removal of the main absorption bands of water vapor and oxygen, removal and correction of errors occurring in the image, atmospheric correction and finally converting the image into reflectance (Barry, 2001), (Manolakis et al., 2003). The overall process considered in this study is as follows:
Hyperion hyperspectral data processing originally was done, and it will be prepared to perform target detection algorithms. Then, after selecting the desired targets with the field operations spectrometry, the spectral characteristics of the data were used for the purpose of identification algorithms.
2.2 Study Area and Data
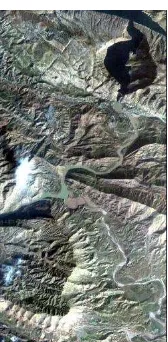
The case study in this research is ''Kamaron'' region in the southwest of Iran. Satellite image used in this research is Hyperion hyperspectral image. The Hyperion sensor, carried by the National Aeronautics and Space Administration (NASA) earth observing 1 (EO-1) satellite, is the first space borne
hyperspectral instrument to acquire both visible near-infrared [(VNIR) 400-1000 nm] and shortwave infrared [(SWIR) 900-2500 nm] spectra. Hyperion uses the push broom imaging sensor technology. This image has a total of 242 contiguous spectral bands ranging from 357 to 2576 microns and 256 pixels per line, which is comprised of wavelength of visible, near infrared and short infrared (Barry, 2001).
Figure 1. Hyperion image of region of interest
2.3 Data Preparation
Hyperion data preparation steps involve the re-calibration, choose non-zero bands, shift the right half of the near-infrared bands, bad bands correction, proofing and correction of the spectral smile effect, vertical strips and finally atmospheric correction (Datt et al., 2003).
2.4 General Description of the Algorithms
Because of the large ground pixel size of the remote sensing image, usually more than one substance will exist within a pixel. So, there will be very limited pure pixels. Therefore, the International Archives of the Photogrammetry, Remote Sensing and Spatial Information Sciences, Volume XL-1/W3, 2013
SMPR 2013, 5 – 8 October 2013, Tehran, Iran
identification and detection of various substances on the imaging procedures needed to carry out the separation of the sub-pixel level (Harsanyi et al., 1994). These algorithms include: CEM, MF, MTMF and ACE. After applying these algorithms on an image, the output of each algorithm gives a contribution map in gray level images of the intended target (Boardman et al., 1995). Now, by applying an appropriate threshold for each algorithm, prone areas in the hydrocarbons seeps are obtained. These algorithms only require information about the target and the background is not required (Chang, 2007).
2.5 Geometric Correction
In this study for geometric correction of Hyperion image, panchromatic band of Landsat-8 that has a spatial resolution of 15 m was used. It was done with precision of 0.37 pixels in control points.
2.6 Field Spectrometry
In order to collect data in the field spectrometry, the desired area were first identified and defined. After the initial stages, the field spectrometry was performed using a spectrometer model FieldSpec®3.
(a)
(b)
Figure 2. Hydrocarbon seeps in the area (a) and its spectrum recorded (b)
3. RESULTS
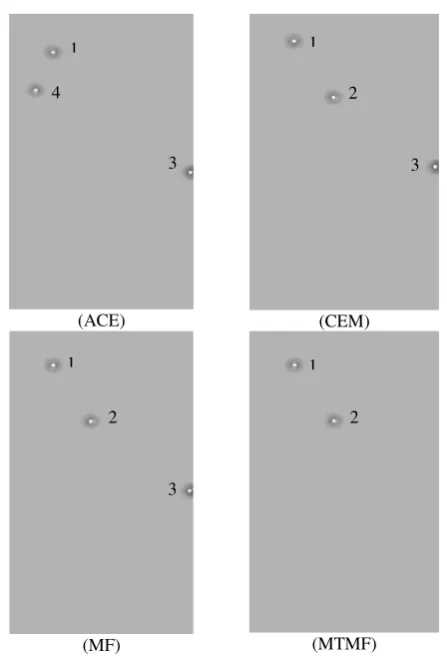
According to the method, the output of the algorithm is as follows:
(ACE) (CEM)
(MF) (MTMF)
Figure 3. The final output is obtained as the result of applying various algorithms to detect hydrocarbon seepages on the
Kamaron Hyperion image. White dots are expressing hydrocarbon seeps.
Position of the oil area pixel, were compared with existing map in the Exploration Directorate of NIOC1. By the comparison, it was found that points 1 and 2 are calculated correctly. Point 3 and 4 were not found on the map. These two may be indicative of other oil seepages. So, to verify this result, the field operations are required. It is worth noting that with the exception of points 1 and 2, there was no other places as oil seepage in the existing map of our study area. In other words, there were no seepages in the existing map of study area that not found by our approach.
Figure 4.Show of oil seepages in the area that identified in this study (stars)
1
National Iranian Oil Company
1 1
1 1
2 2
2
3 3
3 4
International Archives of the Photogrammetry, Remote Sensing and Spatial Information Sciences, Volume XL-1/W3, 2013 SMPR 2013, 5 – 8 October 2013, Tehran, Iran
4. CONCLUSIONS
This study evaluated the potential of remote sensing technology to identify the oil seepages. Since the process of hydrocarbon exploration is relatively complex and costly, we can easily realize the importance of using technologies and sciences in facilitating and reducing exploration costs. As was also seen in this study, the use of remote sensing technology can facilitate the exploration process, and also avoid a series of additional costs. Additionally, due to the large number of bands in hyperspectral images, these hyperspectral images can provide many capabilities in target detection. While, regarding the broadband of multi-spectral images, spectral properties of many materials are mixed and cannot be separated.
5. REFERENCES
P. Barry, "EO-1/ Hyperion Science Data User’s Guide, Level 1_B," TRW Space, Defense & Information Systems, November 2001.
D. Manolakis, D. Marden, and G. A. Shaw, "Hyperspectral image processing for automatic target detection applications,"
Lincoln Laboratory Journal, vol. 14, pp. 79-116, 2003.
B. Datt, T. R. McVicar, T. G. Van Niel, D. L. B. Jupp, and J. S. Pearlman, "Preprocessing EO-1 Hyperion hyperspectral data to support the application of agricultural indexes," Geoscience and Remote Sensing, IEEE Transactions on, vol. 41, pp. 1246-1259, 2003.
J. C. Harsanyi and C.-I. Chang, "Hyperspectral image classification and dimensionality reduction: an orthogonal subspace projection approach," Geoscience and Remote Sensing, IEEE Transactions on, vol. 32, pp. 779-785, 1994.
J. W. Boardman, F. A. Kruse, and R. O. Green, "Mapping target signatures via partial unmixing of AVIRIS data,": in Summaries, Fifth JPL Airborne Earth Science Workshop, JPL Pubication 95-1, vol. 1, pp. 23-26, 1995.
C.-I. Chang, Hyperspectral data exploitation: theory and applications: Wiley. com, Chapter3, 47-73, 2007.
International Archives of the Photogrammetry, Remote Sensing and Spatial Information Sciences, Volume XL-1/W3, 2013 SMPR 2013, 5 – 8 October 2013, Tehran, Iran