MONITORING OF LANDSLIDES WITH MASS MARKET GPS: AN ALTERNATIVE
LOW COST SOLUTION
A. Cina a , M. Piras a, H. I. Bendea a
a
Politecnico di Torino - DIATI, 10129 Turin, Italy - (alberto.cina, marco.piras, iosif.bendea)@polito.it
KEY WORDS: Low cost, GNSS, Virtual RINEX, Network RTK, deformation monitoring
ABSTRACT:
The territory of Italy is seriously afflicted by hydrological risk, with 82% of its area affected by this phenomenon.
In recent years, technologies and advanced research have played an important role in realizing complex automatic systems devoted to landslide monitoring and to alerting the population. Sometimes, the cost of these systems (communications network, sensors, software, technologies) prevents their use, and in particular the cost of sensors has a large impact on the final investment. For example, geodetic GNSS receivers are usually employed to conduct landslide monitoring, but they are costly.
Nowadays, new technologies make it possible to use small and efficient low cost single frequency GPS receivers, which are able to achieve a centimetric or better level of accuracy, in static positioning. The rapid development and diffusion of the GNSS network to provide a positioning service has made it possible to use single frequency receivers, thanks to the use of virtual RINEX. This product is generated by a network of permanent stations.
In this research, the actual performance of a mass market GPS receiver was tested, with the purpose of verifying if these sensors can be used for landslide monitoring. A special slide was realized, in order to conduct a dedicated test of the detection of displacements. Tests were carried out considering two factors: acquisition time and distance from the Virtual Station. The accuracy and precision of movement determination were evaluated and compared, for each test, considering the different factors. The tests and results are described in this contribution.
1. INTRODUCTION
A dual frequency GNSS receiver is usually employed in applications regarding monitoring of deformations and movements because a high level of precision is required, and this is traditionally guaranteed using both the L1 and L2 frequencies. It is a well-known approach which can be used both for large and small-scale investigations.
Nowadays geomatic techniques can reach a very high level of accuracy and thus model the earth’s surface and its changes over time with data having very high resolution (Pirotti et al., 2013). These aspects are the reason for preferring the use of dual frequency receivers to the single frequency option for monitoring movements and deformations. In particular, in the case of a large area or with control points that are far from the monitored area, this choice has been preferred.
Moreover, the use of a single frequency receiver, in fact, has some limitations such as: length of baseline, ionospheric residuals that cannot be eliminated with a carrier phase combination (e.g., ionofree).
These limits can cause the single frequency receiver to be less efficient in estimating the ambiguity values of the carrier phase, with respect to dual frequency. This characteristic is not negligible because, in order to have the best positioning performance in terms of precision, it is necessary to have the ambiguity values correctly estimated as integers.
The existence of a network of GNSS CORS (continuous operating reference stations) devoted to RTK (real time kinematic) positioning could allow us to overcome some of these limitations. Bias model estimation is realized by the network and this permits us to create a special file of raw observation data called VIRTUAL RINEX (hereafter VRINEX). This is similar to traditional raw data, but contains data from a receiver located in a position close to the user. It is
generated initially from the raw data of each CORS belonging to the network and an estimated bias model.
It is advantageous to create a VRINEX close to the rover position, in order to have a small (few meters) baseline, or in an extreme case, it is possible to realize a null baseline, eliminating the bias with the double differences in a relative positioning. The use of a VRINEX allows an independent solution with respect to the master-rover distance and it is possible to refer the
movements to “hypothetical” points which are not included in the deformation phenomenon.
The master data defined by the VRINEX is not really materialized in the ground, but its observations are generated by the NRTK in a defined position.
Nowadays, there are several available mass-market GNSS receivers which are very cheap (about 200-300€) and light (a few grams). These solutions are completely different from the first GPS receivers, which were very bulky and expensive. Actually, the new generation of receivers is usually offered as a chipset or customized with a dedicated interface (Figure 1). Less expensive equipment is of high interest in many fields of study (Guarnieri et al. 2013). Low cost, small size and low power consumption are key factors in choosing these single frequency receivers especially to describe the phenomenon of deformation with a large number of monitoring points and a high number of sensors involved in the field (Baldo et al., 2002).
In particular, where it is difficult to recover a receiver or where they may be damaged (rock fall, atmospheric event, etc.), mass market receivers can be considered as “throwaway instrumentation”, with less economic damage than the use of geodetic receivers.
The performance of a mass market single frequency receiver with an NRTK will be analyzed in the following sections.
Figure 1. New generation of single frequency GNSS receiver (u-blox)
2. SINGLE FREQUENCY RECEIVER AND NRTK
Before analyzing the actual performance of the mass-market receiver for deformation monitoring, it is important to verify the quality and repeatability of a VRINEX, and in particular if the use of this product for a relative positioning makes it possible to achieve the same precision as is possible using raw data produced by a real CORS.
After that, the use of VRINEX for fixing the ambiguity with a single frequency receiver used as a rover will be tested. Before verifying the capability to detect movements with a mass market receiver using a network RTK (hereafter NRTK) and their limits, it is important to investigate if the relative positioning obtained using the VRINEX data produces the same accuracy which can be obtained using a real CORS GNSS. The possibility of using the virtual station in order to estimate a reliable integer value of the phase ambiguity with a single frequency receiver will also be investigated.
The vertical accuracy using the virtual station is also analyzed. Several different virtual stations (at different altitudes) have been considered, in order to calculate the residuals between the coordinates estimated with relative positioning and the coordinates set to the virtual station.
Horizontal and vertical components were separated in the analysis. Two CORSs (Torino and Vercelli) were considered as the real data stations, and the GNSS network of the Regione Piemonte (http://gnss.regione.piemonte.it) was instead used to generate the virtual RINEX (Cina et al., 2010a; Cina et al., 2010b; Dabove et al., 2012).
The static test was realized acquiring raw data for 24 hours with a sampling rate equal to 1Hz. Each block has been divided into small parts (5, 10 or 15 minutes each), in order to consider the effect of the acquisition time on the final results and to consider also the complete constellation.
2.1 Horizontal accuracy with VRINEX
In this case, the Vercelli permanent station was considered because it is not included in the calculus of the network cited above, and therefore the bias model is independent of this site. Five different positions for the virtual station, at distances coordinates were compared, where the horizontal difference was investigated.
Relative positioning with double differences was carried out using the LGO v8 package by Leica Geosystems.
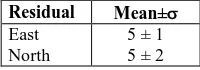
Residuals are reported in Figure 3. Mean and standard deviation are described in Table 1.
Figure 2. VRINEX with increasing distance from the CORS (Vercelli)
It can be seen that the maximum residual is less than 8mm and there is no linear dependency between the residual and distance, thanks to the available bias models which are estimated by the network.
Figure 3. Horizontal residual with respect to the master-virtual station distance.
Residual Mean±
East 5 ± 1
North 5 ± 2
Table 1. Horizontal residuals in [mm]
2.2 Vertical accuracy with VRINEX
The vertical component has to be analyzed in a different way from the previous one, considering the different contributions made by variations in the tropospheric layer thickness with altitude.
The same approach described above was used here. Several VRINEX with the same horizontal coordinates and different ellipsoid heights were generated.
Different heights were considered, from 311m (ellipsoid height of the reference station in Torino) to 3000 m, considering the division reported in Figure 4.
Ellipsoid height of each VRINEX:
Figure 4. VRINEX with different ellipsoid heights with respect to the CORS (Torino)
The length of the theoretical baseline should be equal to the difference between the ellipsoid height of the reference height (311 m) and the VRINEX height.
The horizontal and vertical residuals are reported in Figure 5, with respect to the ellipsoid height of the virtual station.
Figure 5. Horizontal and vertical residual vs altitude
In this case, the vertical residuals depend on the ellipsoid height, by contrast with the horizontal components.
The maximum residual is in the vertical component, with a gradient equal to 0.5 cm for each 1000 m of difference in height. The error in the horizontal component due to height variation is less than 4 mm, even with h = 3000 m.
2.3 What is the performance of the single receiver using an NRTK?
Using the same methodologies and approaches as described above, the performance of the mass market receiver using a Network RTK was analysed.
After verifying the possibility of reaching a positioning with millimeter level accuracy using the virtual station, the potential of the single frequency receiver u-blox 5T (Figure 2) was extended, using an external antenna on a known point. In this first experiment, a geodetic GNSS antenna was employed: this is not a low-cost solution but it allows us to achieve the best accuracy, as described below (see §3.3).
Changing the distance between the master and rover station and taking advantage of the GNSS network of the Regione Piemonte, VRINEX are respectively generated at different distances: 0.1, 1, 5, 10, 20, and 40 km from the station point, where the u-blox receiver is placed in acquisition mode for 24 hours.
This acquisition was subsequently divided into "shorter sessions" of observations of 5 and 10 minutes duration, which made it possible to calculate:
• 144 baselines with session duration of 10 minutes
• 288 baselines with session duration of 5 minutes
for each virtual station (6 in all).
It is possible to evaluate the differences between the calculated position with double differences and the known position of the receiver.
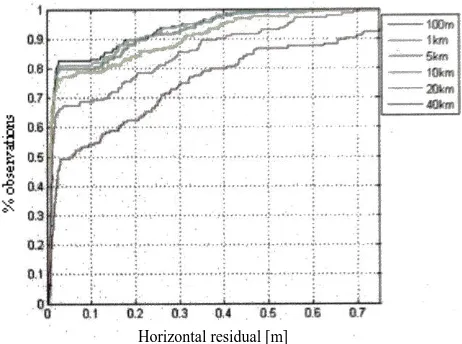
These variations in horizontal and vertical components are plotted as cumulative graphs in Figures 6, 7, 8 and 9. The residuals value are reported in X and the corresponding percentages in Y. In Figure 6 and Figure 8 the acquisition time is equal to 5 minute, in Figure 7 and Figure 9 it is 10 minutes.
Different colours represent each of the residuals obtained using stations at different distances.
It is evident that a session length of 5 minutes is insufficient to reach centimeter accuracy with a single frequency receiver, as it is rarely possible to fix the phase ambiguity. In this case, a short baseline (100 m) does not offer any benefits compared with working with a larger distance (e.g. 40 km).
Figure 6. Horizontal residual vs % – u-blox 5T – 5 minutes
Figure 7. Horizontal residual vs % – u-blox 5T – 10 minutes
A session length of 10 minutes allows the ambiguity phase to be fixed as an integer and to have a centimetric level of accuracy in 80% of cases, with a baseline within 10 km. This percentage is only referred to case where the phase ambiguity was fixed as integer. Important benefits are reported with a short baseline (up to 1 km). Adopting an acquisition time of 15 minutes does not lead to any greater advantages (Piras et al., 2011).
Similar tests were carried out with a dual-frequency geodetic receiver and showed that a session length of 5 minutes is enough to fix the ambiguity in more than 95% of cases, and a centimetric level of accuracy in both components can be achieved using a baseline up to 40 km (Figure 10 and Figure 11).
Mass-market single frequency receivers are also able to achieve high precision when used with the products of the network when the acquisition time is 10 minutes. The sensitivity to detect small movements due to deformations will be analyzed in the following section.
Horizontal residual [m] Horizontal residual [m]
3. PERFORMANCE OF MASS MARKET RECEIVERS FOR DEFORMATION MONITORING
A possible strategy to verify the sensitivity of mass market receivers to detect small displacements consists of imposing a known movement and then comparing it with the movement calculated using the positions due to the post-processing.
Figure 8. Vertical residuals vs % – u-blox 5T – 5 minutes
Figure 9. Vertical residuals vs % – u-blox 5T – 10 minutes
The variables are different:
- the type of receiver and data available (single or dual frequency);
- the characteristics of the antenna (may affect the accuracy of measurement).
An acquisition time of 10 minutes was considered, and it may be sufficient to fix the ambiguity of phase receivers respectively in single and dual frequency. For some phenomena, it may still be useful to use a shorter acquisition time, applying a stop and go method and considering an opportune static initialization step.
3.1 Test with controlled movements: the “micrometric slide”
A dedicated device that makes it possible to apply known horizontal and vertical displacements of the antenna with sub-millimeter accuracy was constructed. This special support
(Figure 12), was built at the Laboratory of Topography of the Politecnico di Torino – DIATI, and it is composed of a calibrated hardened steel bar, with a special support that allows us to use a known point as forced centering. The horizontal and vertical movements are imposed with hand-wheel that control the sliding on the rails, where the direct reading is performed on a millimeter tape.
Figure 10. Horizontal residuals using a geodetic receiver and t=5 min
Figure 11. Vertical residuals using a geodetic receiver and t=5 min
The straightness of the bar was precisely verified by performing several measurements with the levelling rod in different positions.
The mechanisms devoted to rectifying the slide allowed us to obtain a high precision of the movement definition along the path. All the controls demonstrated that the precision of the slide movement is always better than 1 mm, and therefore this
value can be considered as the “scale resolution” of this support.
The size of this slide allows us to impose movements up to 1.30 m in the horizontal component and 30 cm in the vertical one.
Figure 12. Micrometric slide for controlled deformations
Vertical residual [m]
Vertical residual [m]
Once one part of the slide was located in the control point, it was possible to orient the bar in a predetermined direction (e.g. north). The azimuth of the bar can be calculated, considering the coordinates of the known points, in order to estimate directly the deformation in terms of variation with respect to the starting point.
Figure 13. Antenna support: patch (left) and geodetic (right)
The bar was mounted in a known direction which was defined with two known points that were determined with a static positioning GPS. Several scenarios, in terms of instruments, were considered:
- geodetic receiver and geodetic antenna;
- mass market receiver (L1 - u-blox 5T) and geodetic antenna (Figure 13 right);
- mass market receiver (L1 - u-blox 5T) and patch antenna (Figure 13 left).
3.2 Movement determination with a geodetic receiver
Starting from a known position, the antenna was slid along the path with known displacements, remaining stationary for 10 minutes for each step. This period of time was enough to fix the ambiguity phase both in single and double frequency, as demonstrated above.
The measurement protocol enables us to impose known displacements in the range of 2.5-5 cm, without variation in the height. At the end of the bar, the return was realized by changing the height in increments of 5 cm for each step. The displacements from 1 to 9 are only carried out in horizontal direction; the displacements from 10 to 13 are instead carried out only with vertical variation.
GNSS raw data was elaborated, comparing the estimated coordinates with the known ones.
The vertical differences between the imposed displacement and the estimated one are described in Figure 14.
The residuals are reported in Table 19, considering both horizontal and vertical components.
As expected with a geodetic receiver, fixing of the ambiguity was always achieved and the coordinate differences were limited to a few millimeters. This result is considered the best obtainable for the two categories of analyzed receivers.
-0,050
Figure 14. Vertical displacement detection [m]
3.3 Movement determination with a mass-market receiver
The mass market receiver is equipped with its own small antenna, but the phase centre variations (PCV) are unknown. In order to place the antenna over a known point, a special small ground plane was created (Figure 13), which allows precise location. To determine the PCV of the patch antenna, a static measurement of 3 hours was realized, calculating the coordinates of the antenna as the difference between the estimated coordinates and the known ones. These differences were applied to the estimated coordinates during the test. The measurement protocol used was the same as the geodetic receiver, as previously explained. The calculated positions were compared with those imposed, obtaining the residuals which are reported in Figure 15 and summarized in Table 19.
Figure 15. Coordinates differences [m] – mass market receiver and patch antenna
In this case, the residuals are greater than the values obtained using the geodetic receiver, while the ambiguity is also fixed as integers here. This aspect is particularly highlighted in the vertical component, where the differences can exceed 3 cm and appear rather scattered.
In another test, the u-blox receiver was connected to a geodetic antenna already used with the geodetic receiver with a professional splitter. Using the same measurement protocol, the differences between the calculated coordinates and those imposed were newly estimated Figure 16 and Table 19.
Figure 16. Coordinates differences [m]– mass market receiver and geodetic antenna
It is evident that the use of a good antenna can influence the positioning accuracy: the residuals obtained with this configuration are comparable and not worse than those obtained with the geodetic receiver (see §3.2). Obviously, deformation monitoring with a geodetic antenna is not a low cost solution. However, there are several antennas on the market that may represent an intermediate proposal between the geodetic and low cost solutions, with prices that are comparable to mass-market receivers.
A final consideration concerns the possibility of reducing the acquisition time.
The last test carried out is dedicated to analyzing the “stop and go” technique, in which the acquisition time for each step was less than 1 minute, considering an initialization step of 20 minutes. The geodetic antenna was also used here.
From analysis of the results (Figure 18, Table 19) of the residuals between the calculated and known coordinates, only a small increase is noted, but the precision achieved with the
“stop and go” method is similar to geodetic receiver performance.
Figure 17. Coordinates differences [m] – mass market receiver and geodetic antenna in stop & go
4. CONCLUSIONS
The realized slide allows us to apply known displacements to a GNSS antenna with accuracy better than 1 mm. These movements are estimated using GNSS measurements in different ways. A summary of the results is reported in Table 19, where only the first test is realized with geodetic equipment and processed in a rapid-static approach, considering an acquisition time of 10 minutes. In the other tests, the receiver is a mass market class, combined with a patch antenna (2) or a processing with a mass-market single frequency receiver allows this class of device to be used for monitoring or surveying. This class of receiver costs 200-300 € and is able to acquire only the carrier phase on L1.
It is comparable to the more expensive geodetic receivers in the following particular conditions:
• acquisition time dl at least 10 minutes; • base-rover distance within 1 km;
• use of an external antenna according to the characteristics of
accuracy required.
The end user will need to evaluate the device customization or their interfaces: in this paper, only the performance in terms of accuracy and precision is considered.
Obviously, a geodetic receiver allows the best performance to be achieved, especially regarding the time of initialization, but for application where it is important to use “throwaway receivers” or a high number of devices in the field, the mass-market receiver is an interesting alternative.
The acquisition time of 10 minutes can be reduced if adequate initialization is realized.
The limit of the distance between master and rover receivers is not too problematic if a network of permanent stations is involved, and in particular if it is possible to create a VRINEX in an approximate position close to the rover.
Where high precision is required, it is important to pay attention to the choice of external antenna, which should not increase the final cost of the complete system, but should reach performance similar to a positioning with a geodetic antenna.
The networks NRTK can give new emphasis to the use of GNSS mass-market receivers, if the conditions previously described are verified, allowing the use of these devices in different geomatic applications, such as surveying and deformation monitoring. reti permanenti GNSS. In: Atti della 13° Conferenza Nazionale ASITA – Bari, 1-4/12/2009, pp. 717-722.
Dabove, P., De Agostino, M., Manzino, A., 2012. Achievable positioning accuracies in a network of GNSS reference stations. In: Global Navigation Satellite Systems: Signal, Theory and Applications / Jin S.G. InTech, pp. 189-214. ISBN 9789533078434.
Gili, J.A., Corominas, J., Rius, J., 2000. Using Global Positioning System Techniques in Landslide Monitoring. Engineering Geology, 55, pp. 167-192.
Gledan, J. 2004. Development of Low Cost GPS Strategies for Deformation Monitoring, PhD thesis. University of Newcastle, Newcastle upon Tyne, UK. 216 pages.
Guarnieri, A, Pirotti, F, Vettore, A., 2013. A low-cost MEMS sensors and vision system for motion and position estimation of a scooter. Sensors, 13(2):1510-1522.
Piras, M., Marucco, G., Cina, A., 2011. Mass-Market Receiver for Static Positioning: Tests and Statistical Analyses. In: Coordinates, vol. 7 n. 1, pp. 16-18. - ISSN 0973-2136.
Pirotti, F., Guarnieri, A., Vettore, A., 2013. State of the art of ground and aerial laser scanning technologies for high-resolution topography of the earth surface. European Journal of Remote Sensing, 46, pp. 66-78.
![Figure 8. Vertical residuals vs % Vertical residual [m]](https://thumb-ap.123doks.com/thumbv2/123dok/3243734.1397690/4.595.52.288.151.327/figure-vertical-residuals-vs-vertical-residual-m.webp)
![Figure 14. Vertical displacement detection [m]](https://thumb-ap.123doks.com/thumbv2/123dok/3243734.1397690/5.595.324.516.396.521/figure-vertical-displacement-detection-m.webp)
![Figure 16. Coordinates differences [m]– mass market receiver and geodetic antenna](https://thumb-ap.123doks.com/thumbv2/123dok/3243734.1397690/6.595.56.291.460.593/figure-coordinates-differences-mass-market-receiver-geodetic-antenna.webp)
