AN EVALUATION ON DIFFERENT NUMBER OF GROUND CONTROL POINTS IN
UNMANNED AERIAL VEHICLE PHOTOGRAMMETRIC BLOCK
K.N. Tahar
Dept. of Surveying Science & Geomatic Engineering, Faculty of Architecture, Planning and Surveying,
Universiti Teknologi MARA, Malaysia –
[email protected]
Commission II, WG II/2
KEY WORDS: GCP configuration, UAV, Photogrammetry, DEM, RMSE
ABSTRACT:
This paper presents a novel method of unmanned aerial vehicle image processing using photogrammetric technique. The study area consist different slope class which involves undulating area around the Skudai area, Malaysia. All photogrammetric methods were applied in this study including selection of test area, flight planning, camera calibration and image processing orientation. A new ground control point configurations is introduced in this study as a generic approach in unmanned aerial vehicle photogrammetric block. These configurations are used to determine the best photogrammetric results based on number of ground control points in the photogrammetric block during image processing. The objective of this study is to determine the best configuration for photogrammetric block in order to produce the best photogrammetric products. Photogrammetric image processing involves two main orientations which are known as interior orientation and exterior orientation. Interior orientation involves the parameters of camera in order to calibrate the image in the same position as during the image acquisition. Exterior orientation involves the measurement of tie points to tie up all images in the strips until photogrammetric block. In this study, six ground control point configurations were tested to determine the best photogrammetric results. In this study, two main photogrammetric results were produced namely digital orthophoto and digital elevation model. The verification results show that all configurations recorded coefficient percentage of more than 97 % accuracy for the six configurations. The validation results conclude that ground control point plays an important role in photogrammetric block to acquire the accurate photogrammetric results. In this study eight and nine ground control point configurations are the best configurations among the others. Qualitatively, vector plot error for easting and northing coordinates can be viewed graphically to distinguish the error and direction for all configurations which has been proposed in this study.
1. INTRODUCTION
Over the last few years, various achievements and improvements of the UAV systems has been done by numerous researchers from different disciplines. UAV systems receive high demands in business, research institutes and industries since UAV is one of the simple and cheapest equipment in image acquisition. Indeed, it can fly at low altitude and provides very high resolution image of the ground surface. UAV also promised a low-cost flight mission alternative to the classical manned aircraft (Marzolff and Poesen, 2009). UAV can be used in an inaccessible area and high risk location which is very dangerous to be carried out by human. However, most of UAV has its own limitation in terms of payload and sensor because UAV performance depends on its specification such as weight, endurance hour, range and payload capacity This study only concentrates on UAV weighing less than 5 kilogram, UAV endurance less than one hour, UAV range 320 meter and payload less than 2 kilogram. The quality of UAV image depends on the sensor type used to captures images on the ground surface. Several types of sensor are attached on the UAV according to the application needed. UAV requires less time in data acquisition stage and it reduces the cost of image acquisition compared with classical manned aircraft (Aber et al., 2010).
In advance technology, UAV has been installed with autopilot with flight plan programmed. Therefore, UAV can be flown autonomously during data acquisition. UAV can either be manually, semi-autonomously or autonomously controlled depending on the operator during flight mission. Usually an operator studies the area of interest including environmental condition and site situation before any flight mission. During autonomous flight mission, an operator needs to monitor the UAV condition from the computer on the ground. Ground control station communicates with the UAV via radio modem that allows operator to monitor the attitude, altitude, battery status, azimuth and speed of the UAV. In emergency cases, an operator can override the autonomous flight mission and control it manually using a remote control. Our previous study (Tahar and Ahmad, 2012) investigated the capabilities of UAV to captured images of simulated model and this study shows that UAV is capable of producing highly accurate results in mapping work. We have discussed the exploration of three dimensional model of undulating simulated model from UAV-based images. The potential application for this study is soil loss volume determination which requires digital orthophoto (DO) result and digital elevation model (DEM) of simulated model. However, these results can be improved with the investigation of different digital camera resolution, different focal length and different number of ground control points (GCPs). Therefore, this study investigates the effect of number
International Archives of the Photogrammetry, Remote Sensing and Spatial Information Sciences,
GCPs in image processing based on block configuration. A proposed image registration introduced by (Bulatov et al., 2011) was used in this study; co-registration process and geo-referencing process in DO.
In this study, we implemented the different approaches in photogrammetric images processing. A new GCP configuration was designed for the UAV photogrammetric block. The objective of this study is to identify the residual mean square error for different number of GCPs in image processing for the production of DO and DEM results which is useful for 3D Geoinformation developments. Six GCP configurations were established in this study. Fixed-wing UAV was used as a platform for image acquisition. The test arrangement is explained in section 3 and the results are explained in section 5. Section 6 consists of the analysis of this study.
2. RELATED WORK
Researchers are required to overcome numerous obstacles during UAV image process in order to obtain accurate results. Therefore, many researchers have studied different aspect of image processing for their applications. Several researchers have identified and investigated numerous parameters that affected the quality of UAV images. These parameters are; high inclination angle, different camera focal length, poor overlapping areas between side lap and forward lap, different flying height, different exposure time, higher distortion during image acquisition, different pixel size and environmental condition. Many previous researchers have studied the effect of four different season, different sensor system and under different condition in data collection results. Some researchers study the accuracy of point clouds that affected the accuracy points in aerial triangulation (Rosnell and Honkavaara, 2011).
In the previous studies on fixed-wing UAV, Laliberte et al. (2006) investigated the capabilities of the bat 3 UAV in image classification for rangeland mapping and monitoring purposes. Two approaches were done in this study; i.e. photogrammetric approach and image-matching approach. Both approaches were able to successfully generate the DO and DEM. It has been mentioned that photogrammetric approach provides high accuracy result but is more time-consuming while image matching approach, on the other hand, is faster in processing images but it has lower planimetric accuracy and is difficult in terrain extraction. The quality of UAV raw images depends on several factors during flight mission such as wind direction, camera trigger frequency, flying altitude, and shadows. The quality of UAV images can be increased if UAV flies against the wind direction. This can reduced UAV speed and avoid blur images during flight mission. User needs to adjust the camera trigger frequency before image acquisition because automatic camera trigger is responsible in capturing all images which is the same as flight plan. Otherwise, user needs to carry out several flight missions at the same area to avoid image loss during data acquisition. UAV flying speed needs to be determined before flight mission based on UAV flying altitude. The flying speed can determine the number of images that were captured in one strip. Shadow might affect the quality of UAV images if flight mission takes too long to be completed and this may affect the image matching process (Rock, et al., 2011).
In the previous studies on rotary-wing UAV, autonomous flight with ground control station allows helicopter UAV to acquire image for rapid emergency response cases. Helicopter UAV can provide an image of the ground until centimeter resolution for DO. A digital camera is mounted at a nadir angle which is automatically triggered during flight mission. Pre-programmed flight trajectory is combined with an automatic camera triggering system to capture the images of the area of interest during flight mission (Haarbrink and Koers, 2006). Manyoky et al., (2011) used Octocopter Falcon 8 for cadastral surveying. This study compared the accuracy of UAV images in cadastral surveying and GNSS data combined with tachymeter. Octocopter is suitable for site inspection, object documentation and aerial photography because it is maneuverable and is stable even during the wind speed of up to 10m/sec. Octocopter is installed with a compass, inertial measurement unit (IMU), barometric sensor and global positioning system (GPS). In various civil applications, UAV helicopter has been used in the object recognition cases. UAV is attached with the magnetic sensor that enables it to acquire object profile under the earth surface (Christoph and Benedikt, 2011). In other case of study, UAV helicopter was integrated with a thermal sensor to recognize bodies in disastrous areas. Search and rescue (SAR) was developed by Molina et al., (2011) to offer fast response and real time body identification image in disastrous areas. Tahar and Ahmad (2012) investigated the capabilities of rotary unmanned aerial vehicle in the production of digital orthophoto and digital elevation model. This study was done by using simulated model and the comparisons between fixed platform and mobile platform were discussed. The simulated model was constructed based on the undulating surface in order to represent the real ground surface. In conclusion, it was mentioned that UAV images were able to provide high accuracy photogrammetric results after going through photogrammetric processing.
3. TEST ARRANGEMENT 3.1 Test Area
The study area is located at Skudai, Johor, Malaysia. It approximately lies between the latitudes of 1d33m19.355sN to 1d34m8.222sN, the longitudes of 103d38m48.392sE to 103d39m36.902sE and it covers an area of 1.5km2. The images based on different GCP configurations. The elevation range of the study area is about 10 meter to over 70 meter above mean sea level. This area was selected based on easy access, furthermore, it is near to the facility and is located at the new development area.
3.2 Flight Planning
Before flight mission an operator needs to identify the coverage of the study area in sequence to design flight plan. The flight plan requires an approximate coordinates as an input to design the flight route. This study used aerial photogrammetric method as a primary method in data acquisition. Therefore, user needs to determine the percentage of overlap area and side lap area between the pair of the images in the flight plan. User
International Archives of the Photogrammetry, Remote Sensing and Spatial Information Sciences,
can calculate these percentages using the distance of exposure station and dimension on the ground. User is also required to identify the camera focal length information and required scale of the aerial photograph. These parameters can be used to decide on the results of data acquisition during flight mission. The information of camera parameters can be found from camera calibration processed such as focal length, principal point, radial lens distortion, tangential lens distortion, affinity. The camera calibration processed will be explained in detail in the section on camera calibration.
In this study, Lentsika software is utilized to design flight route at the study area. Lentsika software requires several information from the flight route design such as ground resolution required, scale required and an approximate coordinate of study area. Google Earth is attached as a background image to design the flight route of the study area. Google Earth image helps user to recognize the location of the study area quickly. This software produces the number of flight lines that are needed to cover the whole study area which includes exposure station for each flight line. Exposure station is very important in order to ensure all image pairs overlapped in the required percentage. The flight route file is exported to Horizon software to finalize the flight lines before the flight mission. Horizon software is equipped with compass screen, altimeter screen, flight attitude screen, barometer screen, and flight lines screen. Horizon software is used in ground monitoring station during the flight mission while radio modem is used to enhance communication between ground monitoring station and UAV. After the completion of flight lines design, user needs to proceed with the UAV inspection. UAV inspections involve hardware examination such as UAV mainframe body condition, motor, camera mount, wing, throttle, autopilot chip, GPS chip and electronic speed controller (ESC). Operator must make sure that all UAV parts are in good condition to avoid any obstacle during flight mission. After the inspection is completed, the operator can proceed in downloading flight plan file into auto pilot chip. Auto pilot chip is used for autonomous flight mission, which means that no operator is required to control UAV during flight mission. As mentioned before, flight plan contains a number of flight route including strips, direction of UAV and exposure station coordinate for specific mission. Flight plan file is downloaded into autopilot chip via cable from computer. Operator should make sure all files are successfully downloaded into autopilot chip. GPS onboard is essential in UAV for autonomous flight mission. Therefore, operator needs to check GPS onboard by using GPS detector to verify whether the GPS is working or not. GPS onboard is responsible to locate the coordinates that was design by the operator before flight mission. Finally, before flight mission, the operator needs to check the elevator, yaw and pitch movement of the UAV. UAV is launched by handing launching and landing using net which is setup during flight mission. Net is setup at an open area to avoid any damages of UAV during landing operation. However, it is impossible for fixed-wing UAV to land on the ground without any damages. Net is one of the alternative methods to absorb UAV speed and to hold UAV during landing operation. In this study, the flight mission took about 40 minutes to cover the whole study area. Two flight missions were carried out due to the technical error of the first flight mission, which did not have the GPS log file required for image processing. 102 images that were contained in the 6 strips were acquired in order to cover the whole study area.
However, only 60 images were processed in this study due to the area of interest to fulfill the objective of this study.
3.3 Camera Calibration
Digital camera was used as a tool to capture image from the air at the study area. High resolution digital camera with 12 megapixel resolution was used in this study. Each digital image has horizontal and vertical dimension of about 4000 pixel x 3000 pixel respectively. A plate calibration was used to carry out self calibration bundle adjustment of digital camera. A plate calibration consists of 36 reflective targets which has different height. During calibration process, digital camera was positioned at four different angle and two different views such as portrait and landscape views. The angle and distance between digital camera and plate calibration were consistent at four different positions. These steps were done in order to maintain the parameters during camera calibration. Scale bar was used as the fixed length and it was placed on the plate calibration during calibration process. The images were processed using camera calibration software which is also known as Austalis. Australis is one of the calibration software that is available in the market. Australis software requires at three information of the digital camera such as estimated camera focal length, estimated pixel size and camera resolution. After going through certain processes in this software, all camera parameters were identified and were used in the interior orientation process. The parameters are camera focal length, principal point x and y, radial lens distortion, processing. Configuration 1 only involves four GCP, configuration 2 involves five GCP, configuration 3 involves six GCP, configuration 4 involves seven GCP, configuration 5 involves eight GCP and finally configuration 6 involves nine GCP. The analysis section explains the effect of each configuration in easting, northing and height coordinates. Each configuration represents the different number of GCP and different locations of GCP in the photogrammetric block of UAV image processing. In hypotheses sentence, each configuration gives different result in the aerial triangulation results because GCP is used to relocate the processed UAV images to the local coordinate systems. Figure 1 illustrates the different GCP configurations in this study.Figure 1 shows the GCP configuration which was applied in this study. These configurations were used to determine the level of accuracy of photogrammetric results such as DO and DEM. GCPs were established by using Real Time Kinematic Global Positioning System which gives an accurate measurement in centimeter. Each GCP obtained adjustment data from the virtual reference station from department of survey Malaysia. Therefore, each GCP required two to three minutes of observation time to establish the station coordinates. The proposed GCP configurations were applied after the interior orientation and relative orientation were completed. Absolute orientation used GCPs to transform images coordinates to local coordinates system. The results of each configuration are illustrated in result section.
International Archives of the Photogrammetry, Remote Sensing and Spatial Information Sciences,
a b c d e f Figure 1. Ground Control Point Configurations for Photogrammetric Block (a) 4GCP, (b) 5GCP, (c) 6GCP, (d) 7GCP, (e) 8GCP,
(f) 9GCP
5. PHOTOGRAMMETRIC PROCESSING AND RESULTS
Photogrammetric processing involves two main orientations which are known as interior orientation and exterior orientation. Interior orientation can be quite fast if photogrammetric software is used. Using digital camera, interior orientation is imported from the camera calibration results. Although, exterior orientation involves image matching algorithm to tie up all image pairs at the study area. Image matching algorithm is in charge of correlating the features between two images at one model. This measurement is also known as tie point measurement. Tie point measurement can be done manually or automatically. Manual tie point measurement involves a skill from user to identify the same features from the different image which overlapped with each others. Automatic tie point measurement usually involves image matching algorithm to identify the same features in two or more images. User needs to determine the correlation size and coefficient limits before proceeding with auto-tie measurement. An additional step, user can define the distribution pattern of automatic tie points in order to obtain accurate photogrammetric results. In Photomod software, user can run automatic tie points directly after performing the interior orientation process. User can generate bad and good tie points in the study area and edit the bad points later. In this study the good tie points were selected based on r-squared value and feature matching. R-squared is below one and feature matching between two images should be the same. The example of tie point measurement using Photomod software
is
described in Figure 2.
Figure 2. An Example of Tie Point Measurements
Figure 2 illustrates that the selection of tie points can be done manually or automatically. However, tie points generation is based on von grubber position in sequence in order to distribute the tie points evenly in the photogrammetric model. At least 12 tie points are established with two points for each von grubber position. Von grubber position has six positions of the model which are located in the overlapped area in the photogrammetric model. However, user needs to check the correlation error of auto-tie point measurement to make sure the measurement is still in good quality. User may select the poor and moderate automatic tie point quality. Finally, user can edit the point and can improve the quality of tie point. At least three GCPs must be established in order to proceed with the aerial triangulation process. The advantage of this study is in
GCP establishment for the photogrammetric block. Six GCP configurations are carried out in several experiments to identify the effect of GCP configuration in photogrammetric results. As mentioned before, GCPs are used to relocate images into local coordinate systems. After performing exterior orientation, user can execute aerial triangulation process. Aerial triangulation can calculate the coordinate of tie point that is measured before based on the distance and angle from GCPs coordinates. In this study, two main photogrammetric results were produced for example DEM and DO. DEMs were generated from the aerial triangulation points based on cell size from the user input. The smooth surface of DEM can be defined from the output cell size during DEM generation. However, the processing time can be increased if cell size is smaller. Once the DEM has been produced, then the DO can be generated instantaneously. DO is produced from the single orthoimages and user needs to perform mosaicking process to get a final DO result. The overlapped single othoimages are illustrated in Figure 3. Figure 3 shows the coverage of study area based on single orthoimages after it went through all photogrammetric processes such as interior orientation and exterior orientation.
Figure 3. Overlapped UAV Images at the Study Area
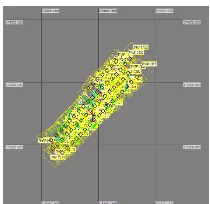
Single orthoimages can be generated by using different resampling methods such as nearest neighbor method, bilinear interpolation method and cubic convolution. In this study bilinear interpolation resampling method was used in DO generation. Other resampling methods are not discussed in this study. User may input the required cell size for the single orthoimages results. Mosaicking process involved a number of single orthoimages which need to be represented on one single DO. In the mosaicking process, user can set the color correlations algorithm such as histogram matching and color balancing. User can select other advanced tools such as set overlap function such as overlay, average, minimum, maximum, or feather functions. Six mosaicking results represent the different number of GCPs in this study. Figure 4 shows the footprint for one of the GCP configuration in this study with the local coordinate system.
Based on Figure 4, about 60 images were located in four strips in order to cover the whole study area. The distribution of tie points and GCPs were shown by using different symbols and colors. The yellow color shows the image frame for all images in this study.
International Archives of the Photogrammetry, Remote Sensing and Spatial Information Sciences,
Figure 4. Photogrammetric Block for 60 UAV Images
6. ANALYSIS
All photogrammetric results that were obtained after going through photogrammetric processing were assessed. Two methods were used in order to determine the accuracy of results. First method was applied linear fit equation to determine the level of data precision. Equation of linear fit was used to determine the level of precision for the proposed GCP configurations. Using this equation, coefficient in percentage for each configuration can be identified. Table 1 shows the coefficient in percentage for configuration 4GCP until 9GCP. Based on this result, it can be concluded that easting and northing coordinate record 100 percent which is very precise while height coordinates record slightly difference.
Table 1. Result on Coefficient Percentage based on Different GCP Configurations.
GCP Configuration
4 GCP
5 GCP
6 GCP
7 GCP
8 GCP
9 GCP Coefficient
(%)
E 100 100 100 100 100 100
N 100 100 100 100 100 100
h 98.7 98.5 98.4 97.9 98.2 98.1
4GCP until 9GCP configuration records slightly different result in which all configurations recorded a coefficient of more than 97 percent. These results show that the GCP configurations affected the photogrammetric results. However, it must be remembered that the angle between GCP can also have an effect during the image processing because the angle between GCP will be calculated during bundle adjustment process. In this study, we only focused on GCP configuration which has
different number of GCP. The second method was applying root mean square equation (RMSE) to determine the level of accuracy for photogrammetric results. Figure 5 shows the plot RMSE graph for each configuration versus RMSE value. The graph splits the RMSE result based on RMSE vector for Easting and Northing and individual RMSE for Easting, Northing and height respectively.
Figure 5. Line Graph for RMSE Value based on Different Number of GCPs.
Based on this figure, it can conclude that RMSE vector for Easting and Northing record below than +0.5 meter while each individual RMSE for Easting, Northing and height record below than +0.4 meter, +0.4 meter and +0.9 meter respectively. RMSE analysis is based on the 17 sample of checkpoints that were established evenly at the study area. As explained in test arrangement section, the study area is an undualting area consists of different types of slope angle thus it can affect the accuracy of photogrammertic result. However, in this study we only focussed on RMSE for all GCP configurations without concentrating on the RMSE effect by different slope angle. Based on RMSE graph, it can be concluded that configuration with 8GCP and 9GCP gives the better result in RMSE vector for Easting and Northing. The residual error for each checkpoint can be analyze graphically using vector line error. Figure 6 illustates the vector line error for Easting and Northing coordinates based on the checkpoints.
a b c d e f Figure 6. Vector Plot Error for Easting and Northing Coordinates based on Different GCP Configurations
Figure 6 describes the error direction of Easting and Northing coordinates based on different GCP configuration which includes 4GCP, 5GCP, 6GCP, 7GCP, 8GCP, 9GCP respectively. Based on these result, vector error shows a random pattern, which means all errors were contributes evenly after bundle adjustment processing. The magnitude error for Easting and Northing coordinate decreased when the
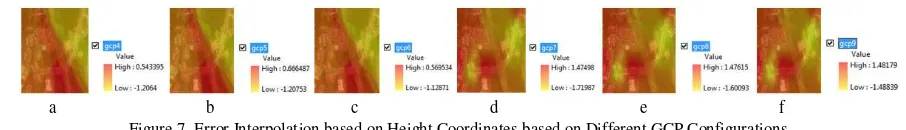
number of GCP is increased. It is because the number of GCP can contribute to the correction of aerial triangulation process for all points including tie points and GCP. The residual error for height coordinate is assessed graphically (Figure 7). Height coordinate contributes major error in RMSE vector for Easting, Northing and height coordinates since height coordinates were affected by the undulating surface at the study area.
International Archives of the Photogrammetry, Remote Sensing and Spatial Information Sciences,
a b c d e f Figure 7. Error Interpolation based on Height Coordinates based on Different GCP Configurations.
From Figure 7, it can be viewed that GCP configurations affected error in height coordinates. The maximum and minimum errors were recorded in order to determine the range value between maximum and minimum error for each configuration. The range value for 4GCP, 5GCP, 6GCP, 7GCP, 8GCP, 9GCP records +1.750 meter, +1.874 meter, +1.698 meter, +3.195 meter, +3.077 meter, +2.970 meter respectively. Based on this result, it can be concluded that each GCP configuration gives different results. The range error is decreased after 7GCP. It was found that, the range of error slightly different for each GCP configurations.
7. CONCLUSION
A novel methodology was discussed in this study where six DO and DEM were successfully generated in this study based on six GCP configurations. Based on the analysis section, each GCP configurations contributed different errors in photogrammetric block. Based on the linear fit analysis, all configurations record coefficient data of more than 97 percent. In the RMSE analysis record, 8GCP and 9GCP recorded good results for RMSE vector of Easting and Northing coordinate with +0.5 meter. Individual RMSE for each coordinates recorded the values between +0.3 meter to +0.9 meter. It can be concluded that, fixed-wing UAV is able to give a result below than +0.8 meter with respect to the best GCP configuration which has been done in this study. Therefore, the best map that can be produced using these results is large scale map with scale one in five thousand. The potential applications are namely telecommunication analysis, slope mapping analysis and urban heat island analysis. A new method of GCP configurations is very useful in the 3D Geoinformation especially for UAV photogrammetric block in order to reduce the establishment of ground control point at the site area. It is recommended for future researchers to apply rotary UAV in image acquisition at the same study area. The comparison of photogrammetric results between fixed-wing and rotary-wing UAV can be done.
8. REFERENCES
Laliberte, A.S., Winters, C., Rango, A., 2006. Acquisition, orthorectification, and classification of hyperspatial UAV imagery Jornada Experimental Range, USDA ARS, New Mexico State University, Las Cruces, NM.
Bulatov, D., Solbrig, P., Gross, H., Wernerus, P., Repasi, E., Heipke, C., 2011. Context-based urban terrain reconstruction from UAV-videos for Geoinformation applications.
International Archives of the Photogrammetry, Remote Sensing
and Spatial Information Sciences, Vol. XXXVIII-1/C22
UAV-g 2011, Conference on Unmanned Aerial Vehicle in Geomatics, Zurich, Switzerland.
Christoph, E., Benedikt, I., 2011. Aerial Magnetic Sensing With An UAV Helicopter. International Archives of the
Photogrammetry, Remote Sensing and Spatial Information
Sciences, Vol. XXXVIII-1/C22 UAV-g 2011, Conference on
Unmanned Aerial Vehicle in Geomatics, Zurich, Switzerland.
Rock, G., Ries, J.B., Udelhoven, T., 2011. Sensitivity analysis of UAV-photogrammetry for creating digital elevation models (DEM). International Archives of the Photogrammetry, Remote
Sensing and Spatial Information Sciences, Vol.
XXXVIII-1/C22 UAV-g 2011, Conference on Unmanned Aerial Vehicle in Geomatics, Zurich, Switzerland.
Marzolff, I., Poesen, J., 2009. The potential of 3D gully monitoring with GIS using high resolution aerial photography and a digital photogrammetry system. Geomorphology, 111 (1-2), pp. 48–60.
Tahar, K.N., Ahmad, A., 2012. A simulation study on the capabilities of rotor wing unmanned aerial vehicle in aerial terrain mapping. International Journal of Physical Sciences,
7(8), pp. 1300 – 1306.
Manyoky, M., Theiler, P., Steudler, D., Eisenbeiss, H., 2011. Unmanned aerial vehicle in cadastral applications.
International Archives of the Photogrammetry, Remote Sensing
and Spatial Information Sciences, Vol. XXXVIII-1/C22
UAV-g 2011, Conference on Unmanned Aerial Vehicle in Geomatics, Zurich, Switzerland.
Aber, J.S., Marzolff, I., Ries, J.B., 2010. Small-format aerial
photography. Principles, techniques and geoscience
applications. Elsevier, Amsterdam, pp. 268.
Molina, P., Colomina, I., Vitoria, T., Silva, P.F., Stebler, Y., Skaloud, J., Kornus, W., Prades, R., 2011. Egnos-based multi-sensor accurate and reliable navigation in Search-and-rescue missions with UAVs. International Archives of the Photogrammetry, Remote Sensing and Spatial Information
Sciences, Vol. XXXVIII-1/C22 UAV-g 2011, Conference on
Unmanned Aerial Vehicle in Geomatics, Zurich, Switzerland
Haarbrink, R.B., Koers, E., 2006. Helicopter UAV for Photogrammetry & Rapid Response. Geocopter B.V. Pascalweg 23, 4104 BE Culemborg - The Netherlands.
Rosnell, T., Honkavaara, E., 2011. Point Cloud Generation from Aerial Image Data by Quadrocopter Type Micro Unmanned Aerial Vehicle and Digital Still Camera. Sensor.
9. Acknowledgements
Faculty of Architecture, Planning and Surveying Universiti Teknologi MARA (UiTM) and Faculty of Geoinformation & Real Estate, Universiti Teknologi Malaysia (UTM) are greatly acknowledged. The authors would also like to thank the Sustainability Research Alliance, UTM for providing the fund that enabled this study to be carried out.
International Archives of the Photogrammetry, Remote Sensing and Spatial Information Sciences,