Techniques for methods of collection, database management and
distribution of agrometeorological data
P.C. Doraiswamy
a,∗, P.A. Pasteris
b, K.C. Jones
b, R.P. Motha
c, P. Nejedlik
daUnited States Department of Agriculture, Agricultural Research Service, Beltsville, MD 2075, USA
bUnited States Department of Agriculture, Natural Resources Conservation Service, National Water and Climate Center, Portland, OR, USA cUnited States Department of Agriculture, World Agricultural Outlook Board, Joint Agricultural Weather Facility, Washington, DC, USA
dSlovak Hydrometeorological Institute, Kosice, Slovak Republic
Received 8 October 1998; received in revised form 2 September 1999; accepted 7 September 1999
Abstract
The major concerns for the availability of climate and agrometeorological data as we move into the 21st century continue to be in areas of data collection and data base management. New technologies have advanced our ability to address these issues but the solutions may require the commitment of resources that may yet be outside the reach of developing countries. This paper briefly reviews new and existing technologies in the areas of data collection methods with some emphasis on remote sensing methods. An example for a conceptual data base management system adapted by the US Department of Agriculture is presented as a framework for the acquisition, maintenance and distribution of climate and agrometeorological data for the 21st century. The access of data to the national and international community can be resolved with the standardization of data base management and electronic accessibility. Databases in the US have been upgraded for access through the World Wide Web, and include data archived from other countries that have co-operative programs with US institutions. The operational needs of national agricultural producers, researchers, and agricultural weather and crop forecasters are the focus of this paper although it also serves some of the needs of the international research community. © 2000 Published by Elsevier Science B.V. All rights reserved.
Keywords: Agrometeorological database; Climate data collection; Climate data management; UCAN; WMO
1. Introduction
The availability of a proper meteorological and agrometeorological data base is a major prerequisite for studying and managing the processes of agricul-tural and forest production. In an examination of the ‘Agrometeorological Needs and Perspectives in the 21st Century’, the building of a database of
mete-∗Corresponding author. Tel.:+1-909-680-1552;
fax:+1-909-680-1510.
E-mail address: [email protected] (P.C. Doraiswamy)
orological, phenological, soil and agronomic infor-mation is inevitably a major priority. The acquisition of pertinent climate and agrometeorological data, processing, quality control, archive, timely access and database management are important components that will make the information valuable and used in agricultural research and operational programs.
Agrometeorological observations are focused
mostly to the important food-producing areas around the world. Because of wide territorial scope, the basic national databases that include meteorological, cli-matological and crop phenological data are typically
kept and maintained by the National Meteorological Services. The building of these databases usually are dependant on the availability of technical personnel, and the hardware and software resources at the local level. The recent development in personal computer technology, database software, and the adoption of advanced interpretative systems like Geographic In-formation System (GIS), have brought large data volumes closer to the end users. As the use of agrom-eteorological data depends on the defined purposes, the accuracy and the management of the data can be different and should be defined accordingly.
Great strides in the automation age have offered new ways of making data products available to the user community, particularly in industrialized coun-tries. The introduction of electronic transfer of data files via Internet using File Protocol Transfer (FTP) and the World Wide Web (WWW) has advanced this information transfer process to a new level. The WWW allows users to access text, images and even sound files that are linked together electronically. The attributes of WWW include the flexible to handle a wide range of data presentation methods and the pop-ularity to reach a large audience. The development and access to this type of electronic databases may currently be limited to industrialized countries.
The WWW interface handles the communication between a remote server, where the data files reside, and the user’s display capability. This interface is controlled by a series of scripts and programs, which execute commands to read, process, and display data products. The data can be stored in a self-describing file format. The scripts and programs to generate menus for the WWW interface can read the informa-tion that describes the content of the data file (i.e., metadata). This modernization of data observing, pro-cessing, archiving, and display have made available worldwide large quantities of environmental data. The increasing challenge is to manage these growing resources of data so that users can efficiently extract needed information for their specific applications.
The global climate community and specifically the agricultural climate community has great interest in incorporating these new information technologies into a systematic design for agrometeorological data man-agement. The goal is to ensure that the climate and agrometeorological data bases needed by the agricul-tural sector are collected, quality controlled, archived,
and disseminated in a timely manner. Any such de-sign needs to facilitate the collection, organization, analysis, and dissemination of data from a national agricultural weather and climate station data network for global, national, regional, state, and local pro-gram management and policy decisions and for dis-semination to the public for use in the preparation of value-added services.
A recent attempt has been made in the US to promote the creation of such an agricultural climate database system. The National Agricultural Weather Information System (NAWIS) was designed to be a partnership between National Weather Service (NWS), US Department of Agriculture (USDA), and other public and private sector users. The goal is to facilitate the collection, organization, analysis, and dissemination of data from a national agricultural weather and climate station data network. The princi-pal users are Federal, State, and local program man-agement, policy decision-makers, and the public for use in the preparation of value-added services. The goals of the program are to provide (a). A nationally coordinated agricultural weather information system, based on the participation of Federal and State agen-cies, colleges and universities, and the private sector and aimed at meeting domestic agricultural weather and climate information needs. (b). Data for research and education, aimed at improving the quality and quantity of weather and climate information available to agricultural producers, including research on data analysis of weather and climate, particularly as they affect ecosystems.
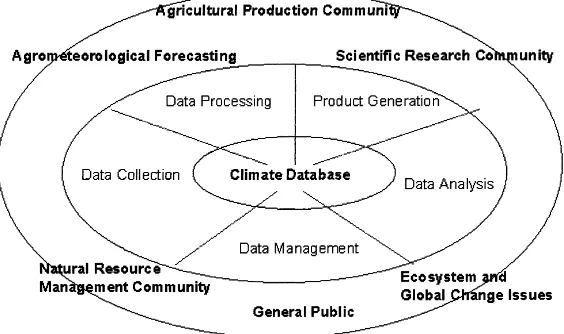
2. Conceptual database
Fig. 1. Climate information system — a conceptual database design.
the initial database is the essential building block for a diverse set of functions that depend on the user needs. There are a wide variety of users, some requiring only basic general information for their decisions, others demand more detailed and specific data products for further analysis.
The various elements in the conceptual design will be investigated in some depth, drawing on the experience and opportunities that now exist in the technologies of personal computers and the WWW. The intent of this paper is not to be a ‘how to’ cook-book, but rather a review of basic concepts of design. The concept of a database system for the 21st century is derived from USDA’s experiences in the set up of a Unified Climate Access Network (UCAN). The UCAN consists of a consortium of State and Federal organizations, which record, manage and archive me-teorological data (Pasteris et al., 1997). The primary goal is to provide access to nationally, regionally and locally-managed climate data to a clientele of researchers, decision makers, and other users world-wide via the Internet. Each participating organization maintains a computer that serves its climate data to the UCAN. This ‘node’ functions in concert with other UCAN nodes to perform distributed searches, retrievals and analyses of requested sets of meteoro-logical observations. The various UCAN data servers involved in the process of searching for, assembling, and distributing climate data sets to the public are
coordinated through an efficient catalog of all me-teorological observing stations from which data are archived and disseminated by the UCAN.
3. Data collection
3.1. Operational data needs of interest to agriculture
Agricultural weather and climate data systems are necessary to expedite generation of products, analy-ses and forecasts that affect agricultural cropping and management decisions, irrigation scheduling, com-modity trading and markets, fire weather management and other preparedness for calamities, and ecosystem conservation and management. Basic data collection activities should ensure that information on weather and climate, and their impact on crops, livestock, wa-ter and soil resources, and forest management can be processed, analyzed and distributed in the most effi-cient and timely manner. WMO publications 100 and 134 (WMO, 1983, 1986) should serve as guides to the spatial and temporal array of parameters necessary for successful operations.
3.2. Methods of data observation
wide scope. Agrometeorological station networks are designed to observe the data of meteorological and biological phenomena together with supplementary data as disasters and crop damages occur. Meteoro-logical data can be considered as typically physical elements that can be measured with relatively high accuracy while other types of observation are in many cases much more subjective and vary with the observer. In collecting, managing and analyzing the data for agrometeorological purposes, the source of data and the methods of observation define their character and possible management. The number of parameters observed differ with the method of data collection.
The method of observation can be categorized into two major classes, manually observed and automated data collection stations. A third source for agrome-teorological data that is gaining recognition for its complementary nature to the traditional methods is satellite remote sensing technology. An introduction to this topic is presented only as a source of data and no attempts will be made to prescribe a database system for remote sensing data.
3.2.1. Manually observed data
Manually observed data mainly form the basis of agrometeorological information not only in the plan-ning but also in the operative use. While the system of manually observed meteorological data collection is well established and standardized, the definitions of agrometeorological data are not so specific and the collection and control of these data are much less unique. The typical observations are air temperature, relative humidity, sunshine duration, wind run, pre-cipitation and pan evaporation. Though the method-ologies of agronomic data observation are quite well defined from the general point of view, the prac-tice varies greatly even on the regional level based on variety and species. Observations are generally dates for planting, a few key stages of crop develop-ment and harvest. Plant height and crop water stress conditions may be observed for selective crops and situations. Following are some basic considerations for agronomic measurements:
• Observations are from a plant community and not
single plants.
• There are much more descriptive elements in the
observation.
• The frequency of the observation is different and can vary during the growing season.
• In Europe (WMO, 1988), up to 40% of collected
phenological data and used it operationally.
• 30% of countries collecting phenological data do
not include it data in their database.
The collection of manually observed data is highly time consuming with transmission done by a variety of methods and frequencies. But, as stated in WMO (1997), in many countries the main mode of transmit-ting data from observing sites to the national climate data centers is by radiotelephones supplemented by postal returns at designed time intervals. It is a slow system, but the indications are that it Will remain in place for a long time to come. These data are then typically entered into a computer data file. The im-plementation of the climate computing (CLICOM)
(http://www.gsf.de/UNEP/wcdmp.html) project by
WMO has afforded many countries a much higher level of data processing and data control, however, the CLICOM system has not been accepted as a univer-sal standard and many countries have adopted other integrated systems of data processing and archiving. The type and data collection method then, plays the decisive role in data processing and management.
3.2.2. Automatic weather station data (AWS)
AWS is becoming the ideal method for collection of climate and agrometeorological data, and is a ne-cessity for many real-time operational programs. The data are now automatically collected from electronic media and automatically transmitted over the radio or telephone systems. The initial cost is high to establish the network but in the long run it is a more efficient method for simplified data processing and archive. This technology continues to evolve and the decline in costs makes it within reach especially in developed countries. The maintenance of these stations requires more technical skills and can be centralized to mini-mize costs.
rainfall, soil temperature (multiple depths), pan evap-oration, leaf wetness and soil moisture over a limited range. Manual and AWS data need to be archived at designated centers if possible. In the US, for example, data are archived at six regional data centers and at offices of the state climatologists.
3.2.3. Remotely sensed data
Remotely sensed data and AWS systems provide in many ways an enhanced and very feasible alterna-tive to manual observation for a very short time span between data collection and transmission. In certain countries where only few stations are in operation as in northern Turkmenistan (Seitnazarov, 1999), remotely sensed data can improve information on crop condi-tions for an early warning system. We have over two decades of experience in the use of data acquired from geostationary and polar orbiting satellites than any other forms of remotely collected data. Geostationary orbiting environmental satellites (GOES) can measure frequent surface temperature, solar radiation (cloud cover) and relative rainfall. Access to the other geosta-tionary satellites spanning the globe should be possi-ble through international cooperation. Unlike the po-lar orbiting satellites, the GOES satellites can provide continuous monitoring of the Earth’s atmosphere and surface over a large region of the western hemisphere in a geosynchronous orbit. These satellites monitor po-tential severe weather conditions, such as tornadoes, flash floods, hail storms, and hurricanes. The GOES Imager instrument consisting of five channels rang-ing from the visible to the infrared wavelengths, has a ground resolutions of 1 and 4 km at nadir.
The GOES sounder carries 18 thermal infrared channels. Each of the GOES satellites scans pre-determined areas of the earth from the Mid Pacific region to the eastern Atlantic region. During routine mode, observations are taken four times every hour, but when severe weather threatens, the GOES Imager is capable of 1 min interval scanning over a smaller area. A variety of products from the sounder and imager are created operationally. These products are archived at the National Climatic Data Center (NCDC) (http://www.ncdc.noaa.gov/ol/satellite/satellite prod-ucts.html)
Polar orbiting satellites such as NOAA’s advanced very high resolution radiometer (AVHRR) sensor can collect daily surface temperature and vegetative
growth and condition (relative crop water deficit). The ground resolution of observation is 1.1 km for NOAA AVHRR data covering most parts of the globe and is complete. Kogan (1994, 1995) developed the Global Vegetation Index (GVI) product, which provides in-formation for the area between 75◦N and 55◦S and
produces weekly assessment of (16 km resolution) relative changes in seasonal land cover by compar-ing the data with normal dynamics of vegetation. The magnitude of the GVI is calibrated to delineate drought areas when a major drought is in progress.
Doraiswamy et al. (1997) demonstrated the use of the Normalized Difference Vegetation Index (NDVI) to monitor biweekly changes in crop growth and de-velopment at 1 km spatial resolution. In an operational mode, the spatial and temporal information derived from NOAA AVHRR data can provide an early warn-ing to potential drought conditions. The integration of remote sensing data with ground-based climate data has been demonstrated for monitoring evapotran-spiration and vegetation growth at watershed scales (Kustas et al., 1994; Maas and Doraiswamy, 1996). Doraiswamy et al. (1998) integrated remote sensing data with crop simulation models to monitor crop condition and yields at regional scales in the US. Moussa (1999) discusses an approach where NDVI is integrated with yield monitoring and forecasting systems in Niger.
There are other numerous remote sensing satellites that are in operation, but only systems that are directly pertinent and have been in use for agrometeorologi-cal observations are presented. These remote sensing methods of data collection are based on measurement of reflected (short-wave) and emitted (thermal) elec-tromagnetic radiation from the surface of the earth. The data processing can be rigorous, however, most processing software are standardized for retrieval of basic information that is useful for agrometeorolog-ical applications. Proper calibration and atmospheric correction of imagery data is still a major concern in data processing especially for application in retrieval of crop growth parameters.
instrumental in promoting and establishing these cen-ters in developing countries. Programs such as the Famine Early Warning System (FEWS) sponsored by the US State Department rely on remotely sensed data as a surrogate for agrometeorological data when no ground data is available.
Newer technologies on the horizon such as those on NASA’s Tropical Rainfall Measuring Mission (TRMM) satellite is being investigated for their ac-curacy in estimating the magnitude and spatial dis-tribution of rainfall. The TRMM is a joint space project with Japan. TRMM is designed to mea-sure rainfall in the tropical belt. TRMM’s unique combination of sensor wavelengths, coverage, and resolving capabilities together with a low-altitude, non-sun-synchronous orbit provides a sampling capa-bility that should yield monthly precipitation amounts to a reasonable accuracy over a 500 km×500 km grid. The NASA Goddard Distributive Active Archive Center (DAAC) has been archiving TRMM data since the November 1997 launch has been released to the public. The data are useful for forecast model research, disaster mitigation, climatological studies, agricultural predictions, and many other applications.
The need for supplementing the measurement of such a highly spatial variable parameter as rainfall was clearly recognized at the earliest conception of TRMM (Thiele, 1987). A corollary objective involves a substantial supporting research component to pur-sue process studies for better understanding and char-acterization of various rain systems and to improve surface-based measurements of rainfall by advancing radar and rain gauge technology. Characteristics of rainfall cover a wide range of temporal and spatial scales, affecting both in situ validation and remote sensing measurements.
Because of the high spatial and temporal vari-ability of tropical rainfall intensity, estimation of rainfall patterns by in situ networks and remote sens-ing platforms require special attention to spatial and temporal statistical properties of rainfall. One of the goals of this mission is to measure rain rate inten-sity distributions, and spatial and temporal statistics of rainfall variability. TRMM is effective only in the tropical belt and may be the best solution in the long run. These methods have been investigated (Rosenfeld et al., 1993, 1995) and will continue
to be evaluated by cooperators from around the world.
4. Data transmission
New technologies allow many entities to collect climate data, however, proper management, process-ing and database establishment of the information are the keys to success. In many cases, the data must be shared to order to ensure a representative spatial depiction of the climate for a specific area. Each net-work has internal protocols to observe and a database of the information collected. It is this processing of the information that requires significant coordination to ensure that stations are correctly identified and the data are properly associated with the station.
4.1. Manual data forwarding
The basic options for an observer to transmit climate information once it has been collected have expanded dramatically. The following techniques may be used, some very effectively, if funds are not available to invest in an automated climate station.
• Mail (postal service)
• Telephone (voice w/recorder and subsequent
tran-scription)
• Touch-tone electronic entry directly to a data
collection computer system
• Internet browser entry directly to a data collection computer system
The Internet option can provide the observer with the tools needed to interactively enter, quality control and view not only their observations, but from others who have reported their observations in both a text and graphic environment.
4.2. Automated data forwarding
Once data are collected by an automated climate station, a mixture of both old and new technologies can be accommodated for data transmission. The tech-nologies are summarized as follows:
• Radio; land-based line-of-sight repeaters directly to a computer system
• GOES downlink to a computer system
• Meteor-burst communications (http://www.wcc.
nrcs.usda.gov/bbook/bb25 .html)
Each method has its own strengths and weaknesses. Each can be tailored to meet specific mission require-ments based on location, frequency of observation and costs, both installation and maintenance. The informa-tion collected by these networks can be integrated with other databases once data protocols are established.
5. Data exchange formats
The electronic exchange of climate data has been made easier thanks to the high-speed computer net-works of the Internet. However, the need for common exchange formats has grown more critical. A wide va-riety of exchange formats exists and has been adopted for use. This presentation focuses on a human and machine-readable format in wide use within the US as an example.
5.1. SHEF — standard hydrometeorological exchange format
The standard hydrometeorological exchange for-mat (SHEF) (Pasteris et al., 1996) is a documented set of rules for coding of data in a form for both visual and computer recognition. It is designed specifically for real-time use and is not designed for historical or archival data transfer. All the critical elements for identification of data are covered. Station identifiers, parameter descriptors, time encoding conventions, unit and scale conventions, and comment fields are all part of the code.
SHEF was designed for interagency sharing of data, visual and machine readability, and compatibility with anticipated receiving databases. The widespread im-plementation of SHEF allows the same decoding soft-ware to process data from various agencies. New data sources can easily be added as they become avail-able. The visual nature of SHEF allows users quickly to become familiar with it. SHEF fully qualifies the data so that a receiving database has all the necessary information to describe the data. Additional
informa-tion about SHEF can be found at the following URL (http://hsp.nws.noaa.gov/hrl/shef/ index.htm).
5.2. Basic formats — .A, .B, .E
There are three formats that make up SHEF. Through the use of parameter code characters to iden-tify the data, these three basic message formats have the flexibility to transmit a wide range of hydromete-orological information. The formats are as follows:
• .A — single station, multiple parameter
• .B — multiple station, multiple parameter, header driven
• .E — single station, single parameter, evenly spaced time series
5.2.1. SHEF .A format
The .A format is designed for the transmission of one or more hydrometeorological parameters observed at various times for a single station. The .A format consists of positional fields and the data string. The format can be used for stations that report several dif-ferent types of hydrometeorological data or report data with uneven time spacing.
5.2.2. SHEF .B format
The .B format can be used for the transmission of one or more hydrometeorological parameters from several stations for which many or all of the param-eters are the same and are observed at correspond-ing times. The .B format consists of three basic parts: header, body, and terminator. The header consists of the positional fields and the parameter control string. The body contains station identifiers and data with op-tional date/data overrides. The terminator ends the en-tire .B format message. The format is useful for a rou-tine morning roundup of precipitation and river data for a group of stations.
more than three stations are to be transmitted routinely, the .B format should be more convenient.
5.2.3. SHEF .E format
The .E format can be used for the transmission of several values of a single hydrometeorological param-eter at an evenly spaced time interval for a single sta-tion. As shown further, the F format consists of posi-tional fields and the data string. This format is useful in the transmission of any evenly spaced time series of observational, processed, or forecast data.
The .E format is very similar in structure to the .A format except for two minor differences. First, in order to avoid ambiguity, the .E format accommodates only one hydrometeorological parameter while the .A for-mat can handle several. Second, the .E forfor-mat requires the explicit specification of a time interval (incremen-tal or decremen(incremen-tal) between data values. SHEF has been adopted as a NWS standard transmission format and has also been accepted as a Office of Federal Co-ordinator for Meteorology (OFCM) standard for
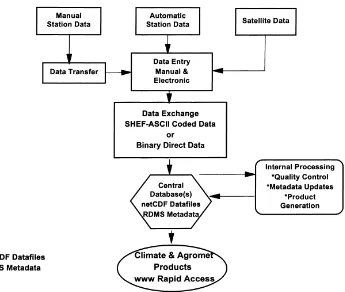
Fig. 2. Conceptual design of data acquisition, processing, data base establishment and accessability of data by users.
hydromet data transmission. A complete document describing SHEF can be found on the WWW at the following URL: http://hsp.nws.noaa.gov/hrl/shef/ index.htm
6. Data management
6.1. Introduction
large disk storage capacity. Potential users are as-sumed to have access to personal computers that have 8mm tape storage that may be slow to retrieve. The read-write CD systems offer a better alternative for storage and access to the data. Volumes of remotely sensed and AWS data are so overwhelming that the collection and processing of these data should be fully automated. Potential users of remotely sensed data are fully dependent on these data management facilities for their studies, as relatively fewer users have the resources that allow for the analysis of remote sensed information as highlighted in WMO (1996).
6.2. Data processing requirements
The design of a data processing system is directed by the users needs such as the type of data, frequency of observation, source of the data, and the format it is delivered.
Obviously if the data are being delivered via high-speed satellite downlink the process is much dif-ferent than that being manually entered. Yet both these extremes have a common data management require-ment, they have to be accepted into the system. In other words, an information system has to have multi-ple data entry points, requiring multimulti-ple user/machine interfaces, processing multiple types of information.
The PC environment (or the networked worksta-tion) offers flexible machine/human interfaces while the WWW adds dynamic and creative solutions not restricted to local computer systems or databases. In any event, the information that enters a database maintained in a computer and the products retrieved by users are their responsibility. It is critical that a long-term relationship be established with both the data suppliers and product users to ensure that hydroclimatic information is of the highest qual-ity to properly guide decisions made by natural resource decision managers. This activity requires constant attention to detail. The importance of the time devoted to basic data entry design cannot be overemphasized.
6.3. Quality control requirements
The essence of quality control is the assessment and improvement of imperfect information, by making use
of other imperfect information. The following high-light some of the reasons for data quality control:
• To insure that the exact information needed is being
properly generated.
• Inconsistent data need to be identified or will lead
to incorrect decision inputs.
• For operational needs to detect problems that
re-quire immediate maintenance attention.
• For some purposes, continuous data are required,
even if such data are estimated.
• Maintain an audit trail on data for future needs to update documentation.
• Data are often important for legal or design consid-erations.
• An established QC process attaches individual data values with flags that allow software to select data tolerance levels for product generation.
Quality control should be thought of as an end-to-end process, which is integral to the successful acquisition, temporary storage, permanent archival, and subsequent retrieval, use and interpretation of the data and information produced by a network.
Since there can be literally thousands of values to be examined (depending on a network’s size), there may be a need for automation and/or an intelligent expert system approach. Although human interven-tion is needed, good automated processes will reduce the need for intervention, and provide supplementary information to help the human make a decision. Ex-amples of quality control screening of data are found in most all-domestic networks in the US. The NCDC (http://www.ncdc.noaa.gov) performs extensive qual-ity control on the US NOAA cooperative network. These include both manual (double key entry of data manuscripts) and automated (temporal and spatial procedures). Many automated networks, including the NWS automated surface observation system (ASOS) (http://www.nws.noaa.gov/) also have built in QC filters. Whatever the process, record keeping is per-haps the most important. The establishment of QC flags for climate data is well documented for many networks. Individual datasets archived at a variety of climate centers describe the data flags used to iden-tify the level of QC (http://www4.ncdc.noaa.gov/ol/ documentlibrary/datasets.html).
develop your network QC process. The American society for agricultural engineers (ASAE) has pub-lished draft guidelines reviewing the measurement and reporting practices for automatic agricultural weather stations (Ley et al., 1994). It is an excellent source of technical standards for data management issues.
7. Metadata concepts
7.1. Station identification and history
In managing metadata it is critical to maintain all known names and aliases and identification numbers for stations. The accurate identification of data collec-tion stacollec-tions, an obviously fundamental component of metadata, is more complex than it first appears. Ge-ographic ‘place’ names are the easiest and most user friendly means of station identification. The follow-ing station description elements (Lazar et al., 1999) will be incorporated into the UCAN, on line, relational metadatabase:
• Station identity (site name, aliases, and all identifi-cation numbers including network identifiidentifi-cation)
• Location (coordinates, elevation, geopolitical place-ment, topography, etc.)
• Equipment/instrumentation and its exposure
• Data observing and dissemination practices
(net-work membership)
• Data inventory, and
• Temporal changes to any of this information.
The station history data will detail the changes in the station over time. This includes, but is not limited to, the location, naming and equipment. Such docu-mentation include the following:
• Station location changes (latitude, longitude, and elevation), station name changes,
• Time of observation for each element and dates of any changes,
• Beginning and ending dates for each reported ele-ment,
• Addition or removal of element or sensor,
• For hourly precipitation stations, type of rain gauge,
• Type of recording equipment and dates of changes,
and
• Observers names and dates of service.
7.2. Metadatabase management
The UCAN metadata database design employs a relational database, which incorporates the four rules discussed earlier in order to maintain consistency, insure flexibility, and yet accommodate the inconsis-tencies that are so common in climate station history information. The database design begins with a central table that defines a single station with a unique, in-ternal station identification number. This content-free internal station identifier is purely for database man-agement purposes (a primary key variable) and is not for distribution to data and metadata users.
Multiple station identifiers, names and aliases, networks and all other station history information are maintained in normalized tables linked by many relationships in the internal station (ID). Tables doc-umenting station attributes that change through time includes time variables (begin and end dates). The station network table contains a specific type of station identifier that is associated with a network (for example, the NCDC TD3200 network uses the NWS Coop station number). The final considera-tion in this metadata management system soluconsidera-tion is a rule for the depiction of climate data in report products.
7.3. Database management
A wide variety of database choices face the cli-mate user community. The increased use of relational databases to store significant amounts of data provides a tempting opportunity to create a climate database that comes with a significant amount of database man-agement software. These databases work well if you have a relatively small database, run the database in a central location and do not plan to exchange large amounts of data on a regular basis. There is usually a licensing agreement attached to using a commercial database, which can vary significantly based on the computer platform running the database.
8. NetCDF (Network common data form)
would be distributed among eight regional and fed-eral climate centers, and would need to support rapid access and exchange of data files between users throughout the US It was determined through pro-totype testing that NetCDF’s stored and retrieved time series information more efficiently than any other relational database available. This, coupled with the freely available software tools and ease in data exchange via the Internet, made NetCDF a logical choice. A full description of the entire UCAN Project can be found at the following URL, (http://www.srcc.lsu.edu/ucan.net/UCAN.html). The URL also supports a demonstration of the UCAN data access methodology.
NetCDF is an interface for array-oriented data access and a library that provides an implementa-tion of the interface. The netCDF library also de-fines a machine-independent format for represent-ing scientific data. Together, the interface, library, and format support the creation, access, and shar-ing of scientific data. The netCDF software was developed at the Unidata Program Center in Boul-der, Colorado. The freely available source is at (ftp://ftp.unidata.ucar.edu/pub/netcdf/) or from other mirror sites. NetCDF, is software for storing and re-trieving scientific data. More than a data format, the netCDF package is a set of programming interfaces that can be used with widely varying scientific data sets and by machines of widely varying architecture.
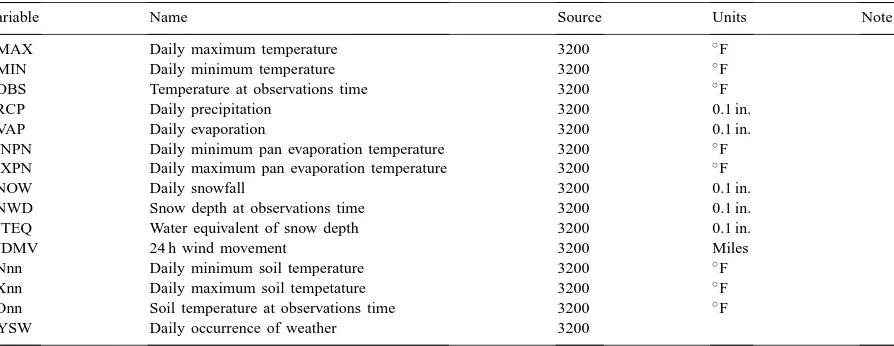
Table 1
An example of the TD 3200 — summary of the day table showing variables and their associated dimensions
Variable Name Source Units Note
TMAX Daily maximum temperature 3200 ◦F
TMIN Daily minimum temperature 3200 ◦F
TOBS Temperature at observations time 3200 ◦F
PRCP Daily precipitation 3200 0.1 in.
EVAP Daily evaporation 3200 0.1 in.
MNPN Daily minimum pan evaporation temperature 3200 ◦F
MXPN Daily maximum pan evaporation temperature 3200 ◦F
SNOW Daily snowfall 3200 0.1 in.
SNWD Snow depth at observations time 3200 0.1 in.
WTEQ Water equivalent of snow depth 3200 0.1 in.
WDMV 24 h wind movement 3200 Miles
SNnn Daily minimum soil temperature 3200 ◦
F
SXnn Daily maximum soil tempetature 3200 ◦
F
SOnn Soil temperature at observations time 3200 ◦
F
DYSW Daily occurrence of weather 3200
Multidimensional data may be accessed one point at a time, in cross sections, or all at once. Data are di-rectly accessible, permitting efficient access to small subsets of large data sets.
8.1. Climate element identification
The variables and their associated dimensions are named. An example of the TD 3200 — summary of the day (includes TD 3210) are described in Table 1. Information about the data, such as what units are used and what the valid range of data values is, can be stored in attributes associated with each variable. The processing history of a data set can be stored with the data.
8.2. NetCDF transportability
The netCDF format renders netCDF files machine independent. The netCDF package is particularly use-ful at sites with a mix of computers connected by a network. Data stored on one computer may be read directly from another without explicit conversion. The netCDF software has been used successfully on a broad range of computers, from PCs to
supercom-puters. The netCDF library can be invoked from c,
c++, fortran, or perl programming languages.
Many groups and organizations have adopted netCDF for their scientific-data-access needs. Numer-ous freely available, licensed, and commercial pack-ages for data analysis and visualization can display and manipulate netCDF data.
Unidata’s purpose in creating the netCDF library is to generalize access to scientific data so that the methods used for storing and accessing data are in-dependent of the computer architecture and the appli-cations being used. In addition, the library minimizes the fraction of development effort devoted to dealing with data formats.
Standardized data access facilitates the sharing of data. Since the netCDF package is quite general, a wide variety of analysis and display applications can use it. The netCDF library is suitable, for example, for use with satellite images, surface observations, upper-air soundings, and grids. By using the netCDF package, researchers in one academic discipline can access and use data generated in another discipline.
The Unidata netCDF package is available free of charge. It is also one component of a suite of soft-ware tools that Unidata distributes to universities. With these additional tools, universities can capture data, store them in netCDF files, and display and an-alyze them as desired. The netCDF package contains
c-language source code for the netCDF data-access
library; source code for thec++andfortran inter-faces; documentation of the netCDF library and utili-ties; and test programs to verify the implementation.
Unidata provides software revisions and upgrades to all its software tools, including the netCDF package. The netCDF software and documentation may be obtained from the netCDF WWW site at (http://www.unidata.ucar.edu/packages/netcdf/)
9. Product generation and access
9.1. Formats and products
One of the exciting features of PCs is the ability to produce quality products, formatted for easy read-ing and presentation, generated through simple word processors, databases, or spread sheet applications. However, some thought needs to be given to what the product looks like and what it contains, before your database delivery design is finalized. The greatest
dif-ficulty many be encountered when producing a critical report and it is realized that key data or information attributes are missing, especially when climatic data are combined with agricultural, and human resource information from separate databases. WMO (1986) is a good source for data formats and distribution.
9.2. Graphics
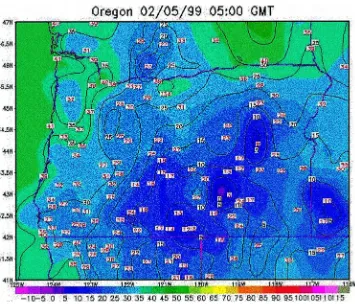
The presentation of agrometeorological data in graphical form has also been made easier via today’s computer applications. While some of us may not care about a particular software package ‘graphic style’, it may be important to have access to a suit-able package to graph information that can be cut and pasted in a report or presentations. A wide variety of software now exists to plot both time series and spa-tial information. Information about time series plot-ting can be found at (http://www.wrcc.sage.dri.edu) and information on spatial plotting can be found at (http://grads.iges.org/grads/head.htm). Fig. 3 is an ex-ample of a time series plot of NRCS SNOTEL data collected at a test site in Oregon, USA. An example of a spatial plot is shown in Fig. 4. Shades of color are used to show gradients in air temperature and also display contour lines for dew point temperature distribution.
9.3. Local processing versus remote processing
Fig. 3. Time Series Plot of NRCS Snotel Data. Courtesy Western Regional Climate Center.
9.4. Data and statistical computation
It is not our intent to cover the statistical techniques appropriate for application to climatic datasets which are thoroughly discussed in WMO (1983). Considera-tions in database and interface design requirements to aid in subsequent analysis are documented. Issues of missing data, extreme values, non-numerical values, or out-of-range values are common in data analysis. However, simple presentation of datasets to analytical software packages can be a challenge. New methods of data analyses have been developed using artificial neu-ral network analysis techniques (Michaelides, 1999). These methods have been used for estimating miss-ing data and completmiss-ing time series and many other applications. Consider carefully your ability to extract precise datasets from your database and making them available to your software package.
Common formats acceptable to most statistical packages and/or spread sheets include: comma or tab delimited ACSII text file structures, LOTUS 8, Microsoft Excel 8, SAS 8, or Quattro Pro 8 file structures. The netCDF specialized structure and for-mat has the potential of streamlining statistical data analysis and include the following:
• Raw daily lister
• Compact daily lister
• Monthly time series
• Degree day summaries
• Normal lister
• Generalized climatology
• Daily normals
• Daily percentiles
• Temperature summaries
• Frost-last and first frost dates
• Growing season length
• Extreme daily values for the month
• Monthly/annual model data
• Frequency distribution and probability.
10. Summary
The importance for climate and agrometeorologi-cal data in the operational needs of agricultural pro-ducers, researchers, and agricultural weather and crop forecasters are gaining attentions in the domestic and the international research community. Databases have
been developed in many countries although there are still quite some countries where there is a need for es-tablishing databases that are accessible for their citi-zens and the international community. Modernization of data acquisition, processing and archiving can be a costly proposition but steps need to be taken, to ensure that such data are archived in a standardized manner that can be useful.
This paper outlines the current methods of data collection and particularly introduces remote sensing techniques that may be a solution in countries that are considering upgrading their current system. Re-mote sensing data provides a spatial component of crop growth and development that cannot be collected in ground-based measurements.
Computer technologies are advancing rapidly, and therefore it is unrealistic to try and articulate all potential solutions to agrometeorological informa-tion systems for there are surely more technology solutions currently under development. It is hoped however, that the reader has been exposed to some of the key elements of what should be considered in designing and implementing a computerized climate information delivery system.
An example for a conceptual data base management system adapted by the US Department of Agricul-ture is presented as a framework for the acquisition, maintenance and distribution of climate and agrom-eteorological data for the 21st century. The access of data to the national and international community can be resolved with the standardization of data base management and electronic accessibility.
Databases in the US have been upgraded for ac-cess through the world wide web, and include data archived from other countries that have co-operative programs with US institutions. Perhaps the work cur-rently being done with UCAN in the US Department of Agriculture can be expanded into the international climate community.
Acknowledgements
Contributions for this chapter were received from S.C. Michaelides, L. Moussa and I. Seitnazarov is greatly appreciated. The authors wish to acknowl-edge the excellent technical review and recommenda-tions provided by Professor C.J. Stigter, Dr. Richard Coe and the other reviewers in preparation of the manuscript.
References
Doraiswamy, P.C., Stern, A.J., Zara, P.M., 1997. Monitoring crop progress using NOAA AVHRR data adjusted for seasonal climatic variation. In: Proc. 61th Am. Soc. Photo. Remote Sens., Seattle, WA, 7–11 April 1997.
Doraiswamy, P.C., Zara, P.M., Stem, A.J., 1998. Integration of remote sensing and simulation models for regional production assessment. Agronomy Abst., p. 21. Annual Meeting of ASA, CSSA and SSSA, Baltimore, MD, 18–22 October.
Kogan, F.N., 1994. Application of vegetation index and brightness temperature for drought detection. Adv. Space Res. 15, 91–100. Kogan, F.N., 1995. Droughts of the late 1980s in the United States as derived from NOAA polar orbiting satellite data. Bull. Am. Meteorol. Soc. 76, 655–668.
Kustas, W.P., Perry, E.M., Doraiswamy, P.C., Mora, M.S., 1994. Using satellite remote sensing to extrapolate evapotranspiration estimates in time and space over a semiarid rangeland basin. Remote Sens. Environ. 49, 275–286.
Lazar, A.V., Barthel, C.D., Kuiper, D.G., 1999. Metadata strategies for the efficient management and exchange of data throughout a unified climate access network. In: 11th Conference on Applied Climatology, American Meteorological Society, Dallas, TX, 10–16 January 1999.
Ley, T.W., Elliott, R.L., Bausch, W.A., Brown, P.W., Elwell, D.L., Tanner, B.D., 1994. Measurement and reporting practices for automatic agricultural weather stations (X5 OS Standards Project). Paper No.942086, American Society for Agricultural Engineers (ASAE) 1994 International Summer Meeting, St. Joseph, MO, USA.
Maas, S.J., Doraiswamy, P.C., 1996. Integration of satellite data and model simulations in a GIS for monitoring regional evapotranspiration and biomass production. In: Proceedings of the National Center for Geographic Information and Analysis. Third International Conference/Workshop on Integrating GIS and Environmental Modeling, Sante Fe, NM, (http ://www.ncgia.ucsb.edu/conf/sf papers).
Michaelides, S.C., 1999. Artificial neural networks: a novel approach in the analyses of meteorological data. Contribution from members in the International Workshop on Operational Applications in Agrometeorology in the 21st century, Needs and Perspectives@, Accra, Ghana, February 1999. WMO, Geneva. Moussa, L., 1999. Experiences of Niger in collection and management of agrometeorological data and their uses by agricultural services and various users (French). In: CagM Report 77, Contribution from members in the International Workshop on Operational Applications in Agrometeorology in the 21st century, Needs and Perspectives, Accra, Ghana, February 1999. WMO, Geneva.
Pasteris, P.A., Bissell, V.C., Bonnin, G., 1996. Standard hydrometeorological exchange format, Version 1.2. US Department of Commerce, Weather Service Hydrology Handbook No. 1, Office of Hydrology, National Weather Service, Silver Spring, MD, February 1996.
Pasteris, P.A., Marron, J.K., Johnson, G.L., Garen, D.C., 1997. Alliance for Progress B How the USDA-NRCS is meeting the climate challenges of the 21st century. In: Proceedings B 10th Conference on Applied Climatology, Reno, NV, 20–24 October 1997. American Meteorological Society.
Rosenfeld, D., Wolff, D.B., Atlas, D., 1993. General Probability matched relations between radar reflectivity and rain rate. J. Appl. Meteorol. 32, 50–72.
Rosenfeld, D., Amitai, E., Wolff, D.B., 1995. Improved accuracy of radar WPMM estimated rainfall upon application of objective classification criteria with radar. J. Appl. Meteorol. 34, 212– 223.
Seitnazarov, I., 1999. Technology and methods of collection, distribution and analyzing of agrometeorological data in Dashhovuz velajat, Turkmenistan. In: CagM Report 77, Contribution from members in the International Workshop on Operational Applications in Agrometeorology in the 21st century, Needs and Perspectives, Accra, Ghana, February 1999. WMO, Geneva.
Thiele, O.W. (Ed.), 1987. On requirements for a satellite mission to measure tropical rainfall. National Aeronautics and Space Administration, Research Publication, NASA RP-1 183, Washington, DC.
WMO, 1983. Guide to Climatological Practices, Second Edition. WMO Publication No. 100, Geneva.
WMO, 1986. Guide to Agricultural Meteorological Practices. WMO Publication No. 134, Geneva.
WMO, 1988. RAV Working Group on Agricultural Meteorology. WCP/AGM, CAgM Report No. 31, Geneva.
WMO, 1996. Agrometeorological Data Management. WMO/TD -No.748, CAgM Report No. 65, Geneva.