Agrometeorological aspects of agriculture and forestry in the arid zones
E. De Pauw
a,∗, W. Göbel
a, H. Adam
baInternational Centre for Agricultural Research in the Dry Areas (ICARDA), P.O. Box 5466, Aleppo, Syria bInstitute of Water Management and Irrigation, University of Gezira, Wad Medani, Sudan
Abstract
The arid zones of the world are all characterized by a large deficit of rainfall in relation to the potential evapotranspiration. Their distribution around the world is governed by the interaction of global atmospheric circulation patterns, the distribution of land and sea, and local topography. Countries that have substantial areas with arid conditions belong to very different groups in terms of resource availability, agricultural productivity, population density and wealth. Most are poorly endowed with good agricultural land. Water resources vary tremendously, both in terms of reserves and consumption. Agriculture is in most cases the main consumer of water. Most arid zone countries have high population growth, and rural population densities are generally much higher than overall population densities. They have a wide disparity in wealth. The arid zones have a surprising diversity of agroecological niches, with edaphic conditions that can deviate substantially from those of surrounding areas. These niches often have a higher biomass or agricultural productivity. At the same time they are vulnerable to natural processes such as primary salinization, wind and water erosion. Increasing pressure of human and livestock population make that these natural environmental stresses lead to accelerated degradation and depletion of soil and water resources. As they exploit the various agroecological niches, the production systems of the arid zones are equally diverse, and cover the full spectrum of land use intensification from pastoral or transhumant livestock systems to rainfed or irrigated cropping systems. These production systems show rapid change under the pressures of environmental degradation, increasing land and water shortage, and the needs of expanding populations. With the exception of irrigation management, the agrometeorological needs of the arid zones have been insufficiently addressed in the past. Perceptions of homogeneity, low agricultural potential, low population density and the logistical problems of providing maintenance and collecting data from remote stations are largely to blame for this situation. Agrometeorological research can have a positive impact on the productivity, resource-efficiency and environmental sustainability of the arid zones by supporting a better characterization of the agricultural environments. Research targeted towards data spatialization and integration of meteorological and remote sensing information will help to alleviate the handicap of sparse meteorological data networks. At the same time these networks will need to be improved through installation of automatic stations and by establishing new partnerships with land users. © 2000 Elsevier Science B.V. All rights reserved.
Keywords: Arid zones; Agrometeorology; Agroecology; Farming systems; Data spatialization
1. Arid zones of the world
The term ‘arid’ in the English language is synony-mous for ‘dry’. Possibly this is one reason why these
∗Corresponding author. Fax:+963-21-2213490.
E-mail address: [email protected] (E. De Pauw)
terms are often used as interchangeable, not only by the general public, but by scientists as well. ‘Terms like desert, drought, dryland, desertification, semi-desert, sahel, steppe, arid, semi-arid, dry sub-humid have been variously and loosely used, understood, and defined by different people and by scientists’ (Noin and Clarke, 1998).
It is therefore not surprising that this situation has led to considerable confusion in international agricul-tural research planning. For example, the International Center for Agricultural Research in the Dry Areas (ICARDA) still defines its ‘dry’ mandate region as one where the growing period is less than 180 days (ICARDA, 1996). This, of course, seems a fairly gen-erous interpretation of dryness.
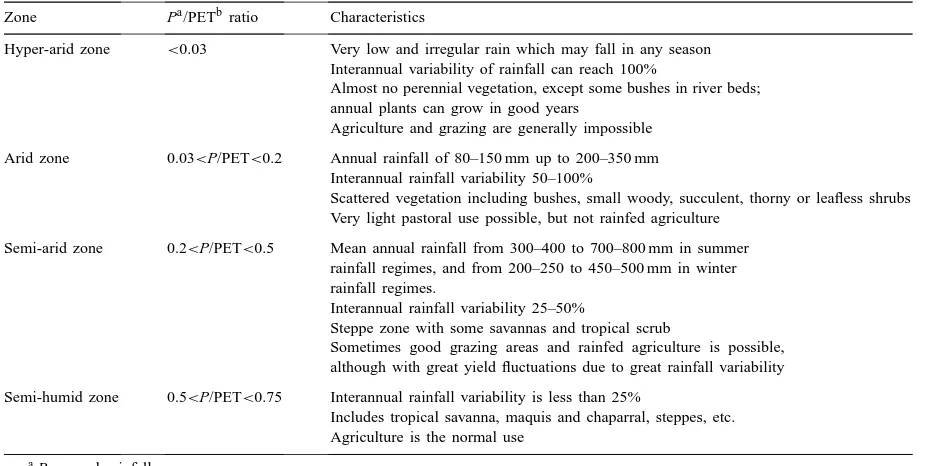
To avoid such confusion in what constitutes ‘dry’ or ‘arid’ regions, and to allow a better agroclimatic characterization of these regions, UNESCO (1979) has proposed a worldwide classification of the arid zones of the world. The latter is based on the value of the ratio of annual precipitation to annual potential evapotran-spiration, calculated by the standard Penman method (see Table 1).
This classification has been widely adopted as an international standard. Its major advantage, apart from the standardization of terminology, is that the degree of aridity can be assessed by a simple relationship between rainfall and reference water demand, which is more appropriate than using absolute rainfall amounts.
Table 1
UNESCO classification of the arid zones of the world
Zone Pa/PETb ratio Characteristics
Hyper-arid zone <0.03 Very low and irregular rain which may fall in any season
Interannual variability of rainfall can reach 100%
Almost no perennial vegetation, except some bushes in river beds; annual plants can grow in good years
Agriculture and grazing are generally impossible
Arid zone 0.03<P/PET<0.2 Annual rainfall of 80–150 mm up to 200–350 mm
Interannual rainfall variability 50–100%
Scattered vegetation including bushes, small woody, succulent, thorny or leafless shrubs Very light pastoral use possible, but not rainfed agriculture
Semi-arid zone 0.2<P/PET<0.5 Mean annual rainfall from 300–400 to 700–800 mm in summer
rainfall regimes, and from 200–250 to 450–500 mm in winter rainfall regimes.
Interannual rainfall variability 25–50%
Steppe zone with some savannas and tropical scrub
Sometimes good grazing areas and rainfed agriculture is possible, although with great yield fluctuations due to great rainfall variability
Semi-humid zone 0.5<P/PET<0.75 Interannual rainfall variability is less than 25%
Includes tropical savanna, maquis and chaparral, steppes, etc. Agriculture is the normal use
aP: annual rainfall.
bPET: annual potential evapotranspiration.
The elements needed to classify an area into one of these four categories are easily obtainable from the many world meteorological databases.
By necessity, the UNESCO classification is macro-scale and low resolution, and is unable to capture the fine detail of landscape-climate interactions, which, as will be discussed later, are of such fundamental importance in the arid regions. According to this clas-sification, rainfed agriculture is only feasible starting with the semi-arid zone, and then only with great yield fluctuations as a result of rainfall variability (Table 1).
Secondly, the relationships established by Le Houérou et al. (1993) between the annual precipita-tion/potential evapotranspiration ratio and the length of the rainy season, would indicate for the upper limit of the arid zones a maximum length of rainy season, according to the particular climatic regime, of 67–90 days. If one considers the role of soil moisture, which may add to the available growing season, rainfed agriculture appears therefore feasible at the upper rainfall limit of the arid zones, although with severe constraints.
In this paper, the agrometeorological aspects of the ‘hyper-arid’ and ‘arid’ areas will be discussed.
2. Geography of the arid zones of the world
At the most generic level arid conditions are created by the interaction between global atmospheric circu-lation patterns, the distribution of land and sea and the local topography.
The air that is heated at the equator rises and cools, loses its moisture in the tropical belt, subsides towards
subtropical latitudes 30◦N and 30◦S and heats up,
cre-ating two subtropical high pressure belts from which trade winds blow hot and dry air back towards the equator (Ahrens, 1993).
Where the trade winds blow overland, they are re-sponsible for the major desert belts and arid fringes of the world. To this category belong the Sahara, the Arabian and Iranian deserts in the Middle East, the Turkestan desert in Central Asia, the Namib and Kala-hari deserts in southern Africa, the Australian desert and the Atacama-Peruvian desert in South America (UNESCO, 1953).
On the other hand, where the trade winds blow on-shore, such as on the east coasts of Africa, South America and Australia, they bring moisture and pre-clude the existence of arid conditions.
Other arid zones, such as the Gobi and Takla Makan in Central Asia, are created simply by their central position within a huge landmass, which isolates them from oceanic sources of moisture (Fig. 1).
Outside the subtropical belt extensive arid belts may occur within the high latitudes as a result of rain-shadow effects. They are typically located on the leeward side of huge topographical barriers. This is the case for the North American and Patagonian
deserts which are in the rain shadows respectively of the Sierra Nevada and the Andes.
As will be discussed later, topography is a key factor determining arid conditions at finer resolution and the diversity of agrometeorological conditions within the arid zones.
The arid zones are unevenly distributed across coun-tries. Given the physical principles that govern the oc-currence of aridity, countries in subtropical belts are more prone to arid conditions. However, there is no simple way to classify countries into either humid or arid groups.
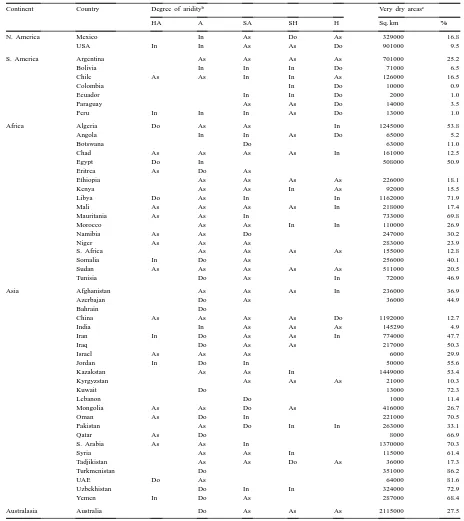
A summary inventory of countries with a substan-tial share of arid zones is shown in Table 2. This table, derived from the UNESCO World Map of Arid re-gions (UNESCO, 1979), evidences the extent of arid-ity across the globe in terms of affected countries and land surface.
This table also indicates that it is difficult, if not impossible, to put entire countries within a single classification unit. In most cases, arid countries are composed of areas with different degrees of arid-ity. This has important consequences for economic development. In countries where a complementary mix of different climatic zones exists, a higher di-versity of agricultural production systems is possible, and compensation for the physical constraints re-lated to aridity, as compared to countries where arid zones dominate. In the latter case the contribution of agriculture to the national economy is by necessity limited.
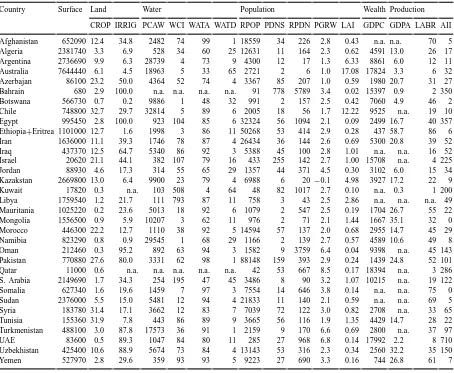
3. Development indicators for arid zone countries
Table 3 summarizes some relevant indicators re-lated to land and water resources, agricultural produc-tion, population and wealth for the countries that have at least 20% of their land surface classified as ‘very dry areas’ according to the FAO soil criteria ‘occur-rence of Xerosols and Yermosols’ (FAO, 1995). These countries are henceforth labeled ‘arid zone countries’ (AZCs).
3.1. Land resources
Table 2
Countries with arid zonesa
Continent Country Degree of aridityb Very dry areasc
HA A SA SH H Sq. km %
N. America Mexico In As Do As 329000 16.8
USA In In As As Do 901000 9.5
S. America Argentina As As As As 701000 25.2
Bolivia In In In Do 71000 6.5
Chile As As In In As 126000 16.5
Colombia In Do 10000 0.9
Ecuador In In Do 2000 1.0
Paraguay As As Do 14000 3.5
Peru In In In As Do 13000 1.0
Africa Algeria Do As As In 1245000 53.8
Angola In In As Do 65000 5.2
Botswana Do 63000 11.0
Chad As As As As In 161000 12.5
Egypt Do In 508000 50.9
Eritrea As Do As
Ethiopia As As As As 226000 18.1
Kenya As As In As 92000 15.5
Libya Do As In In 1162000 71.9
Mali As As As As In 218000 17.4
Mauritania As As In 733000 69.8
Morocco As As In In 110000 26.9
Namibia As As Do 247000 30.2
Niger As As As 283000 23.9
S. Africa As As As As 155000 12.8
Somalia In Do As 256000 40.1
Sudan As As As As As 511000 20.5
Tunisia Do As In 72000 46.9
Asia Afghanistan As As As In 236000 36.9
Azerbajan Do As 36000 44.9
Bahrain Do
China As As As As Do 1192000 12.7
India In As As As 145290 4.9
Iran In Do As As In 774000 47.7
Iraq Do As As 217000 50.3
Israel As As As 6000 29.9
Jordan In Do In 50000 55.6
Kazakstan As As In 1449000 53.4
Kyrgyzstan As As As 21000 10.3
Kuwait Do 13000 72.3
Lebanon Do 1000 11.4
Mongolia As As Do As 416000 26.7
Oman As Do In 221000 70.5
Pakistan As Do In In 263000 33.1
Qatar As Do 8000 66.9
S. Arabia As As In 1370000 70.3
Syria As As In 115000 61.4
Tadjikistan As As Do As 36000 17.3
Turkmenistan Do 351000 86.2
UAE Do As 64000 81.6
Uzbekhistan Do In In 324000 72.9
Yemen In Do As 287000 68.4
Australasia Australia Do As As As 2115000 27.5
aThe symbols used refer to relative importance within the country: In: inclusion (<5% of the country); As: associated (at least 5–10% of country);
Do: dominant (>50% of country).
bDegree of aridity: HA: hyper-arid; A: arid; SA: semi-arid; SH: semi-humid; H: humid.
cThe category ‘very dry areas’ is derived from the FAO Soil Map of the World as areas where Xerosols and Yermosols occur. This is a valid approach
Table 3
Land and water resource, population, wealth and agricultural productivity indicators of countries with arid zonesa
Country Surface Land Water Population Wealth Production
CROP IRRIG PCAW WCI WATA WATD RPOP PDNS RPDN PGRW LAI GDPC GDPA LABR AII
Afghanistan 652090 12.4 34.8 2482 74 99 1 18559 34 226 2.8 0.43 n.a. n.a. 70 5 Algeria 2381740 3.3 6.9 528 34 60 25 12631 11 164 2.3 0.62 4591 13.0 26 17 Argentina 2736690 9.9 6.3 28739 4 73 9 4300 12 17 1.3 6.33 8861 6.0 12 11 Australia 7644440 6.1 4.5 18963 5 33 65 2721 2 6 1.0 17.08 17824 3.3 6 32 Azerbajan 86100 23.2 50.0 4364 52 74 4 3367 85 207 1.0 0.59 1980 20.7 31 27 Bahrain 680 2.9 100.0 n.a. n.a. n.a. n.a. 91 778 5789 3.4 0.02 15397 0.9 2 350
Botswana 566730 0.7 0.2 9886 1 48 32 991 2 157 2.5 0.42 7060 4.9 46 2
Chile 748800 32.7 29.7 32814 5 89 6 2005 18 56 1.7 12.22 9525 n.a. 19 10 Egypt 995450 2.8 100.0 923 104 85 6 32324 56 1094 2.1 0.09 2499 16.7 40 357 Ethiopia+Eritrea 1101000 12.7 1.6 1998 3 86 11 50268 53 414 2.9 0.28 437 58.7 86 6 Iran 1636000 11.1 39.3 1746 78 87 4 26434 36 144 2.6 0.69 5300 20.8 39 52
Iraq 437370 12.5 64.7 5340 86 92 3 5388 45 100 2.8 1.01 n.a. n.a. 16 52
Israel 20620 21.1 44.1 382 107 79 16 433 255 142 2.7 1.00 15708 n.a. 4 225
Jordan 88930 4.6 17.3 314 55 65 29 1357 44 371 4.5 0.30 3102 6.0 15 34
Kazakstan 2669800 13.0 6.4 9900 23 79 4 6988 6 20 −0.1 4.98 3927 17.2 22 9
Kuwait 17820 0.3 n.a. 103 508 4 64 48 82 1017 2.7 0.10 n.a. 0.3 1 200
Libya 1759540 1.2 21.7 111 793 87 11 758 3 43 2.5 2.86 n.a. n.a. n.a. 49 Mauritania 1025220 0.2 23.6 5013 18 92 6 1079 2 547 2.5 0.19 1704 26.7 55 22
Mongolia 1556500 0.9 5.9 10207 3 62 11 976 2 71 2.1 1.44 1667 35.1 32 0
Morocco 446300 22.2 12.7 1110 38 92 5 14594 57 137 2.0 0.68 2955 14.7 45 29
Namibia 823290 0.8 0.9 29545 1 68 29 1166 2 139 2.7 0.57 4589 10.6 49 8
Oman 212460 0.3 95.2 892 63 94 3 1582 9 3759 6.4 0.04 9398 n.a. 45 143
Pakistan 770880 27.6 80.0 3331 62 98 1 88148 159 393 2.9 0.24 1439 24.8 52 101 Qatar 11000 0.6 n.a. n.a. n.a. n.a. n.a. 42 53 667 8.5 0.17 18394 n.a. 3 286 S. Arabia 2149690 1.7 34.3 254 195 47 45 3486 8 90 3.2 1.07 10215 n.a. 19 122
Somalia 627340 1.6 19.6 1459 7 97 3 7554 14 646 3.8 0.14 n.a. n.a. 75 0
Sudan 2376000 5.5 15.0 5481 12 94 4 21833 11 140 2.1 0.59 n.a. n.a. 69 5 Syria 183780 31.4 17.1 3662 12 83 7 7039 72 122 3.0 0.82 2708 n.a. 33 65 Tunisia 155360 31.9 7.8 443 86 89 9 3665 56 116 1.9 1.35 4429 14.7 28 22 Turkmenistan 488100 3.0 87.8 17573 36 91 1 2159 9 170 6.6 0.69 2800 n.a. 37 97
UAE 83600 0.5 89.3 1047 84 80 11 285 27 968 6.8 0.14 17992 2.2 8 710
Uzbekhistan 425400 10.6 88.9 5674 73 84 4 13143 53 316 2.3 0.34 2560 32.2 35 150
Yemen 527970 2.8 29.6 359 93 93 5 9223 27 690 3.3 0.16 744 26.8 61 7
prevalent, this is explained by a high reliance on irri-gation (e.g. Azerbajjan, Israel, Pakistan) or the impor-tance within the country of more humid agroclimatic zones (e.g. Chile, Morocco, Syria, Tunisia).
The weight of irrigation varies tremendously be-tween the AZCs, from a fraction of the cropland area to 100%. This range reflects the state or feasibility of irrigation development within each country, rather than the need.
3.2. Water resources
In terms of available water resources there are again huge differences between the AZCs. The per-caput available water varies by a factor 300 between the most and least endowed countries, which results in a highly unbalanced distribution of water resources for eco-nomic and social development. These disparities be-tween AZCs are due to differences in population den-sity or compensation within countries that have wetter agroclimatic zones or both. Some countries consume only a small percentage of their water resources (e.g. Botswana, Chile, Ethiopia, Mongolia, Namibia), oth-ers consume all (e.g. Egypt, Israel), whereas the most deficient countries import water from non-renewable sources (e.g. Libya) or manufacture it themselves through desalination (e.g. Saudi Arabia, Kuwait).
In the vast majority of arid zone countries agricul-ture is the main consumer of water. Water is gener-ally not in short supply for domestic use, except in a few countries with an adverse combination of low per-caput availability and high demand for domestic use (e.g. Jordan, Kuwait, Saudi Arabia).
This water picture, which on the whole is not exactly rosy at present, is likely to change dramatically within one generation. The majority of countries currently
in the AZC group1 will by the year 2025 be
char-acterized by absolute water scarcity. These countries will not have sufficient renewable water resources to meet reasonable per caput water needs for their rapidly expanding populations. Given the dominant share of agricultural water use, these countries will almost cer-tainly have to reduce the amount of water used in
ir-1Libya, Saudi Arabia, UAE, Kuwait, Oman, Jordan, Yemen, Is-rael, Egypt, Tunisia, Iraq, Iran, Syria, Pakistan, and a few outsiders like South Africa and Singapore (Seckler et al., 1998).
rigated agriculture and transfer it to the other sectors, importing more food instead (Seckler et al., 1998).
3.3. Population
In terms of population characteristics the AZCs are a very heterogeneous group, with net population growth rates ranging between 1 and 3% for most countries. The vast majority have high growth rates (>2%) resulting in rapid population increase. Some countries have very high growth rates (e.g. Oman, Qatar, UAE), which are due mainly to a large net immigration of guest workers, rather than an increase in the native population.
The total rural population in the AZCs is nearly 350 million people. Noin and Clarke (1998) reckon that in the 20 most arid countries of the world total population has multiplied more than six times since the beginning of the century. They also estimate that the contribution of these countries to the world population is expected to increase from a base of 4.3% in 1900 to 11.5% in 2025.
The overall population density, which does not dis-tinguish between rural and urban populations, is, with the exception of a few countries (Bahrain, Israel and Pakistan), low to moderate. However, when the ru-ral population density is considered, one finds that the population pressure associated with agriculturally productive areas is much higher, in the majority of countries at least five times more than the overall pop-ulation density. The absolute values of rural popula-tion density are in some countries very high (>300
persons/km2). This can be explained by high
country-side populations (e.g. Egypt, Ethiopia, Jordan, Pak-istan), low cropland area and urbanization of the coun-tryside (e.g. Kuwait, Bahrain, Oman, Qatar, UAE) or concentration of population in pockets of cropland (e.g. Mauritania, Yemen).
3.4. Wealth
In terms of wealth, as expressed by per-caput GDP the AZCs include some of the poorest (Eritrea, Ethiopia) as well as some of the richest countries in the world (Australia, Qatar, UAE). However, most of the
AZCs would be classified as low-income countries.2
4. Agroecology and environmental vulnerability of the arid zones
The energy available for evaporation is the control-ling factor in the regional hydrology of the arid zones. All arid zones are characterized by a vast surplus of water demand over rainfall. Regional gradients of po-tential evapotranspiration therefore largely determine the macro-scale aridity. The synchronicity between evaporation and rainfall also determines the effec-tiveness of the latter. Winter rainfall is more effective in building up a reliable moisture supply for plants than summer rainfall. For this reason the same crop which can grow well under a winter rainfall regime of 300 mm may easily require 500–600 mm under summer rainfall.
Within the general arid setting the ‘soilscape’ (landform-soil complex) is an important determinant of land use potential by its control over runoff and infiltration. Topography plays a major role in modify-ing the moisture supply, not only by trappmodify-ing rainfall or attracting occult precipitation, but also by lowering the rate of evaporation at higher altitude.
The arid zones exhibit a tremendous diversity in landscapes, soil, geological substrata, surface water and groundwater resources (Gerrard, 1992). Different landforms, lithologies, the general sparsity of vege-tation, and regional tectonics combined with the dif-ferential resistance of these parent rocks to stress and shear, create wide differences in the properties of land to generate runoff and to accept and store groundwater. The diversity of the arid zones thus creates a surprisingly wide range of agroecological ‘niches’, which can be either natural or artificial (e.g. irri-gated areas). Agroecological niches are formed by climate-landform–soil interactions that create edaphic conditions that deviate substantially from those of the surrounding areas. ‘Patchiness’ of edaphic conditions is therefore a key characteristic of the arid zones.
This concept of agroecological niche is fundamen-tal to understand why at meso- and micro-scale, and sometimes at macro-scale, the agricultural productiv-ity of the arid zones can be much higher than would correspond with their macro-scale agroclimatic po-tential and biomass productivity. Large-scale studies of eco-region productivity usually do not consider the numerous sites where natural conditions are more favorable or where appropriate land and water
man-agement can substantially raise the production poten-tial. In other eco-regions inclusions of areas with a typical edaphology can be ignored, but not in the arid zones because these pockets constitute the core areas of higher biomass productivity and biodiversity.
Examples of extensive natural agroecological niches with more humid conditions include the large river floodplains of North and West Africa (Nile, Niger) and the semi-arid mountain islands of the Sahara and the Arabian Peninsula (Hoggar, Tibesti, Yemen and Asir highlands). At meso- and micro-scale oases are typical examples of highly productive ar-eas owing to a reliable but highly site-specific water supply from springs.
‘Occult precipitation’ from fog, mist, low clouds or dew has often been mentioned in the literature as a modifying factor of the water budget of the arid zones. An excerpt from this literature can be found in Le Houérou et al. (1993). As a source of moisture, occult precipitation can constitute a significant, or even the dominant, fraction of precipitation. How-ever, given the fact that the reported contributions constitute less than 2 mm per day, in areas where the potential evapotranspiration may easily exceed 5–6 mm per day, the claims of significant impact on the regional hydrology are probably exaggerated. Nevertheless, it is clear that these sources of hidden precipitation are of great importance in creating, at micro-scale, improved conditions that support more productive and diverse plant life.
salin-ization. Primary salinity often occurs in natural soil types due to their lithological inheritance (e.g. ma-rine sands), or a topographical position that favors seepage of laterally moving groundwater, subsequent evaporation and salt deposition. In many arid regions lower footslopes are favored landscape positions for saline seepages (Roberts, 1992).
Wind erosion is a natural process in the arid regions. The detachment, removal, and subsequent deposition elsewhere, of soil particles is a function of wind force, lack of vegetation cover, shelter-exposure effect of dif-ferent landscape positions and susceptibility of soils to detachment. The latter is inversely related to the silt and clay content (Lorimer, 1985). For this reason dust storms and sand drift have always been characteristic of the sandier parts of the arid zones.
Even water erosion, as expressed by rills and gul-lies, can be surprisingly severe in the arid zones. The limited vegetation cover and associated low biolog-ical activity, can not protect the soils from rainfall impact, which tend to seal up and produce relatively large runoff volumes in relation to the absolute rainfall amounts.
These natural processes have been dramatically ac-celerated by human intervention. The most widespread expression of land degradation is in the degradation of vegetation cover. Major parts of the arid range-land vegetation, particularly in North Africa and the Near East, have been significantly degraded in quan-tity and quality. Vegetation destruction takes place by overgrazing and fuelwood collection, both activities being driven by the needs of growing populations. A less visible form of vegetation degradation is in the change of the plant species composition of rangeland ecosystems. The balance between perennials and an-nuals is often disturbed, which could be detrimental for the ability of arid ranges to hold soil and water, or the ecosystem becomes dominated by a few unpalat-able species.
Continuous cultivation of steppe areas rapidly ex-hausts the limited stock of organic matter, which glues the topsoil. Under conditions of low moisture, low organic matter and rapid oxidation of humus, soil structure deteriorates more rapidly, particularly under continuous annual cropping using disc and moldboard ploughs. Under these conditions the topsoil becomes denser, less aerated and less pervious to rain and plant roots. At the same time, splash erosion causes crust
formation and the capping of the topsoil, sealing the surface and resulting in higher runoff and erosion (Roberts, 1992).
The availability of cheap pumps and lack of regu-lation of groundwater abstraction, have allowed many farmers in the arid zones to expand irrigation into the arid zones. In many cases this has led to secondary salinization, by importing the salinity associated with the groundwater or, through over-irrigation, by raising the level of shallow water tables until they are near to the surface.
5. Agricultural production systems of the arid zones and their development pathways
A wide range of cropping and livestock or mixed systems exploits the ecological diversity of the arid zones. In increasing order of land use intensity the following are major production systems in these areas:
• pastoral livestock systems;
• transhumant livestock systems;
• rainfed cropping systems;
• partially irrigated cropping systems;
• fully irrigated cropping systems.
5.1. Livestock systems
produc-tion. Transhumant migrations typically have relatively fixed patterns of seasonal flock movements between established grazing grounds. Usually natural grazing is insufficient in the arid zones, even allowing for crop residues and stubble from neighboring or remote agri-cultural land, and increasingly herd owners have to resort to feed supplements. In all arid zones, partic-ularly those of Africa and the Middle East, the trend towards an increased contribution of feed grains and other concentrates to the livestock diet is bound to increase (Nordblom and Shomo, 1995).
These modern versions of traditional pastoralism are gaining increasing importance in local and regional economies but they have their own problems. The main one is that they have no control over the quality of the grazing areas. While flock ownership is individual but the range is communal, there is no incentive to avoid overgrazing. Permanent overgrazing, with a gradual displacement of perennial grasses by annuals and un-palatable bushes, is an increasingly common problem in the arid zones. What is worse is that any infras-tructural provisions, such as roads and watering points simply exacerbate the negative environmental effects by encouraging further resource use beyond the carry-ing capacity of the land. No major improvements can be expected without land tenure reforms that change the combination of private flock ownership and com-munal land (Ruthenberg, 1980).
5.2. Cropping systems
At the higher rainfall margins of the arid zones, rainfed production systems occur especially in win-ter rainfall areas. These systems are mainly based on wheat or barley rotations with food or fodder legumes, or tree crops, mainly fruits and olives. Given the low absolute amounts and considerable variations in rain-fall from year to year, such systems critically depend on soils with favorable moisture storing properties. This can be a high moisture storage capacity, as is the case with the red, well drained, clayey
Mediter-ranean soils,3 or in landscape positions that benefit
from moisture additions by runoff from higher areas. The viability of such systems, which can be highly productive especially for cereals and grain legumes,
3Available waterholding capacities of 150–180 mm/m are com-mon (e.g. Ryan et al., 1997).
depends on the high efficiency of water storage which is caused by the combination of winter rainfall, low winter evapotranspiration, high available waterholding capacity and adequate rooting depth.
The main problems of the rainfed production sys-tems are land scarcity, limited growing period and yield fluctuations due to rainfall variability. From the viewpoint of soil and climatic resources these systems occur in the most favored parts of the arid zones and it is therefore not surprising that they are under perma-nent cultivation. Land scarcity is clear from the lack of natural vegetation and fragmentation of fields, which is due to the tenure system and can be readily observed from satellite imagery (e.g. GORS, 1996).
The growing period, part of which includes the winter with a dormancy period, is too dependent on soil moisture to allow either long-maturing crops with higher yield potential or double cropping. Yield vari-ations can be very substantial as a result of moisture stress at the end of the growing season.
The availability of cheap wells, irrigation water and piping systems has made it possible for many farmers of the arid zones to stabilize production under rainfed conditions, by applying irrigation water at the time that it is critically needed. However, under conditions of unlimited access, supplemental irrigation systems are inherently transitional and tend to evolve into fully irrigated systems, with a higher cropping intensity and new crops that would not be possible under rainfed and supplemental conditions.
Water harvesting, in its various expressions, is likely to expand from the semi-arid to the arid zones. Wa-ter harvesting is the collection of runoff for produc-tive purposes from a catchment area to a collection area, usually a cultivated area (Critchley and Siegert, 1991). Floodwater harvesting, also called spate irriga-tion, can be of particular importance in arid plains dis-sected by wadis that originate in rainy uplands, such as the Tiama coastal plain in Yemen. These agricul-tural systems are characterized by diversion of flood-water and spreading through canal systems onto suit-able soils with favorsuit-able moisture storing properties. The main problems of these systems are inadequate water control and the unreliability of moisture supply, which favor cropping patterns that have to accommo-date flood and drought tolerance.
5.3. Forestry
Forestry as a system for the economical produc-tion of wood and derivatives is rare in the arid zones, owing to the low growth rates and productivity under non-irrigated conditions, and other associated adverse ecological conditions (shallow soils, salinity, temper-ature extremes).
Natural trees and shrubs are exploited, such as Aca-cia senegal for gum arabic or trees of the Boswellia genus for frankincense. Actual afforestation, while limited, is mainly for a conservation or protection pur-pose, in particular to protect agricultural land against sand dune invasion and to provide shelter against strong winds.
5.4. Trends
The arid zones suffer from a public perception that they are areas of limited heterogeneity (‘all arid zones are deserts, and preferably sandy’), that they have lim-ited agricultural potential and low population densi-ties. This view is likely to change dramatically in the near future owing to the realization that:
• these areas are far from monolithic in their
agroe-cological characteristics;
• they have agroecological niches with high
agricul-tural potential;
• they will become more important as sources of
genetic diversity and abiotic stress resistance;
• population densities are increasing rapidly,
particu-larly in urban agglomerations;
• the environmental problems, particularly the decline
in quantity and quality of groundwater resources, may reach crisis dimensions.
Together the above factors are bound to transform the existing agricultural production systems of the arid zones within a generation.
A first impact will be on the irrigation systems. Faced with the need to divert more of their water re-sources to domestic and industrial use, governments will have no alternative but to reduce the share of agri-cultural water consumption. They can do this by in-creasing water charges, cutting of price subsidies on irrigated crops, water and pump quota, and other, more restrictive, measures.
These expected water policy changes would pro-vide powerful incentives to boost water use efficiency, water conservation and reutilization.
First of all, irrigation systems in the arid zones are likely to reduce distribution and application losses. In arid climates the efficiency of irrigation can be easily improved to field application efficiency rates of 70% by drip or sprinkler irrigation. Seckler et al. (1998) ex-pect that most AZCs will achieve these efficiency rates by the year 2025. There will also be a trend to change cropping patterns to more water-conserving, drought-or salinity-tolerant rotations. These changes in crop-ping pattern will be driven by changes in amount and quality of available irrigation water.
In arid zone countries that have the financial re-sources for wastewater treatment, treated sewage effluent will become a very important source of ir-rigation water. In others, more use will be made of irrigation return flow runoff, agricultural subsurface drainage water, saline springs and streams, perched water tables and saline groundwater aquifers.
In the cropping patterns emphasis will shift from the more water-demanding, relatively low-value staple crops such as cereals and cotton to vegetables, fruits and other niche crops that will serve the growing needs of nearby urban agglomerations.
It is also likely that in the longer run, when water will be valued at its real opportunity cost, rain-fed cropping systems, stabilized through supplemental irrigation, will regain importance.
As a result of overgrazing, livestock systems in the arid zones have an increasing need for imported feed to supplement a decreasing range feeding capability (Nordblom and Shomo, 1995). The potential of using indigeneous, heat-, drought- and salinity-tolerant grass and shrub species, grown as irrigated fodder crops for high yield, has been largely unexploited. There are ex-citing possibilities to select and breed, from the large pool of arid zone genetic resources the fodder crops of the future, with the right mix of high yield, high water use efficiency and abiotic stress tolerance.
Achieving complementarity between irrigated and rainfed crop and livestock production systems is a challenging but necessary developing pathway for en-suring sustainability of agricultural productivity and environmental sustainability of the arid zones.
6. Current and future contributions of agrometeorology to agricultural production systems in the arid zones
Agrometeorology has contributed tremendously to the management of irrigation schemes. The extensive research on methods for calculating potential evapo-transpiration has become the basis for managing irrigation scheduling at scheme and field level, both under conditions of unlimited and restricted water supply. The excellent reviews of the literature and resulting guidelines for estimating crop water require-ments, contained in various FAO publications (e.g. Doorenbos and Pruitt, 1977; Doorenbos and Kassam, 1979) have been highly influential in the design and operation of irrigation schemes. They have also cre-ated awareness of the indispensability of site-specific agrometeorological data for their management.
The FAO-coordinated work on revising the aerody-namic term of the original Penman formula (Dooren-bos and Pruitt, 1977; Frère and Popov, 1979) has been of particular value for the arid zones, because the strong advection effect in these areas could not be properly accounted for by the standard Penman method (Penman, 1948).
Crop coefficients, relating potential evapotran-spiration and crop water requirements, have been determined for a wide range of crops and cultivars, in different climatic conditions. As a result a wide body of information exists on site-specific crop water
requirements. Local determination of crop coefficients through lysimeter studies is an active area of ongoing adaptive research.
The renewed emphasis on the energy balance for calculating PET (Smith, 1990) using the Penman– Monteith formula, offers the potential of replacing the two-step procedure of estimating crop water require-ments (via the potential evapotranspiration and the crop coefficients) by a one-step procedure. As such it would be more suitable for use with crop simulation methods and allow to avoid lengthy experiments to calibrate crop coefficients to local conditions.
With the exception of irrigation management, the contribution of agrometeorology to solving the prob-lems of the arid zones’ specific production systems has been suboptimal. In a rapid survey of the journal
Agricultural and Forest Meteorology it was found that
over the last 15 years not a single article was dedicated to research themes specific to the arid zones.
It is therefore not unfair to state that the agrome-teorological needs of these areas have up to now not been fully appreciated in the past. The perceptions of low heterogeneity and low agricultural potential, as well as the logistical problems of providing mainte-nance and obtaining data from remote meteorological stations, are largely to blame for this situation.
Agrometeorology has a significant contribution to make in the transition of the agricultural production systems of the arid zones towards more sustainability. By matching water application to crop water require-ment, agrometeorological information is at the heart of cropping systems with high water use efficiency. Agrometeorological data are also necessary to charac-terize the different agroecological niches in terms of abiotic stresses, particularly extremes of temperature, wind and drought. Relating these data on a spatial basis to plant species distribution will help to iden-tify plants that have high tolerance to the particular stresses. Their genetic resources can then be used to breed the food and fodder crops for the arid zones, that have the right balance between good yield, water use efficiency and stress tolerance.
6.1. Agroecological characterization
maps, groundwater surveys exist, therefore the need for new resource inventories is probably limited. It is clear that integrated land and water resource infor-mation systems, based on GIS-technology will play a major role in linking multidisciplinary, geographically referenced databases at different resolution.
Digital elevation models (DEMs) will play an increasingly important role in this integration of the-matic layers in GIS-based land and water resource information systems. DEMs contain topographic in-formation on a grid basis, and are therefore, at least in comparison with climate data networks, very detailed. For example, a global DEM from the US Geological Survey (GTOPO30), available as freeware, provides information on altitude, slope and aspect for every land point with a 1 km resolution. Other DEMs can be generated from digitized topographical maps.
The real need is to integrate this information in the form of agroecological frameworks for development. Specific methodologies, models and decision-support systems will need to be developed for these integration exercises. It will not be enough to overlay, for instance, a rainfall map with a soils map and a DEM to come up with a realistic land use plan.
There is a particular need for a better under-standing of the agroclimatic variations within arid zones. Given the diversity in topographic conditions, agroclimatic characterization will be required at dif-ferent scales. A useful approach to macro-scale agro-climatic zoning can be based on the FAO concept of Length-of-Growing-Period (FAO, 1978). By incorpo-rating temperature thresholds for dormancy and killing frost, and snowfall as a separate sink in the waterbal-ance, a more refined assessment of growing period could be made that would be of particular relevance to areas where the growing period is limited by either moisture or temperature or both (De Pauw et al., 1996). In view of the different temperature, radiation, mois-ture, humidity and wind regimes in agroecological niches, the latter will need to be properly character-ized.
6.2. Spatialization of climatic data
Given the sparse agrometeorological networks in the arid zones, an area in which agrometeorology can make a much valued and specific contribution is in spatialization of climatic parameters.
Several statistical techniques are already available that make use of DEMs for the spatialization of cli-matic parameters, such as simple interpolation models, univariate geostatistical and splining methods, mul-tivariate geostatistical and co-splining methods, and composite methods.
Climatic variables are strongly influenced by site altitude and other features of the surrounding ter-rain. These influences range from more or less purely statistical, to deterministic due to some underlying physical cause-and-effect relationship.
An example of a statistical relationship is the de-crease of precipitation with increasing distance from a coast or the increase of rainfall on the windward side of an obstacle (orographic rainfall) with a correspond-ing decrease on the leeward side (foehn). An example of a deterministic relationship is the variation of solar radiation intensity with slope and aspect.
In view of the strong linkages between climatic vari-ables and topography, the most promising techniques for spatialization in climatology are multivariate ap-proaches, since the latter permit the use of terrain variables as auxiliary variables in the interpolation process. In contrast to the climatic target variables themselves, which are only known for a limited num-ber of sample points, terrain variables have the advan-tage to be known for all locations in between, which increases the precision of the interpolated climatic variables significantly. Cokriging and co-splining are methods that include the auxiliary information as ran-dom quantity, assuming no deterministic relationship between auxiliary variables and target variable. Both methods nearly always lead to robust results. Both are widely used in agroclimatology; various examples are provided by Bogaert et al. (1995), Hutchinson (1995), and Hutchinson and Corbett (1995).
A similar method, but with a different, circular geom-etry for terrain representation has been employed by Göbel et al. (1996) for the mapping of precipitation in Morocco.
The combination of DEMs and advanced spatial in-terpolation techniques thus allows to generate ‘climate parameter surfaces’. These are raster files that can be manipulated in a GIS with other variables, for instance soil moisture storage capacity, crop calendars and oth-ers, to generate spatially or temporally linked derived variables, such as soil moisture, runoff, crop water re-quirements, potential evapotranspiration.
6.3. Remote sensing
Remote sensing techniques can assist with the inter-polation and mapping of climatic variables. The scope ranges from the use of satellite images to guide the manual drawing of isohyets (van der Laan, 1986) to the direct mapping of climatic variables from multi-temporal coverages from satellites or ground radar, in which observations from meteorological stations serve mainly for calibration purposes. A few examples are the mapping of precipitation (Barrett, 1986; Dugdale et al., 1991), evapotranspiration and soil moisture near the surface (Bastiaanssen, 1995), or wind speed and direction (Smith and Kelly, 1985).
The major role for remote sensing will be to mon-itor changes in the edaphic factors. By its synoptic view and rapid refresh capability remote sensing of-fers a unique ability to integrate the effects of changing weather, vegetation, soil and land use. These changes can be monitored over different spatial and time scales. Especially the use of AVHRR imagery, with low spa-tial but high temporal resolution, in combination with higher-resolution imagery such as Landsat or SPOT, in representative sample areas, offers cost-effective prospects for monitoring land degradation and climate change impact.
6.4. Improved networks and user access to data
Whereas data spatialization and remote sensing are valuable tools, they can not compensate for the real climatic data gap in the arid zones. Meteorological services should make an effort to service these areas using agroecological frameworks as a basis for citing
weather stations in representative locations. The re-moteness of such areas can nowadays be overcome by automatic stations with data loggers, and data trans-mission by telephone or satellite.
In a larger development context meteorological services will need to rethink their role as public in-stitutions that serve different user communities with different levels of purchasing power. The agricultural user community in most developing countries has the highest data requirements but the lowest financial resources.
In order to manage the irrigation projects of the fu-ture effectively, site-specific meteorological informa-tion is indispensable. The anticipated use of marginal water combined with the need for water conserva-tion will require a level of scheme coordinaconserva-tion, that only systems with a large degree of automation in the water scheduling and application will be able to master. Such sophisticated schemes are only feasible if steered by expert systems with meteorological data as driving variables.
The economic pressures on meteorological services to become ‘self-supporting’ by charging for their data and services should not put a brake on the develop-ment of sectors that will increasingly rely on knowl-edge systems in which meteorological data are a key component.
Meteorological services will need to go in partner-ship with the private sector, assist them with data col-lection and find affordable arrangements in an effort to pool and share data. It is not the ‘client-server’ model that has made meteorology a showcase of international cooperation, but the spirit of unrestricted information access and data sharing.
7. Conclusions
to exchange data obtained from privately-operated weather stations with technical advisory services to ensure the quality of the data collection.
Given the relative sparsity of meteorological sta-tions in the arid zones, there is a continuing need for research on ‘data substitution’, in particular on data spatialization methods, using various combinations of state-of-the-art statistical techniques and satellite information.
References
Ahrens, C.D., 1993. Essentials of Meteorology. West Publishing Co., Minneapolis, 37 pp.
Barrett, E.C., 1986. Estimation of precipitation from AVHRR and Meteosat data over Africa. In: Proceedings of the. Twentieth International Symposium on Remote Sensing of Environment, Nairobi, Kenya, 4–10 December 1986, Vol. I, 235–254 Bastiaanssen, W.G.M., 1995. Regionalization of surface flux
densities and moisture indicators in composite terrain: a remote sensing approach under clear skies in Mediterranean climates. Ph.D. thesis, Landbouwuniversiteit Wageningen, Netherlands. Benichou, P., Le Breton, O., 1987. Prise en compte
de la topographie pour la cartographie des champs pluviométriques statistiques: la méthode Aurelhy. In: INRA (Ed.), Agrométéorologie des régions de moyenne montagne. Proc. Toulouse, 16–17 April 1986, INRA, Paris, France, pp. 51–69.
Bogaert, P., Mahau, P., Beckers, F., 1995. The spatial interpolation of agro-climatic data. Cokriging software and source data. User’s manual, FAO Agrometeorology Series 12, FAO, Rome, Italy, 70 pp.
Critchley, W., Siegert, K., 1991. Water harvesting. FAO Document AGL/MISC/17/91, FAO, Rome, Italy, 133 pp.
De Pauw, E., Nachtergaele, F.O., Antoine, J., 1996. A provisional world climatic resource inventory based on the length-of-growing-period concept. In: Batjes, N.H., Kauffman, J.H., Spaargaren, O.C. (Eds.), National Soil Reference Collections and Databases (NASREC, Vol. 3), pp. 30–43 Doorenbos, J., Kassam, A.H., 1979. Yield response to water. FAO
Irrigation and Drainage Paper 33, FAO, Rome.
Doorenbos, J., Pruitt, W.O., 1977. Guidelines for predicting crop water requirements. FAO Irrigation and Drainage Paper 24, FAO, Rome.
Dugdale, G., Hardy, S., Milford, J.R., 1991. Daily catchment rainfall estimated from Meteosat. In: Proceedings of the International Workshop on Precipitation Measurement, St Moritz, Switzerland, 4–7 December 1989. Hydrol. Process. 5, 261–270.
FAO, 1978. Report of the Agroecological Zones Project Vol. 1. Methodology and Results for Africa. FAO, Rome.
FAO, 1995. Digital Soil Map of the World and derived soil properties. CD-ROM, FAO, Rome.
FAO, 1997. Irrigation in the Near East region in figures. Water report 9, FAO, Rome, 281 pp.
Frère, M., Popov, G.F., 1979. Agrometeorological crop monitoring and forecasting. FAO Plant Production and Protection Paper 17, FAO, Rome.
Gerrard, J., 1992. Soil geomorphology. An Integration of Pedology and Geomorphology. Chapman and Hall, London, 269 pp. Göbel, W., El Ouali, A., Singh, M., 1996. Spatial interpolation of
precipitation data: an example from Morocco. Paper presented at the Workshop on Spatialization organized by E.U. COST and Météo France in Toulouse, France, 24–25 September 1996.
GORS, 1996. Space image atlas Syria. Government Organization for Remote Sensing, Syria.
Hutchinson, M.F., 1995. Interpolating mean rainfall using thin plate smoothing splines. Int. J. Geogr. Information Syst. 9, 385– 403.
Hutchinson, M.F., Corbett, J.D., 1995. Spatial interpolation of climatic data using thin plate smoothing splines. FAO. Co-ordination and Harmonisation of Databases and Software for Agroclimatic Applications, FAO Agrometeorology Series Number 13, Rome, Italy, FAO, pp. 211–224.
ICARDA, 1996. ICARDA’s Strategy. ICARDA, Aleppo, Syria. Le Houérou, H.N., 1993. Changements climatiques et désertisation.
Sécheresse 4, 95–111.
Le Houérou, H.N., Popov, G., See, L., 1993. Agro-bioclimatic classification of Africa. Agrometeorology Series Working Paper No. 6, FAO, Rome, 227 pp.
Lorimer, M.S., 1985. Estimating the susceptibility of soil to wind erosion in Victoria. J. Aust. Inst. Agric. Sci. 51 (2), 126. Noin, D., Clarke, J.I., 1998. Population and environment in arid
regions of the world In: Clarke, J., Noin, D. (Eds.), Population and Environment in arid regions. Man and the Biosphere Series, Vol. 119, pp. 1–18
Nordblom, T., Shomo, F., 1995. Food and feed prospects to 2020 in the West Asia/North Africa Region. ICARDA, Social Science Papers 2, 56 pp.
Penman, H.L., 1948. Natural evaporation from open water, bare soil and grass. Proc. R. Soc. A 193, 120–145.
Roberts, B., 1992. Land Care Manual. University of New South Wales Press, ISBN 086840053X.
Ruthenberg, H., 1980. Farming Systems of the Tropics. Clarendon Press, Oxford, 424 pp.
Ryan, J., Masri, S., Garabet, S., Diekmann, J., Habib, H., 1997. Soils of ICARDA’s agricultural experiment stations and sites. ICARDA, Aleppo.
Seckler, D., Molden, D., Barker, R., 1998. Water scarcity in the twenty-first century. IWMI Water Brief, IWMI, Colombo. Smith, M., 1990. Expert consultation on revision of FAO
methodologies for crop water requirements. Land and Water Development Division, FAO, Rome.
Smith, W.L., Kelly, G.A.M., 1985. Use of satellite imagery and soundings in mesoscale analysis and forecasting. ESE J. 9, 115–123.
UNESCO, 1953. World distribution of arid and semi-arid homoclimates. Reviews of Research on Arid Zone Hydrology. UNESCO, 1977. Répartition mondiale des régions arides. Nature
UNESCO, 1979. Map of the world distribution of arid regions. Map at scale 1:25,000,000 with explanatory note. UNESCO, Paris, 54 pp, ISBN 92-3-101484-6.
van der Laan, F., 1986. Landscape-guided climatic inventory using remote-sensing imagery. RSC Series 36, FAO, Rome, Italy, 49 pp.
World Bank, 1998. World Development Indicators 1998 CD-ROM. Development Data Group, World Bank, Washington DC, USA.