INTEGRATION OF POINT CLOUDS AND IMAGES ACQUIRED FROM A LOW-COST
NIR CAMERA SENSOR FOR CULTURAL HERITAGE PURPOSES
M. Kedzierskia, P. Walczykowskia, M. Wojtkowska a*, A. Fryskowskaa
a
Department of Remote Sensing Photogrammetry and Imagery Intelligence, Institute of Geodesy, Faculty of Civil Engineering and Geodesy, Military University of Technology, 2 gen. S. Kaliskiego st., 00-908 Warsaw, Poland - [email protected]
Commission II, WG II/8
KEY WORDS: integration, point cloud, NIR images, transformation, texturing, mapping, Old Town in Warsaw
ABSTRACT:
Terrestrial Laser Scanning is currently one of the most common techniques for modelling and documenting structures of cultural heritage. However, only geometric information on its own, without the addition of imagery data is insufficient when formulating a precise statement about the status of studies structure, for feature extraction or indicating the sites to be restored. Therefore, the Authors propose the integration of spatial data from terrestrial laser scanning with imaging data from low-cost cameras. The use of images from low-cost cameras makes it possible to limit the costs needed to complete such a study, and thus, increasing the possibility of intensifying the frequency of photographing and monitoring of the given structure. As a result, the analysed cultural heritage structures can be monitored more closely and in more detail, meaning that the technical documentation concerning this structure is also more precise. To supplement the laser scanning information, the Authors propose using both images taken both in the near-infrared range and in the visible range. This choice is motivated by the fact that not all important features of historical structures are always visible RGB, but they can be identified in NIR imagery, which, with the additional merging with a three-dimensional point cloud, gives full spatial information about the cultural heritage structure in question. The Authors proposed an algorithm that automates the process of integrating NIR images with a point cloud using parameters, which had been calculated during the transformation of RGB images. A number of conditions affecting the accuracy of the texturing had been studies, in particular, the impact of the geometry of the distribution of adjustment points and their amount on the accuracy of the integration process, the correlation between the intensity value and the error on specific points using images in different ranges of the electromagnetic spectrumand the selection of the optimal method of transforming the acquired imagery.As a result of the research, an innovative solution was achieved, giving high accuracy results and taking into account a number of factors important in the creation of the documentation of historical structures. In addition, thanks to the designed algorithm, the final result can be obtained in a very short time at a high level of automation, in relation to similar types of studies, meaning that it would be possible to obtain a significant data set for further analyses and more detailed monitoring of the state of the historical structures.
* Corresponding author
1. INTRODUCTION
Laser scanning technology is based on using active sensors, which transmit and receive visible light radiation for measuring distances. In addition to the distance information, the data from the laser scan also contains information on the intensity of the returning light (Petrie and Toth, 2009), (Vosselman and Maas 2010). The main advantages of laser scanning include the immediate generation of a three-dimensional point cloud, the of distance measurements, the ability to measure even low lighting conditions and competitive costs.
With the development of laser scanning devices on a commercial level, there is much speculation about the complete replacement of photogrammetry by laser scanning. Imagery data does still however have many features that cannot be attributed to data derived from laser scanning and thus the more favourable solution is to combine photogrammetry and laser scanning (Szulwic et al., 2015). The main advantages of imagery data is its similarity to human vision, a well-known internal geometry, good interpretability, the ability to register texture and multispectral information about the reflectivity, the possibility of modelling moving objects, reproducible results and the fact that data acquisition can be done using a framing
method. Due to an image's geometric stability, they can be a good reference for checking point clouds from laser scanning. The term integration can be defined as a combination of two separate units, to give a new entity. A proper integration of data from laser scanning and imaging data can compensate for individual weaknesses of each method, it is also an essential step to obtain accurate, photorealistic 3D models of heritage objects, as data from laser scanning often do not contain sufficient information for an advanced understanding of the modelled object, especially when it is of world heritage and it is forbidden to affect its structure (Reshetyuk, 2009).
For the research being discussed in the article, the integration of the data is limited to applying a texture to a point cloud acquired by laser scanning using images in the near-infrared and visible range and then using the results to perform analyses for the purpose of documenting structures of world heritage, as well as to monitor the size and direction of changes occurring within its structure. (Martinez-De Dios and Ollero, 2006).
The aim of the study was to analyze the possibility of using imagery data obtained from low-cost non-metric cameras in the near infrared region and integrating them with a point cloud, taken using terrestrial laser scanning, as well as o automate this process using a proprietary algorithm. The scope of the research included the acquisition of data in the form of a point cloud and
imagery data, processing of the data, and their integration. The last stage of the study concerned the accuracy analysis of the results of the integration of point clouds with images in both the near infrared and visible range, as well as an indication of the practical applications of the resulting algorithm, in terms of cultural heritage conservation.
The article is divided into six parts. The first contains an introduction, the second section briefly describes the problems of terrestrial laser scanning and the characteristics of the image data obtained in the visible and NIR, while the third part presents the research methodology. The fourth part describes the research experiment. The fifth describes the results and a metric digital camera with CCDs is characterized.
2.1 Terrestrial laser scanning
Laser scanning is a rapidly growing technology that allows a remote measurement of spatial objects by scanning their surface. This technology is based active sensors, which transmit and receive light radiation to measure distances. In addition to the distance information, the data from the laser scan also contain information on the scattering intensity of the returning light. If the returning wave is in its complete, the accuracy of the distance measurements can be improved by means of additional processing. Moreover, these are some of the most commonly used three-dimensional data for visualization and documentation of cultural heritage objects (Armesto-González et al., 2010), (Bardsley and Bai, 2007), (Fryskowska et al., 2015), (Sester, 2007), (Wilinska et al., 2012).
2.2 Image data
With the development of technology, image acquisition using optoelectronic systems has become a standard in photogrammetry. The main component of an image acquisition system is a digital optical sensor, though increasingly such platforms are composed of various types of such equipment (Stateczny and Bodus-Olkowska, 2015). In connection with various tasks encountered in photogrammetry, images are obtained from different altitudes and within different ranges of the electromagnetic spectrum. Very high spatial and radiometric resolutions are being obtained these days not only by metric sensors, but also non-metric cameras commonly used in photography, meaning that they have the potential to be used in close range photogrammetry (Kedzierski and Wierzbicki, 2015) (Koutsoudis et al., 2014).
The common data acquisition system used in most modern day cameras is a rectangular array of CCD or CMOS detectors or a CCD line of detectors. In order to acquire a colour image in the visible range, there is usually a set of RGB filters, called a Bayer filter, located just in front of the light-sensitive detector array. Half of the elements in this filter correspond to the green component, while 25% of the elements make up the red and blue channels. The individual detectors record the colour information from one channel, after which this information is interpolated and the entire image is generated in its final colour form (Orych, 2015).
3. METHODOLOGY
Integration of data from a laser scan with imagery data can be done in many different ways (Kimpton et al., 2010), (Mikrut et al., 2016), (Rönnholm et al., 2007), (Zator et al., 2012). This depends inter alia on the desired final product and the available source data (Alshawa et al., 2009). This paper focuses mainly on integration in terms of applying texture to a point cloud using terrestrial photographs acquired using non-metric digital cameras in the VIS and NIR range (Fang et al., 2003), and in the case of low-cost NIr cameras - using the false-NIR imagery. Texturing a point cloud is performed using a set of corresponding points, which are uniquely identifiable on both the cloud and the image (Forkuo, 2005). During texturing targets placed on the scanned object may be used. The availability of such points makes it easy to identify them, because of their contrast within the point cloud visible in the colours representing the signal intensity also on the image (Meierhold, 2010). Linking the point cloud to pixels the image is similar to the recording of separate sets of points. If it is impossible to use the target placed on the object, texturing can be done by linking the image and point cloud based on characteristic elements of the modelled object. To register a point cloud with image pixels, the following transformations were used: a modified DLT (Molnar, 2010), prospective (Lehmann et al., 1999) and polynomial (Pitas, 2000).
As part of the research, a point cloud was integrated with imagery data from both the near infrared and in the visible range, and then a comparative analysis of the results was performed. This choice of imagery is motivated by the fact that not all important features of historical structures are always visible in RGB, but they can be identified in NIR imagery, which, with the additional merging with a three-dimensional point cloud, gives full spatial information about the cultural heritage structure in question.
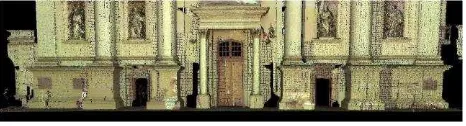
The point cloud data was obtained using a Leica ScanStation 2 terrestrial laser scanner. A point cloud obtained from one scanning position was implemented. These data were filtered to give the resulting scan resolution of 15 mm (Figure 1). The intensity of the laser signal reflected from the object was within in the range of 0-1.
Figure 1.Point cloud representing the measured object after filtration
Imagery data in the visible range (R, G, B channels) were acquired using a Sony NEX-5R camera with a typical Bayer filter, whereas the near-infrared images obtained using a similar model - the Sony NEX-5T (Kedzierski et al., 2014). The Sony NEX-5T camera is modified so that in addition to visible light, it can capture the near-infrared range. In order to take images in the NIR range, a filter applied to the lens, transmitting only light with a wavelength of over 700 nm. The images used to in this research consist of three components: NIR image component 1, component 2 and NIR component 3. Both of the cameras used in this study can be considered as low-cost. Using such cameras makes it possible to increase the frequency of documenting cultural heritage sites, at the same time lowering the costs of such work.
The research consisted of conducting a series of analyses that aimed to determine the preconditions for integrating a point
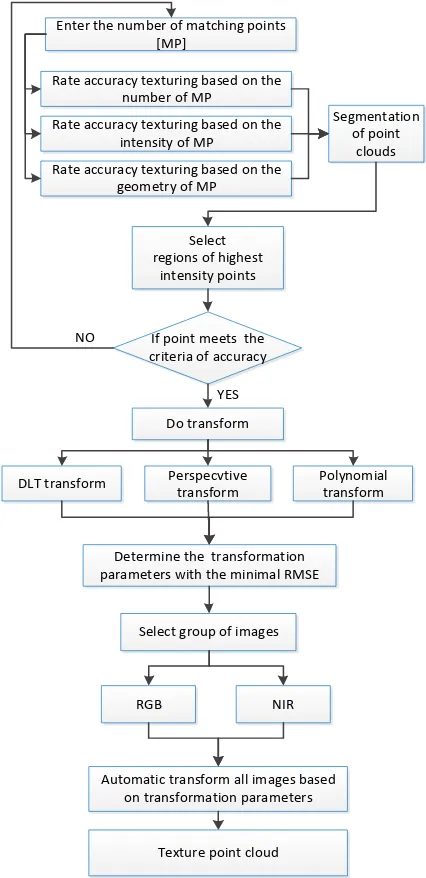
cloud with images from a digital camera, as well as the design of an original algorithm which utilises the RGB image transform coefficients for texturing with NIR images. A diagram of conducted research is shown in Figure 2.
NO
YES Enter the number of matching points
[MP]
Rate accuracy texturing based on the number of MP
Rate accuracy texturing based on the geometry of MP
Rate accuracy texturing based on the intensity of MP
Segmentation of point
clouds
If point meets the criteria of accuracy
Do transform
DLT transform Perspecvtive transform
Polynomial transform
Determine the transformation parameters with the minimal RMSE
Select group of images
Automatic transform all images based on transformation parameters
NIR RGB
Texture point cloud Select regions of highest
intensity points
Figure 2. Diagram of conducted research
4. THE RESULTS AND DISCUSSION
A part of the research, a number of research studies were conducted, the aim of which was to investigate the effect of various factors on the results of the final integration of imagery data with point clouds, on the basis of the historic object. Among other things, the impact of the distribution geometry and the number of matching points used in the integration process was tested. It was also examined whether there is a correlation between the intensity of the reflection of the laser signal and the error on individual points when using images in different ranges of the electromagnetic spectrum.
4.1 Impact of the distribution geometry of matching points on the texturing accuracy
The first stage of the research was to determine the impact of the geometric distribution of matching points on the accuracy of texturing. The analysis was performed in two variants, each time determining the minimum number of points required for data integration. In the first case, adjust the points are distributed on the surface of the entire image, while in the second approach they are located only on a portion (approx. 25%) of the image surface. Texturing was performed for the pictures in the near infrared and visible ranges and their components. The mean error of the texturing is shown in Figure 3.
Figure 3. Summary of the mean errors of texturing for RGB and NIR imagery for different distribution geometries of matching
points
Based on Figure 3 it can be concluded that the smaller mean errors of integrating the imagery with the point cloud were obtained when the matching points were focusing on only a fragment of the test object. However, after performing a visual analysis of all cases, it can be concluded that the texturing is only correct locally, and the object was modelled with numerous errors. For example, selected portions' (windows') texture is offset from the point cloud, even by more than 60 cm (Figure 4).
a) b)
Figure 4. Texturing errors using the NIR image: 1) uneven distribution of points b) even distribution of points
Concluding the results of the analysis of the effect of the distribution geometry of matching points on the texturing accuracy, it can be seen that there is a better fit between the images and the cloud point, when the points are not focused on just one area, but placed evenly on the entire surface of the modelled object, and that a smaller texturing error does not necessarily mean better fitting texture . The same results were obtained in all cases, whichever image was used for texturing.
Therefore, for a proper texturing, all further studies were carried out with adjustment points evenly distributed throughout the analyzed area.
4.2 Impact of the number of matching points on the accuracy of texturing
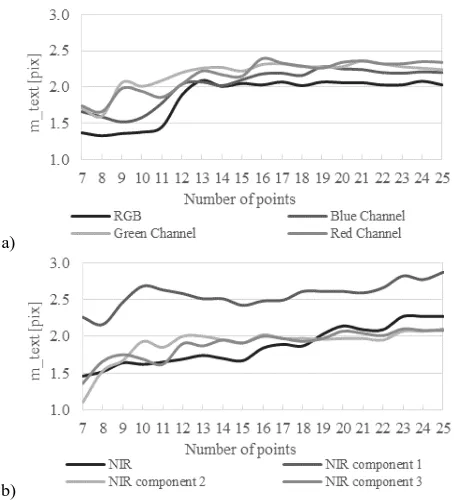
The next study aimed at determining the optimal number of matching points necessary to carry out the texturing with sufficient accuracy. As in the previous case, imagery acquired in the near infrared and in the visible range was used for texturing, together with a set 7 to 25 points evenly distributed on the surface of the studies structure. The error values corresponding to the number of points is shown in Figure 5.
a)
b)
Figure 5. A summary of mean errors of texturing with a given image with relation to the number of matching points used
By analyzing these relationships, an upward trend in the mean texturing error can be observed with reference to the number of matching points. In the case of an RGB image and its components (Figure 5.a), the texturing error is in the range of 1.3 to 2.4 pixel ((sRGB = 0.28 ± pix). The biggest differences in the error values can be observed when using between 7 and 11 points. However when the number of points is above 12 , the error values are close to each other and remain at a relatively stable level of 2.0 to 2.5 pixel. For NIR imagery (Figure 5.b), each successive matching point steadily increases the mean error, with the error values being in the range of 1.1 to 2.9 pixel ((sNIR = ± 0.37 pix). As in the case of texturing with an image in the visible range and its components, when using the image in the near infrared range, the shape of the error curves and their values on the graph are similar. Only the curve representing the texturing using the first NIR image component stands out from the others, which may be due to the very low contrast of this component.
The above analysis shows that, in order to correctly apply texture to an object using RGB or NIR imagery with sufficient accuracy, 12 - 14 matching points should be determined and evenly distributed over the entire area which is to be analyzed. One may also find that using a smaller number of matching
points generates a lower mean texturing error. It should always be taken into account that the mean error value is not always reflected in the accuracy of matching the images with the point cloud. In addition calculating the mean errors, a visual analysis of the generated model should also always be conducted.
4.3 Impact of the intensity of the matching points on the texturing accuracy
In the next stage of the research, we examined whether there is a relationship between the texturing error and the intensity of the returning signal from each of the matching points.
As part of a preliminary study, laboratory tests were first conducted to determine the specificity of the laser signal reflected from the materials that make up the object. We analyzed samples of stoneware, tiles, roughcast, metal and PVC. Laboratory measurements were taken from different distances and at various angles of incidence of the laser beam on the material sample. Results are shown in Figure 6 and Figure 7.
Figure 6. Relationship between the intensity of the returning signal as a function of the scanning distance for chosen test
samples
Figure 7. Relationship between the intensity of the returning signal as a function of the scanning angle for chosen test
samples
As can be seen in Figure 6, the highest intensity values were achieved for scanning distances of 20 m, which is due to the fact that used terrestrial laser scanner has the beam waist at this point (Kędzierski and Fryskowska, 2015). In contrast, on the basis of Figure 7 it can be seen that large scan angles significantly weaken the strength of the return signal, and by increasing the scan angle value, the intensity of the signal reflected from the object is significantly decreased (even by half). Therefore, the measurements of the studies should be performed from a distance of 20 m with the terrestrial laser
scanner positioned so that the light beam is close to perpendicular to the surface on as large an area as possible. Furthermore, considering the impact of the material, from which the measured object is constructed, it can be noted that the adjustment points must be located on the area covered by roughcast, PVC or stoneware, as only these materials provide reflection of a signal with an intensity of 0.5 or higher. Thus, before texturing, a segmentation of the scanning data should be performed, dividing the point cloud into segments, each representative of one material type.
The next step was to perform the study on the building which is the main object of this research. The mean texturing error values for the RGB and NIR images were first normalized to the intensity value rang, which is from 0 to 1. Next the data was sorted in ascending order of signal reflection value. The results are shown in Figure 8.
Figure 8. Summary of normalized texturing error values for the RGB and NIR images as a function of intensity of the matching
points
Based on the above summary it can be concluded that the value of the mean texturing error for RGB images systematically decreases with increasing reflectivity. But for NIR images, precision initially decreases, then with an intensity of above 0.5 it begins to grow and adopt values similar to those of RGB images. Also it can be concluded that in order to ensure a high accuracy of the end product, all pending analyses should be conducted using matching points selected in such a way so that the intensity of the reflection is not less than 0.5, and thus located on roughcast, PVC or stoneware. For this purpose algorithm was designed which performs a segmentation of the point cloud, and then from each segment only selects those points which have an intensity above a specified threshold. Ultimately, the user selects those points from this subset, which represent a chosen terrain detail, and are then involved in the subsequent transformation of the image and its layering onto the scan.
4.4 Impact of the transformation method on the texturing accuracy
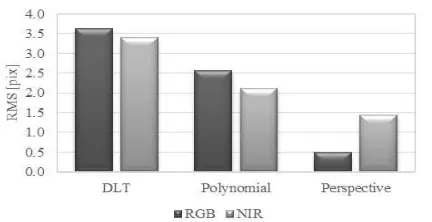
As part of the next step it had been determined which image transformation should be used for the presented case in the texturing process. The DLT, perspective and polynomial transformations were analyzed. In each instance, 12 synonymous adjustment points located on predetermined terrain details were determined, making sure that criteria of sub-paragraphs 4.1 - 4.3 are met. The results of the transformation are summarized in Figure 9.
Figure 9. Summary of the mean error value for RGB and NIR image transformations
Based on the above figure it can be stated, that the best results were achieved for the perspective transformation, which was characterized by an RMS error equal to 0.50 pix for the RGB image and 1.45 pix for the NIR. The other transformations (DLT and polynomial) in this given case gave much higher errors of more than 2 pixels. Therefore, the future algorithm for integrating point clouds with terrestrial imagery acquired using non-metric cameras will utilise the perspective transformation parameters.
4.5 Algorithm for texturing using a set of RGB and NIR imagery
After determining the geometry conditions of the adjustment points and determining the optimal type of transformation for the case in question, we began to design the algorithm for integrating NIR imagery with a point cloud using the parameters calculated for the RGB image transformation. The condition for using this algorithm, is that the images must maintain the same aspect ratios. That way, if the image consisting of three channels has little contrast, you can use one channel, which is more favorable radiometrically and conduct the image orientation based on it. An evaluation of the radiometry is based on the Michelson contrast (1), where lmin and lmax are respectively the minimum and maximum DN value occurring on the analyzed image (Michelson, 1995).
min been processed by means of transform coefficients calculated for RGB images. The algorithm uses user defined transformation accuracy thresholds in order to accept or reject the results. The accuracy is determined by the RMSE.
The figure shows the idea of assigning a color to each point of the cloud by applying the image onto the point cloud.
Figure 10: The idea of the integration of the point clouds and images
Algorithm 1 Integration point cloud with RGB and NIR images
Require: registration point cloud with images for Image from camera the same band i do
Match each pixel from each channel with point from laser scanner
end for
while There is RGB image do
for Each pixel from RGB image do
1. Build point using RGB image space
2. Find correspondences between pixels and points from point cloud
3. Use Perspective Transform algorithm to transform image 4. Calculate transformation parameters
5. Calculate RMSE
6. Determine the transformation parameters with the minimal RMSE
7. Take (X,Y,Z) coordinate from each point from point cloud 8. Calculate RMSE for matching point from laser scanning
and point from RGB image
9. Add RGB information to every point from point cloud 10. Save the result and calculate new image after Perspective
Transform transform end for
end while
return New RGB image while There is NIR image do
for Each pixel from NIR image do 1. Build point using NIR image space
2. Find correspondences between pixels and points from point cloud
3. Use the transformation parameters with the minimal RMSE from RGB transform
4. Use Perspective Transform algorithm to transform image 5. Calculate RMSE
6. Determine the transformation parameters with the minimal RMSE
7. Take (X,Y,Z) coordinate from each point from point cloud 8. Obtain x,y from image space and sign to every scan point 9. Calculate RMSE for matching point from laser scanning
and point from NIR image
10. Add NIR information to every point from point cloud 11. Save the result and calculate new image after Perspective
Transform transform end for
end while
return New NIR image
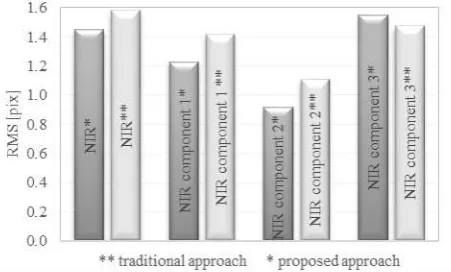
As a result of the algorithm, a point cloud which had been textured using NIR images and their components is obtained together with errors shown in Figure 11. As a comparison, these errors are shown beside the results obtained without using this proprietary algorithm.
Figure 11. The RMS error for the NIR image and its components using a traditional approach and using the
proposed approach
As can be seen in the figure above, achieved results have a high accuracy, not exceeding 2 pixels, which for the considered images falls entirely within acceptable limits. Furthermore, the
algorithm also resulted in an increase in accuracy of about 8%. Thanks to the proprietary algorithm, which performs the transformation of both the whole NIR image and its individual components simultaneously, the processing time had been significantly shortened, which is important especially when frequently monitoring and documenting cultural heritage sites (Kędzierski et al., 2014).
A good example can be a fragment of a wall of the historic church in the Old Town in Warsaw, with the cracks that would need to be kept under strict observation can only be seen in the NIR image (Figure 12).
a) b)
Figure 12. Repaired cracks in the wall of an old church in the Warsaw Old Town, as seen on an image taken in the a) visible
range and b) near infrared range
The repaired fragment of the cracked wall, which had undergone conservation works, is very hard to differentiate in the RGB image. In contrast, it is much more clearly seen in the NIR picture, which, when it will have been integrated with a point cloud by means of texturing, will allow for more precise monitoring of the size and direction of the changes occurring on the cultural heritage site.
Using RGB images and a point cloud made it impossible to distinguish them in any way from the surroundings. They are however perfectly visible and could be precisely measured on the NIR images and their constituents. An example of such a situation is shown in Figure 13 and Figure 14.
a) b)
Figure 13. Moisture visible on a fragment of the building's facade on a) a point cloud and b) a NIR image
a)
b)
Figure 14. Moss visible on a fragment of the building's facade on a) a point cloud and b) a NIR image
5. CONCLUSIONS
The paper presents the results of studies on the integration of a point cloud with imagery data in the near infrared and visible range for the purpose of documenting cultural heritage sites. A comparative analysis of the results of this integration with the use of images in the NIR with reference to the use of images in RGB was also carried out. As a result of study examined several factors which influence the outcome of the integration, enabling the Authors to determine the optimum conditions for texturing with imagery data in the near infrared range. It was found that the distribution geometry of matching points has a significant effect on the integration process and final product. The points tying the point cloud with the imagery data need to be distributed uniformly over the entire surface of the test object. The smallest deviations between field measurements and measurements conducted on the textured points cloud were obtained for the second component images of the near-infrared range image. The data set resulting from the integration of the point cloud with imagery data in the near infrared may be used for accurate detection of the state of a building facade, especially in the identification of fragments of the facade, which are potentially prone to damage or destruction, which in the case of cultural heritage structures is very undesirable. The proposed method of data integration is a source of 3D Technology, the Faculty of Civil Engineering and Geodesy, Department of Remote Sensing Photogrammetry and Imagery Intelligence.
REFERENCES
Alshawa, M., Grussenmeyer, P., Smigiel, E., 2009. A low cost TLS based land mobile mapping system assisted by photogrammetry. Boletim de Ciencias Geodesicas 15 (5), pp. 743-761.
Armesto-González J., Riveiro-Rodríguez B., González-Aguilera D., Rivas-Brea M. T., 2010. Terrestrial laser scanning intensity data applied to damage detection for historical buildings. Journal of Archaeological Science, 37(12), 3037-3047.
Bardsley, D. J., Bai, L., 2007. 3D surface reconstruction and recognition. In: Defense and Security Symposium, International Society for Optics and Photonics, pp. 653906-653906.
Fang, Y., Yamada, K., Ninomiya, Y., Horn, B., Masaki, I., 2003. Comparison between infrared-image-based and visible-image-based approaches for pedestrian detection. In: Intelligent Vehicles SymposiumProceedings, pp. 505-510.
Forkuo, E. K., 2005. Automatic fusion of photogrammetric imagery and laser scanner point clouds. Doctoral dissertation, The Hong Kong Polytechnic University.
Fryskowska A., Walczykowski P., Delis P., Wojtkowska M., 2015. ALS and TLS data fusion in cultural heritage documentation and modeling. The International Archives of
Photogrammetry, Remote Sensing and Spatial Information Sciences, 40(5), 147.
Kedzierski, M., Fryskowska, A., 2015. Methods of laser scanning point clouds integration in precise 3D building modelling. Measurement, 74 , pp. 221-232.
Kedzierski, M., Wierzbicki, D., 2015. Radiometric quality assessment of images acquired by UAV’s in various lighting and weather conditions. Measurement, 76, pp.156-169.
Kedzierski, M., Wilinska, M., Wierzbicki, D., Fryskowska, A., Delis, P., 2014. Image data fusion for flood plain mapping. In: Environmental Engineering. Proceedings of the International Conference on Environmental Engineering. ICEE, Vol. 9, p. 1. Vilnius Gediminas Technical University.
Kimpton G., Horne M., Heslop D., 2010. Terrestrial laser scanning and 3D imaging: Heritage case study–The Black Gate, Newcastle Upon Tyne. International Archives of the Photogrammetry, Remote Sensing and Spatial Information Sciences, 325-330.
Koutsoudis A., Vidmar B., Ioannakis G., Arnaoutoglou F., Pavlidis G., Chamzas C., 2014. Multi-image 3D reconstruction data evaluation. Journal of Cultural Heritage, 15(1), 73-79.
Lehmann, T. M., Gonner, C., Spitzer, K., 1999. Survey: Interpolation methods in medical image processing. IEEE transactions on medical imaging, 18(11), pp. 1049-1075.
Martinez-De Dios, J. R., Ollero, A., 2006. Automatic detection of windows thermal heat losses in buildings using UAVs. In 2006 World Automation Congress, pp. 1-6
Meierhold, N., Spehr, M., Schilling, A., Gumhold, S., Maas, H. G., 2010. Automatic feature matching between digital images and 2D representations of a 3D laser scanner point cloud. International Archives of Photogrammetry, Remote Sensing and Spatial Information Sciences, 38, pp. 446-451.
Michelson, A. A.,1995. Studies in optics. Courier Corporation.
Mikrut, S., Kohut, P., Pyka, K., Tokarczyk, R., Barszcz, T., Uhl, T., 2016. Mobile Laser Scanning Systems for Measuring the Clearance Gauge of Railways: State of Play, Testing and Outlook. Sensors, 16(5), pp. 683.
Molnár, B., 2010. Direct linear transformation based photogrammetry software on the web. International Archives of Photogrammetry, Remote Sensing and Spatial Information Sciences, 38, Part 5.
Orych, A., 2015. Entering the digital era of the Open Skies Treaty. Geodesy and Cartography, 64(1), pp. 65-74.
Petrie, G., Toth, C. K., 2009. Terrestrial laser scanners. Topographic Laser Ranging and Scanning Principles and Processing, pp. 87-128.
Pitas, I., 2000. Digital image processing algorithms and applications. John Wiley & Sons.
Reshetyuk, Y., 2009. Self-calibration and direct georeferencing in terrestrial laser scanning, (Dissertation), Royal Institute of Technology, Stockholm, Sweden.
Rönnholm, P., Honkavaara, E., Litkey, P., Hyyppä, H., Hyyppä, J., 2007. Integration of laser scanning and photogrammetry. International Archives of Photogrammetry, Remote Sensing and Spatial Information Sciences, 36(3/W52), pp.355-362.
Sester, M., 3D visualization and generalization. In: Proceedings of the 51th Photogrammetric Week, Stuttgart, Germany, 3–7 September 2007, Vol. 7, pp. 285–295.
Stateczny, A., Bodus-Olkowska, I., 2015. Sensor Data Fusion Techniques for Environment Modelling. Neural Networks (ANN), 12, 18.
Szulwic, J., Burdziakowski, P., Janowski, A., Przyborski, M., Tysiąc, P., Wojtowicz, A., ... Matysik, M., 2015. Maritime laser scanning as the source for spatial data. Polish Maritime Research, 22(4), pp. 9-14.
Wilinska, M., Kedzierski, M., Zaplata, R., Fryskowska, A., Delis, P., 2012. Noninvasive methods of determining historical objects deformation using TLS. Structural Analysis of historical construction, Vol.3, Wroclaw 2012, pp. 2582-2588.
Vosselman, G., Maas, H. G. (Eds.), 2010. Airborne and terrestrial laser scanning. Whittles Publishing.
Zator, S., Michalski, P., Lasar, M., 2012. Laczenie chromatyki obrazow z danymi przestrzennymi. Pomiary Automatyka Kontrola, 58 (11), pp. 962-964.