EFFECTIVE DETECTION OF SUB-SURFACE ARCHEOLOGICAL FEATURES FROM
LASER SCANNING POINT CLOUDS AND IMAGERY DATA
A. Fryskowska a*, M. Kedzierski a, P.Walczykowski a, D. Wierzbicki a, P. Delis a, A. Lada a a
Department of Remote Sensing Photogrammetry and Imagery Intelligence, Institute of Geodesy, Faculty of Civil Engineering and Geodesy, Military University of Technology, 2 gen. S. Kaliskiego st., 00-908 Warsaw, Poland – [email protected]
Commission II, WG II/8
KEY WORDS: point cloud, laser scanning, extraction, mapping, settlement, sub-surface feature
ABSTRACT:
The archaeological heritage is non-renewable, and any invasive research or other actions leading to the intervention of mechanical or chemical into the ground lead to the destruction of the archaeological site in whole or in part. For this reason, modern archeology is looking for alternative methods of non-destructive and non-invasive methods of new objects identification. The concept of aerial archeology is relation between the presence of the archaeological site in the particular localization, and the phenomena that in the same place can be observed on the terrain surface form airborne platform. One of the most appreciated, moreover, extremely precise, methods of such measurements is airborne laser scanning. In research airborne laser scanning point cloud with a density of 5 points/sq. m was used. Additionally unmanned aerial vehicle imagery data was acquired. Test area is located in central Europe. The preliminary verification of potentially microstructures localization was the creation of digital terrain and surface models. These models gave an information about the differences in elevation, as well as regular shapes and sizes that can be related to the former settlement/sub-surface feature.
The paper presents the results of the detection of potentially sub-surface microstructure fields in the forestry area.
1. INTRODUCTION
1.1 Problem statement
Based on the analysis and interpretation of the laser scanning data, it is possible to identify previously unknown archaeological sites, mainly these with preserved landscape form, including settlements, burial barrow, megalithic tombs, the historical network of roads and fields, fortifications, ramparts, cropping systems, remnants of mining activities and mining and many other aspects of past settlements. What is more, airborne laser scanning (ALS) is very effective in forest areas. Areas covered by high vegetation for decades been regarded by archaeologists as unavailable for detailed penetration. Detection of archaeological structures is based on the observation of marks in the relief (distinguishing shadow, snow, flood, soil), or arising as a result of changes in the structure of the soil, associated with human activities (distinguishing vegetation, humidity, temperature).
Aerial laser scanning (named also LIDAR) in archeology is used in two ways. Firstly, based on the analysis and interpretation of the collected data, it is possible to reconnaissance of previously unknown archaeological sites, mainly these with the preserved landscape form. LIDAR applications for assessing settlements are presented among others in publications (Fisher et al., 2016), (Prufer et al., 2015), (Ebert et al., 2017) (FOTOLOT). Laser scanning capabilities are shown in forest areas (Koening and Hoefle, 2016) and (Wallace et al., 2012). The second way shows that by analyzing laser scanning products it is possible to validate the results of previous research on archaeological sites. The quality and spatial resolution of airborne laser scanning data enables identification of the minimal variation in terrain relief, including those resulting from human activity. As a result, the current works can be further refined.
Microstructures are the results of human settlement activity. Settlements are remnants of historical, ancient settlements. The agricultural activity caused that only these traces remain below the surface of the earth, but the preserved objects are characterized by circular or polygonal elevations, often with traces of wooden earth.
It should be emphasized that the impossibility of identifying archaeological objects on elaborated derivative scans does not have to by caused by the absence of traces of past human activity in a given place. This may be due to limitations in the method and subjectivity of spatial data and analytical tools, as well as ignorance about these aspects (Banaszek, 2014), (Mania, 2008).
As a result of the activity of previous generations, these objects have been leveled up to the ground level, and agricultural activity has left only small traces below the surface of the earth and in its morphology, after these architectural forms. These marks are most often not noticeable when viewed from the ground, but can be seen from the air in favorable conditions, especially when highlighted. Identification of archaeological objects is based on the observation of so-called marks / features that appear in terrain relief (shade, snow, flooding) or the resulting changes in the soil structure associated with human activity (vegetation, humidity, temperature, crop, soil and shadow marks, are generally associated with the presence of buried archaeological remains) (Furmanek, 2013), (NSA), (Alexakis et al., 2009). By verifying the objects that affect the terrain, attention should be paid to several factors/marks: flood, snow, soil, vegetation, humidity, shade and temperature (Beck, 2007), (Bewely, 2003).
On the basis of analyzes of data obtained remotely and products obtained from the cloud of laser scanning, only three can be identified: shade, flood, vegetation. Other are short-term phenomena, or phenomena whose occurrences cannot be analyzed on the cloud of points or products created from it. The
aim of this article is to analyze the possibility of using LIDAR and Unmanned Aerial Vehicles (UAV) data for the detection and identification of settlements sites.
1.2 Patterns and shapes of medieval Slavic settlements
Medieval Slavic settlements located in Poland are characterized by their shape. We can distinguish several forms. These forms are usually conical, forming an oval, circular, semicircular, or quadrilateral shape of the fortification of the castle. More elaborate forms are multi-layered, however, containing most of these forms.
Figure 1. Typical construction of Slavic settlements (N1, N2)
For the remote detection of field structures representing the area of the old fortifications may be used topographic map, aerial photography, UAV imagery or altitude data obtained e.g. LIDAR technology. In (Wilinska et al., 2012) remote, non-invasive analysis of archeological structures condition are shown. The comparison of classical aerial imagery and UAV data is presented in (Mikrut, 2016).
In Figure 2 example of Slavic settlements is shown.
Figure 2. Example of Slavic settlement represented by different data types, from the left: orthoimage, topographic map and
DTM
In the case of bare settlements, the interpretation of the position and the course of the border of the structure is simple. In case the settlement is overgrown with vegetation, it may be insufficient. Figure 3 shows the structures covered with vegetation and their interpretation on various data.
Fig. 3. Example of Slavic settlements presented with different data: orthoimage, DTM (shaded relief) and topographic map
(source: NICH)
2. MATERIALS AND METHODS
2.1 Data sets – structures
In research 5 structures have been chosen: two evident, known settlements: named object 1and object 2 (Figure 2 and Figure 5) and three suspected structures (Figure 6). "Suspicious areas" rise to about 5-7 meters in height relative to the environment. immediate vicinity of the discussed objects. (Figure 6 A,B), object 4- longitudinal embankment reaches its height at the highest points about 7 meters. (Figure 6 C,D),
object 5 – a group of field microstructures consists of numerous hills and embankments (Figure 6 E,F), that occur on the periphery of the wooded area depicted below. The detected forms are very different in shape and height. Elevation data was acquired for all selected areas (Table 1).
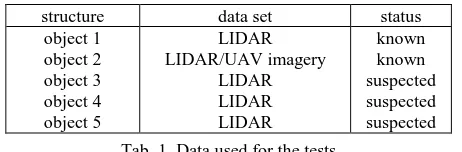
structure data set status
object 1
Object 1 is an example of well-preserved fortifications from the Middle Ages (XIIIth century). It is a two-part object. In its southern part, there is a conical elevation of up to 8 m, surrounded by a moat on the northern side. The northern, larger and lower part is adjacent to the shaft, also surrounded by a shaft and a moat. Additional protection on the south side was another line of the shaft and moat. Already in the 70's they were significantly reduced by plowing. The surface of the fortress, located on the edge of half arable land, is now covered with grass.
2.2 Data sets
The data used for the analyzes are airborne laser scanning data, point clouds generated from UAV imagery and orthophotomaps from classic aerial photographs. In research a ALS point cloud with a density of 5 points/sq. m was used. Additionally UAV imagery data was acquired. Point cloud have been generated on the basis of block of images oriented with Ground Control Points. Accuracy of image orientation was about 0.9 pixel. The accuracy of Digital Terrain Model (DTM) is up to 16 cm.
2.3 Methods
The basic research problem is defining marks that indicate the presence of underground (or partially covered with soil) microstructures using only point clouds information. What is more, there is a problem with increasing the accuracy of identification of existing marks. On the basis of analyzes of the products obtained from the ALS point cloud of we can only identify three types of marks, ie. shadow, vegetation (cropmark) and flood plains (which were characterized on the basis of long profiles) (compare Figure 2).
We can distinguish two main problems: geometry and accuracy.
Geometric aspect refers to the shape of the terrain, allowing defining the marks, and accuracy aspect indicates the ability to use data for the process of detecting structures.
The quality of the detection of structures and the accuracy of determining its course is influenced by a number of factors. This dependency is in the function of data acquisition and processing parameters. It is related to data acquisition parameters like point cloud density, but also to the geographic conditions (terrain slopes, land cover etc.). In post-processing step very important is classification accuracy or quality of denoising of the point cloud. The accuracy of acquiring and post processing laser scanning data is briefly described in many publications, and briefly described in (Fryskowska, 2017a), (Kedzierski and Fryskowska, 2015), (Przyborski, 2003). Below we propose a two-way point cloud processing scheme in fully automatic way. Proposed algorithms improve the accuracy of settlement structure detection.
Fig. 4. The scheme of point cloud processing in settlement feature extraction
First we have a point cloud (LIDAR or UAV), then we classify it and obtain one of the possible forms: filtered DTM or model with terrain cover – digital surface model (DSM). Very important is now the quality of filtered point clouds, because even small artifacts and noise can disturb the further results. (Fryskowska, 2017b)
The basis of proposed method are profiles through the suspected or real/known settlement areas.
The first way – comes through the real, bare earth structure and give very precise settlement shape, and the second supports identification of vegetation marks. Therefore, DSM not filtered with vegetation is required.
When going through first way, some characteristic features in the profiles have to be extracted.
In the beginning the interval of profiles/sections has to be determined (Figure. 20A). For precise feature extraction the interval between consecutive profiles should be about 1-5 % of the structure length. Then, points representing profiles are extracted and approximated with particular function (Figure 20B).
At the end, the inflection points of this curve are determined. These point will be taken to approximate one of the pre-defined settlement patterns: oval, circular, semicircular, or quadrilateral shape (Figure 1).
3. EXPERIMENT
Chosen structures were examined and considered as a medieval Slavic settlements. Proposed approach have been tested.
3.1 Classification and filtration
The basic process of pre-processing the point cloud obtained by airborne laser scanner is classification. It is based on assigning to each point of the cloud the proper attribute associated with the object on which the laser beam reflected. This way points lying on the ground, representing low vegetation, medium and high buildings and other classes from the whole cloud can be determined (Grilli et al., 2017). In the case of LIDAR data, it was necessary to establish the characteristics of each of the classes to which the individual elements of the terrain belong (Table 2).
vegetation parameter
low <1.5
medium 1.5-3.0
high >3.0
Table 2. ALS point cloud classification parameters
The same outliers and noise can be easily removed from the data. In case of UAV, clouds can be classified supporting RGB information (Figure 19 B).
3.2 Digital models
Settlements and other microstructures visible in the shape of the terrain surface are characterized by small elevations against the environment. Therefore, preliminary verification of the potential areas of microstructures requires the generation of a digital terrain model that will allow for the identification of elevation differences as well as regular shapes and sizes that may be related to past settlement.
Figure 5. Classical aerial image and DTM – object 1
Depending the aim, digital terrain or surface models should be generated.
Fig. 6. Digital terrain models from LIDAR for suspected structures – objects 3-5
The clusters of field forms shown in Figures 6 E and F are also located in the wooded area. The characteristic longitudinal embankment reaches its height at the highest points of about 7 meters. In addition, many terrain depressions can be seen on the figures above.
3.3 Feature analysis - LIDAR
Since the analysis of products obtained from the laser scanning cloud can only identify three types of markers, i.e. shading, vegetation and flooding (which were characterized by longitudinal profiles), the characteristics of the terrain were also determined using contours in the digital terrain model and external characteristics such as shape, height, length and width. The additional determinants that allow for the identification of an archaeological object are its topographic position and associated landscape elements. Characterized properties will be used a reference in quality analysis.
3.4 Vegetation marks - LIDAR
Analysis of vegetation marks is possible thanks to land cover. Covering the area include vegetation cover and various objects and structures.
The analysis was done using elevation profiles of the vegetation, that allowed to examine the vertical spatial structure of the vegetation. Such analysis is the basis for the distribution of land cover. The profiles are shown in Figures 7, 9, 10 and 11.
3.4.1. Known structure: The altitude profile of vegetation
(Figure 7) shows the vertical spatial structure of the vegetation on the examined terrain. Clearly visible are two hills, which are overgrown only with grass. Bushes grow on the slopes of the embankment.
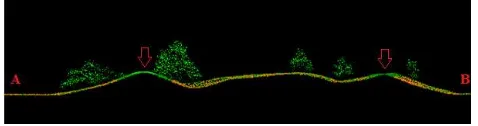
Fig. 7. Elevation profile of vegetation A-B – object 1
The factor that proves the presence of archaeological objects under the surface of the earth that results from the change of soil structure is vegetation. In places where hollows have been found, which are then filled with organic and mineral material, the soil is more fertile, it contains more moisture and causes the plants to grow higher. On the other hand, in places where stones or remains of foundations and walls lie, unfavorable conditions for plant development arise. The vegetation there is in poor condition.
3.4.2. Suspected structures: Both Figures (Figure 8A and B)
show an oval shape. The elevation is largely covered with grass and shrubs, which makes it visible from the surface. Shafts surrounding the fortification are about 5 meters high.
Figure 8. An example of archeological structure a) orthoimage b) terrain model generated on the basis of ALS point cloud
Figure 9 shows the elevation profile of the vegetation that overgrows the conical embankment.
Figure 9. ALS point cloud profile and identification of some marks: cropmark and shape – object 3
There are no significant differences in vegetation. As the height of the embankment increases, the height of the trees is proportional to the natural origin of the elevation. On the other hand, when analyzing the C-D profile (Figure 9), considerable variations in plant structure can be observed. The tall, thickly overgrown trees are visible in the first part, followed by a significant decrease in their height. Other profiles were performed at two specific sites for object 4 (Figure 6 C and 6 D). Both the area: A-B profile and C-D profile are characterized by horseshoe embankments. The profiles are presented in Figure 10.
Figure 10. Microstructure in the forested area - elevation profile with vegetation cover – object 4
The vegetation structure shown on the A-B and C-D elevation profiles (Figure 10) reveals a small extent the vegetation
characteristics. For A-B profile, there is a clear space in vegetation on one of the embankments. The vegetal cover shown on the C-D profile is in its entire length, but in the area of the landfill there is a visible decrease in the condition of the vegetation. The profiles: A-B and C-D show the structure that may indicate on the presence of objects related to human activity in the past.
Similar analyzes were carried out for the last structure - object 5: the elevation profile was used to verify the microstructure detected in the forested area . The profile is shown in Figure 11.
Figure 11. Microstructure in forest area – elevation profile A-B – object 5
The elevation profile shown above presents a significant difference in vegentation height. When analyzing the section, it can be seen that both tall and densely overgrown trees are visible in all profile long. In contrast, in the middle of the profile there is a large decrease in the height of the trees, which may indicate the existence of factors that have negative influence on growing.
3.5 Contour lines characteristic
A novel approach was to analyze the distribution of contour lines on a digital terrain model (Figure 12) and other features such as custom shape, height, length and width of terrain structure.
Contour lines connects points with the same height value. It can be seen that in the area of settlement the layout of the contour is much different from the surrounding. The contour values vary by about 5 meters at the top of the embankment and its foot. The character of the settlement is characterized by its form from the neighboring areas.
Figure 12. Object 2 - known settlement – digital terrain model with contour lines
On the basis of contour lines, it can be determined whether a given structure has elements of settlement or not.
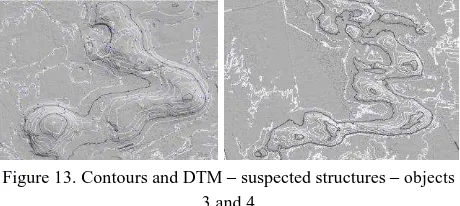
Figure 13. Contours and DTM – suspected structures – objects 3 and 4
These fragments of the terrain model with contour lines are characterized by a significant increase in the height of microstructure in comparison to the surrounding terrain. The difference in height of the embankment peak compared to the height of its foot is 5 meters, and in some forms even up to 7 meters. Comparing the height of the fortification shaft of the object 1 these values are similar.
3.6 Characteristics of flood marks on the basis of profiles
Flood marks emphasize terrain relief, for example during spring thaw or flood, when the tops of archaeological forms protrude above the water level, thus highlighting the height contrast to the surrounding terrain.
Figure 14. Object 1 - known settlement – location of profiles A-B and C-D with shaded DTM
Above the longitudinal profiles A-B and C-D are presented (Figure 14). Profiles allowed to identify the highest places in relation to the surrounding area.
Figure 15. Object 1 - known settlement – profiles A-B and C-D
The longitudinal sections (Figure 15) show that the settlement is characterized by two hills at the site of the embankment. Shafts rise above the terrain and surround the entire structure, which probably during the spring thaw causes them to dry faster, while during floods they cause them to protrude above the water level. In addition, in the middle part, the embankment was emphasized, which, according to the analyzed literature, is not characteristic of the fortified settlement.
To compare, the same analysis was taken for suspected area – object 3 (Figure 16).
Figure 16. Object 3 - suspected settlement – location of profiles A-B and C-D with shaded DTM
As shown in the Figure 17, the cross section of A-B shows a conical hill. A dump is visible, which in its peak is much higher than the surrounding terrain. It should be noted, however, that this object clearly differs in its form from the features of the fortified settlement, since one embankment is visible.
Figure 17. Profiles A-B and C-D of suspected structure – object 3
The C-D profile (Figure 17) is similar to the longitudinal profile of the object 1. Two hills are visible, which, in comparison to the known settlement object 1, are very specific.
Then, two connected, horseshoe embankments were analyzed. The area of the profiles on the digital terrain model is shown in Figure 18.
Analogous analyzes were performed for the other two areas / objects:
Figure 18. Profiles A-B and C-D of suspected structure – object 4
Analyzing the A-B profile, small hill can be seen. That can be presumed to be the location of the shaft. In addition, the horseshoe shape of the embankment visible on the digital terrain model may indicate that the profile was carried along the oval.
On the profile C-D (Figure 18), there are two characteristic hills, which resemble the longitudinal profile along the shorter radius of the oval shape of the settlement - object 1.
3.7 Point clouds - UAV data
Similar analyses were made for cloud points generated from UAV data for known structure - object 2.
A
B
Figure 19. Point cloud generated using UAV imagery A – point cloud with RGB coding, B – point cloud after calssification
According to processing scheme (Figure 4) point cloud was classified and filtered to bare ground.
Then, the interval between consecutive profiles/sections was determined as 2 m. Then, points representing profiles were extracted and approximated with the function (Figure 20B). At the end, the inflection points of this curve were determined.
Figure 20. point cloud profiles into characteristic point extraction A - profile points - green, B – profile points approximated with a function - red, C – inflection points –
black circles
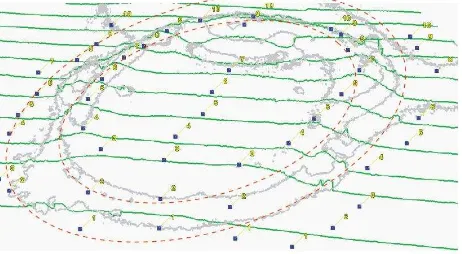
New inflection points represent characteristic points/features of analysed structure. These points connect into a particular type of shape - ovals (Figure 21, red dotted lines).
Figure 21. Sections and characteristic point of known settlement geometry – object 2
A
B
C
This is one of the first geometric feature that can represent the settlement medieval structure. Further research will focus on improving this approach and extract more kind of features.
4. CONCLUSIONS AND DISCUSSION
The aim of the research was to present the possibility of using point clouds for detection of terrain microstructures. Based on them, it can be confirmed that airborne laser scanning finds two-plane applications in archeology. Firstly, based on the analysis and interpretation of the collected data, it is possible to reconnaissance of unknown archaeological sites. Secondly, it shows that through the analysis of laser scanning products, it is possible to validate the results of previous research on known archaeological sites. Proposed approach using profiles and contour lines in much more effective than manual structure identification. In case of suspected areas it helps to define the origin of terrain structure. For known archeological structures (settlements) such approach helps in precise determination of geometry of the settlements.
ACKNOWLEDGEMENTS (OPTIONAL)
This paper is supported by the Faculty of Civil Engineering and Geodesy, Military University of Technology, Poland.
REFERENCES
Alexakis D., Sarris A., Astaras T and Albanakis K, 2009. Detection of Neolithic Settlements in Thessaly (Greece) Through Multispectral and Hyperspectral Satellite Imagery, Sensors 9(02), 1167-1187; doi:10.3390/s90201167
Banaszek L., 2014. Lotniczy Skaning laserowy w polskiej archeologii. Airborne laser scanning in polish archeology, Czy w pełni wykorzystywany jest potencjał prospekcyjny metody?, Uniwersytet im. Adama Mickiewicza
Beck, A. 2007. Archaeological site detection: the importance of contrast. Proceedings of the 2007 Annual Conference of the Remote Sensing and Photogrammetry Society, Newcastle University, Sept. 11-14, 2007.
Beweley R.H., 2003. Aerial survey for archaeology. Photogramm. Rec. 2003, 18, 273–292.
Ebert C, Hoggarth J., Awe J., 2016, Integrating Quantitative 2016. Identifying Ancient Settlement Patterns through LiDAR in the Mosquitia Region of Honduras. PLoS ONE 11(8):e0159890, https://doi.org/10.1371/journal.pone.0159890
FOTOLOT, 2017. http://www.pma.pl/fotolot/czymjest.html
Fryskowska A., 2017a. Accuracy assessment of point clouds geo-referencing in surveying and documentation of historical complexes, The International Archives of the Photogrammetry, Remote Sensing and Spatial Information Sciences, Volume XLII-5/W1, pp. 161-165, doi:10.5194/isprs-archives-XLII-5-W1-161-20
Fryskowska A., 2017b. A novel approach of laser scanning point cloud quality assessment using wavelet analysis, Book of Baltic Geodetic Congress
Furmanek M., 2013. Nauka i technika w służbie archeologii, Archeologia, Science and technology in archeology, Śląskie Centrum Dziedzictwa Kulturowego w Katowicach,
Grilli E., Menna F., and Remondino F., 2017. A Review Of Point Clouds Segmentation And Classification Algorithms, Int. Arch. Photogramm. Remote Sens. Spatial Inf. Sci., XLII-2/W3, 339-344, http://www.int-arch-photogramm-remote-sens-spatial-inf-sci.net/XLII-2-W3/339/2017/ doi:10.5194/isprs-archives-XLII-2-W3-339-2017
Kedzierski, M., Fryskowska, A., 2015. Methods of laser scanning point clouds integration in precise 3D building modelling. Measurement, 74 , pp. 221-232.
Koening K. and Hoefle B., 2016. Full-Waveform Airborne Laser Scanning in Vegetation Studies—A Review of Point Cloud and Waveform Features for Tree Species Classification, Forests 2016, 7(9), 198; doi:10.3390/f7090198
Mania W., 2008. Ile pucharów lejkowatych mieści się w jednym komputerze? Zdjęcia Lotnicze i GIS w archeologii Aerial images and GIS in archeology, Uniwersytet im. Adama Mickiewicza
Mikrut S., 2016. Classical Photogrammetry And UAV - Selected Ascpects, XXIII ISPRS Congress, Commission I, International Archives of the Photogrammetry Remote Sensing and Spatial Information Sciences, Volume: 41, Issue: B1,
NICH, National Institute of Cultural Heritage, website
NSA, National Archeological Museum http://www.pma.pl/fotolot/czymjest.html
Przyborski M., and Pyrchla J., 2003. Reliability of the navigational data, Intelligent Information Processing And Web Mining, Advances In Soft Computing, Pages: 541-545
Prufer K. Thompson A. Kennett D., 2015, Evaluating airborne LiDAR for detecting settlements and modified landscapes in disturbed tropical environments at Uxbenká, Belize, Journal of Archaeological Science, Volume 57, May 2015, Pages 1-13, https://doi.org/10.1016/j.jas.2015.02.013
Wallace L. O., Lucieer A., and Watson C. S., 2012. Assessing The Feasibility Of Uav-Based Lidar For High Resolution Forest Change Detection, The International Archives of the Photogrammetry, Remote Sensing and Spatial Information Sciences, XXXIX-B7, 499-504, doi:10.5194/isprsarchives-XXXIX-B7-499-2012
Wilinska, M., Kedzierski, M., Zaplata, R., Fryskowska, A., Delis, P., 2012. Noninvasive methods of determining historical objects deformation using TLS. Structural Analysis of historical construction, Vol.3, Wroclaw 2012, pp. 2582-2588.