TESTING DIFFERENT SURVEY TECHNIQUES TO MODEL ARCHITECTONIC
NARROW SPACES
A. Mandelli a, *, F. Fassi a, L. Perfetti a, C. Polari a
a 3D Survey Group, Politecnico di Milano, Dept. of Architecture, Built environment and Construction engineering (ABC), Italy – (alessandro.mandelli, francesco.fassi, luca.perfetti, carlo.polari)@polimi.it
Commission II, WG II/8
KEY WORDS: Laser scanner, Photogrammetry, Fish-eye, Panoramic images, SLAM (Simultaneous Localisation And Mapping), Cultural Heritage survey, Narrow spaces, Accuracy
ABSTRACT:
In the architectural survey field, there has been the spread of a vast number of automated techniques. However, it is important to underline the gap that exists between the technical specification sheet of a particular instrument and its usability, accuracy and level of automation reachable in real cases scenario, especially speaking about Cultural Heritage (CH) field.
In fact, even if the technical specifications (range, accuracy and field of view) are known for each instrument, their functioning and features are influenced by the environment, shape and materials of the object. The results depend more on how techniques are employed than the nominal specifications of the instruments. The aim of this article is to evaluate the real usability, for the 1:50 architectonic restitution scale, of common and not so common survey techniques applied to the complex scenario of dark, intricate and narrow spaces such as service areas, corridors and stairs of Milan’s cathedral indoors. Tests have shown that the quality of the results is strongly affected by side-issues like the impossibility of following the theoretical ideal methodology when survey such spaces. The tested instruments are: the laser scanner Leica C10, the GeoSLAM ZEB1, the DOT DPI 8 and two photogrammetric setups, a full frame camera with a fisheye lens and the NCTech iSTAR, a panoramic camera. Each instrument presents advantages and limits concerning both the sensors themselves and the acquisition phase.
1. INTRODUCTION
This paper research started with the need of completing the entire Milan’s Cathedral indoors survey activities. For the majority of the extension of the Cathedral, the TLS (Terrestrial Laser Scanner) Leica C10, a high-precision terrestrial TOF (Time Of Flight) laser scanner, was successfully employed, especially for the main nave, the side aisles, the transept and the apse acquisitions. The scans were acquired both from the ground and at different heights, using a crane.
Though not the fastest laser scanner nowadays on the market, this instrument was chosen knowing that the acquisition of Candoglia Marble presents some difficulties due to its inner crystalline structure, particularly when objects are too close to the scanner (Fassi et al., 2010). The resolution of the Leica C10 and its range, also allowed to obtain data far within the limit of the 1:50 restitution scale without the need of an unmanageable number of scans.
Problems started to arise when moving from the large ceremonial spaces of the church to the narrow tunnels of service spaces that branch unseen within the walls (Landes et al., 2015).
Although the accuracy and reliability of the TLS are not questionable for such an application, where the average maximum acquisition distance is contained around 20 metres; other side-issues compromise the actual usability of it. The manoeuvrability above everything else is largely reduced, until, in some cases, it could be impossible to perform the survey. And even when possible, there were some difficulties moving the scanner and placing correctly the tripod in an extremely narrow space such as the staircase one. The number of scans had to be increased to avoid lacks of data due to the tripod cone shadow; this can significantly compromise the on-paper usability of the laser scanner by making the job uselessly burdensome in terms
* Corresponding author
of time consumption. It’s necessary to use a different strategy: in the Milan’s Cathedral, tunnels, staircases, corridors and all kind of service passages entangled everywhere are the rule and not the exception. A key point in the definition of a good practice to survey these complex areas is to find the most flexible, accurate, faster and possibly cheaper instrument.
This article proposes some tests held using different types of relative low-cost instruments trying to match specific requirements. Section 2 exposes these requirements while placing some goals; the case study is then presented in section 3, the procedure of the tests and the relative results are shown in section 4 and section 5, finally, section 6 draws the conclusions as well as pointing out possible futures works.
2. TOWARD SEARCHING THE “RIGHT INSTRUMENT”
A good survey is a knowledge process, it requires the full awareness of instruments, methodologies and software for the data’s elaboration, having always clear in mind the target of the survey and the reference scale of restitution (Hassani, 2015). This paper considers the CH architectonic investigations as the operating field, consequently the representation scale chosen is 1:50. The methodology to looking for, needs at least to match the 1:50 scale requirements. Moreover, it requires to be easy to employ on field as well as during the elaboration phase and finally overall fast enough to fit a quick delivery schedule. The 1:50 scale involves a maximum “plotting error” of 1 cm and an overall intrinsic tolerance of the reconstructed 3D point cloud about 2-3 cm. On the other hand, the 3D completeness of the data is not mandatory as it is for other representative spaces, like naves. In fact, the data could be as dense as needed to trace the outlines for the two-dimensional drawings.
Another kind of problem would be a systematic lack of data instead of an occasional one. The cone shadow produced by TLSs could produce a meaningless final product if the subject of the survey is a narrow and, even worst, a spiral staircase. To avoid the cone shadow it is possible to increase the number of scans, but they would be too much to be handled.
The size of the instrument and its necessary accessories, like tripods and targets may be critical in deciding whether a survey is feasible or not. In fact, in critical conditions can be hard to place correctly the instruments, and topographic tripods can constitute obstacles to the operator mobility. Often the areas are divided in two parts confining the operator into one of them, even in the middle of a TLS acquisition.
Here is where hand-held solutions really shine, mobile mapping systems like the SLAM (Simultaneous Localization And Mapping) or portable triangulation scanners as well as close range photogrammetry can be easily carried by one person without compromising its mobility.
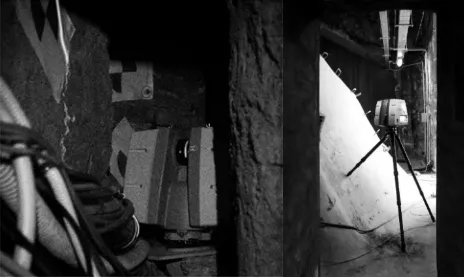
Figure 1. Laser scanner Leica C10 hardly levelled in a tunnel (left) and in the “sordine” environment (right).
3. THE TEST
The test phase was carried out directly on field, because of the peculiar characteristics of the case study. In fact, it is more useful to try the instruments in a complex environment instead of inside a calibration lab, where the conditions and the results are optimal.
3.1 Site localisation and characteristics
The selected case study has been chosen due to its variability, and so that, the possibility of evaluating different pros and cons of each tested instruments in a not homogeneous situation. The test field is located in the transept of the church, north side, it is the residual area placed between the extrados of the transept’s vaults and the intrados of the north roofs. This service space, used only for maintenance, it is spatially complex and diversified along its extension: accessible from the roofs at 50 m high from the ground. It unravels with a narrow staircase 9 m long and 90 cm wide until arriving at the level of the vaults extrados. Here a side corridor goes straight passing by three consecutive areas, the so-called “sordine”. Each of these spaces, one “sordina”, is characterised by a distribution path, about 1,2 m wide, and a much larger, but almost inaccessible area, where resides a half double-curvature vault.
While the path is easily walkable by a person, the highest portion of the vault extrados, where it meets with the intrados of the roof cover, cannot be reach. These relative large areas are connected by very small and narrow passages which constitute weak points for the registration procedure of the different instruments. This case study offers a set of different scenarios that can be found repeated in other similar service spaces; these spatial
features are such to put any survey techniques under stress. The staircase is problematic for the lack of navigation space, especially for TLSs, the vault area is problematic for the reduced accessibility, especially for hand-held solutions and the narrow connections entail a serious challenge to any instrument regarding the propagation of uncertainty. Moreover, the image-based devices are affected by the problem of texture and lighting.
Figure 2. Localisation of the “sordine” spaces, plan view (left), section (right) and a detail of the section (centre).
3.2 Reference instrument
3.2.1 TLS Leica C10: The consolidated workflow to survey vast areas inside the Cathedral contemplates the use of a high-precision terrestrial TOF (Time Of Flight) laser scanner with an integrated RGB camera, namely the C10 by Leica. It has an accuracy in position of 6 mm and 4 mm in the distance in a range between 1 m – 50 m.
Eight scans were acquired to cover the test area, three for the staircase environment, at the top, bottom and in middle extension; and two for each room except for the first smaller one. Each scan lasted 27 minutes and produced a cloud of about 55 million points with a resolution of 5 mm at 10 meters. The scans were aligned with targets obtaining a RMS error of 2 mm.
To avoid the propagation of uncertainty as well as to geo-reference the survey, a topographic net would be the ideal solution. However, the particular configuration of the “sordine” environments, makes it especially hard to be performed since a lot of free stations are required to reach the rooms of interest. The alternative solution we found provides the registration of the survey simultaneously to the previous-acquired one both from the roofs and from the indoors of the transept.
The connection to the top (roofs), were possible by the use of some topographic-measured GCPs. They have been placed, outside the entrance of the staircase and in the staircase environment itself, making sure that they could be measured by a single placement of the total-station outside the staircase. The connection with the intrados of the vaults (surveyed from the transept indoors) has been carried out in the software Leica Cyclone. It happens that the vaults present a series of cylindrical holes spread all over their extension, openings toward the church beneath, originally designed to insure air exchange. The laser scanner acquisition from the “sordine” and from the transept, were able to measure at least a portion of those small holes. It follows that was possible to compute and fit a cylinder-shaped The International Archives of the Photogrammetry, Remote Sensing and Spatial Information Sciences, Volume XLII-2/W5, 2017
mesh in most of the holes both in the “sordine” and the in transept scans.
By the use of those cylindrical objects as additional constraints, we were able to ensure a strong alignment of the laser-obtained point clouds far better than it would be with the use of only GCPs.
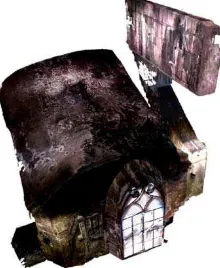
Figure 3. The C10 point cloud, about 440 million points, 13 GB.
3.3 The contenders
Each instrument presented below have advantages and limits concerning both the sensors themselves and the acquisition phase. They were pushed to their maximum possibility of acquisition using them maybe in a not ordinary way, being aware that the final metric model will be at most within the limit for the required architectural restitution scale.
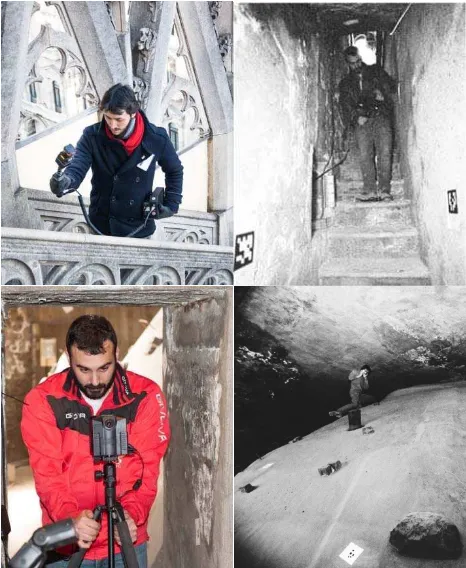
Figure 4. The ZEB1 (upper left); DOT DPI 8 (upper right); iSTAR (lower left); 8mm fisheye (lower right).
3.3.1 Geoslam ZEB1: The ZEB1 is a SLAM system, it is a fast mobile, light-weight, handled scanner able to capture over 43.000 points per second with a 270° field of view. It allows to obtain a complete survey of a complex setting in few minutes. just one person is needed to operate the ZEB1, the operator walks at normal speed through the environment carrying the ZEB1 with one hand and the batteries with the other. The sensor has to swing back and forth or left and right registering a series of different
profiles (sections) that are automatically stitched together to form a cobweb-like point cloud. It follows that the density of the data does not depend only on intrinsic parameters of the sensor, but also by the operator behaviour during the walk; as he decides to swing the ZEB1 and how long he insists on a particular area rather that another one.
Furthermore, the precision of the reconstruction is strictly correlated to the propagation of uncertainty that depends on the drift of the IMU (Inertial Measurement Unit) which is responsible of the self-localization of the instrument. It gets worse as the path followed by the operator departs from the starting point and can only be contained by following closed loops. Because of that, any acquisition must end in the same spot in which it started. In the ideal situation, in which making loops is possible, a relative accuracy of 2 cm – 3 cm can be achieved. The data, sometimes hundreds MB, must be sent via email to the elaboration centre and after some minutes it returns the elaborated point cloud without the possibility to modify it. Consequently, it is not possible to have a preview of the survey until the data come back. Moreover, the ZEB1 does not acquires any point normals and RGB information, nor either intensity unlike others range-based instruments (Sirmacek et al., 2016).
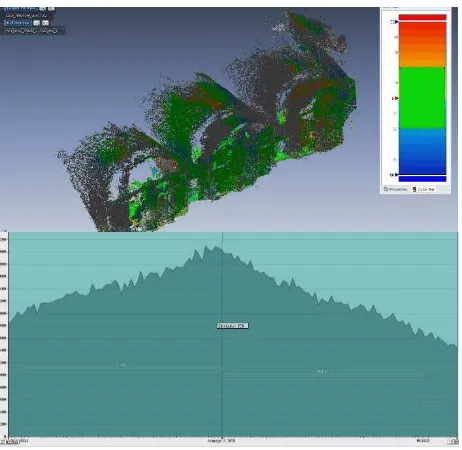
Figure 5. Orthogonal view of the ZEB1 point cloud showing the path followed during the acquisition. The details show the oscillation of the instrument, notice that it has been insisted
more on pivots to ensure a strong alignment.
In our tests the entire survey phase on fields lasted 10 minutes: it just took the time to start from the upper part of the stair, walk inside till the end of the three rooms and come back at the starting point. Due to the conformation of the space, it was not possible to make any loops during the acquisition, and therefore, it is known in advance that problems will occur in the precision of the point cloud The data were sent immediately to the elaboration centre and came back in minutes. Geoslam states that the elaboration time is equal to the time spent in the survey phase, has to noticed that this service charges a fare variable on the size of the submitted data (Geoslam, 2016).
Figure 6. The ZEB1 point cloud, 18.602.477 points, 300 MB. The International Archives of the Photogrammetry, Remote Sensing and Spatial Information Sciences, Volume XLII-2/W5, 2017
3.3.2 DOT DPI 8: The DOT DPI 8, composed by a NVIDIA SHIELD Android tablet paired with a near infrared structured light and RGB 3D depth imaging system. Its operating range spans from 0.6 m to 3.7 m, it permits a continuous control of the survey thanks to the screen, preventing the lack of data in hard-to-reach and occluded areas, since it works in real time (DotProduct, 2017) . Unlike the ZEB1, it also acquires the colour, but it is slower during the acquisition.
In this case the acquisition time was quite long due to the dimension of the rooms, the instrument requires to “brush” the surfaces to be recorded. In 6 hours it was possible to survey only the stairs and the first room. The data were ready to use without any other elaboration.
Figure 7. The DOT DPI 8 point cloud, 106.490.995 points, 18 GB.
3.3.3 NCTech iSTAR: iSTAR captures 360° spherical images (360° x 137,5° ± 5°) which covers the whole scene view in each position. This camera provides rapid, automatic HDR (High Dynamic Range) 360° imaging and can be used as a standalone device to create point clouds, especially indoors or in challenging lighting conditions. It can be used to provide HDR imagery rapidly with up to nine exposures and a total EV range of 27 f-stops. iSTAR is mounted with 4 fisheye lenses which capture larger areas from the same position in each shot compared with a standard lens. As a result, the number of images needed is reduced, saving time on site and at the processing stage. Furthermore, with fewer images required the computer resource needed is also reduced (NCTech, 2017).
The acquisition phase on the field has been rather straight forward thanks to the manoeuvrability of the iSTAR avoiding the use of artificial illumination by means of the HDR function. The entire survey has been carried out by only one operator, this was possible as a result of a series of automated utilities that the iSTAR offers. (Pérez Ramos et al., 2016)
Figure 8. The NCTech iSTAR point cloud, 17.335.313 points, 1,1 GB.
First of all, as already mentioned, the HDR function which makes it possible to rely just on natural light, in addition the auto-exposure which dynamically changes the shutter speed according to the illumination and lastly a built-in timer that gives to the operator the time to move out from the scene. Also, during the whole acquisition phase, the aid of a commercial photographic tripod allowed to easily tilt the spherical camera out of the vertical axis.
The latter has been a fundamental operation to improve the result, by tilting the camera twice in the same position, once ahead and once behind, we make sure that any portion of the scene is covered as well as that the resolution is constant across the scene. On the contrary, by placing the camera always vertical, the degradation of the resolving power of the four fisheye lenses is significant. This can reduce the accuracy or, at worst, make impossible to obtain any data in the points farthest from the optical axes, for example at the top as Barazzetti et al. (2017) shown.
During the 4 hours’ survey, 81 equirectangular images were acquired and then post processed with Agisoft Photoscan as for the fisheye set (Agisoft, 2017). The resulted point cloud is quite noisy and incomplete where the vaults reach their maximum curvature.
3.3.4 Fisheye photogrammetry: Regarding the fisheye photogrammetric survey, it was used a Canon 5D Mark III full sensor camera with an 8 mm fisheye lens, reaching a circular FOV (Field Of View) equal to 180° in each direction unlike a diagonal fisheye. It allows to limit the number of acquisitions, namely 287, and consequently save time both during the campaign and the elaboration (Troisi et al., 2017).
The survey, using fisheye photogrammetry, was carried out by two operators: the camera operator whom moved through the rooms focusing on repeating a well-defined capturing geometry, and the lights operator whom focused on carrying, placing and orienting three speed-lights to light up the environment. The whole on-field operations took 6 hours to be completed. It was crucial to distinguish among the different typologies of spaces which the operator can come across in: namely the staircase, the main room of the “sordine” and the narrow passages that connect them together. For each of these typologies a different acquisition scheme has been followed. For the staircase environment the basis capturing geometry is composed by three pictures: one pointing up from the ground and two pictures, slightly tilted following the stair slope, pointing down. Regarding the rooms, pictures were taken, mainly from the walkable corridor, pointing up, toward the vaults, toward the outside as well as down with an angle of 45° in both directions to and fro. Some other pictures were taken from a higher position climbing the ladder of the vault as far as possible.
Figure 9. The Canon 5D Mark II with 8 mmm lens point cloud, 79.373.512 points, 5 GB.
Lastly, for the connections, pictures were taken as in literature (Nocerino et al., 2014) making sure to optimize the rigidity of the reconstruction. The base distance between the pictures has been defined in relation to the usable field of view of the fisheye pictures that have to be cropped according to the desired resolution as described in (Perfetti et al. 2017).
The acquired pictures have been processed using Abobe Lightroom with the aim of enhancing the micro-contrast and the details in order to overcome the lack of texture in the floor and vaults area and therefore enhancing the number of points computable in the matching process. The resulting point cloud appears geometrically complete in any surface, shape and undercut and a high density has been reached.
4. THE COMPARISON PROCEDURE
The data were elaborated comparing them using the C10 acquisitions as a reference. The C10 scanner point clouds were aligned with the owner software Cyclone, following the traditional pipeline. The alignment was validated looking at the residuals obtained on the black and white targets. Point clouds, coming from the other two scanners and two cameras were aligned with the reference one using ICP (Iterative Closest Points) algorithm using Geomagic Design X. After that, it was measured the maximum deviation between them and the reference laser scanner point cloud (Fregonese et al., 2016).
4.1 Leica C10 vs. ZEB1
The first comparison is between the two range based instruments. The allowable deviation is set between ± 20 mm; the points in this interval are suitable for 1:50 restitution. In this case only the 75% of point are good enough; moreover, the mean of the distribution is highly shifted towards positive values. This means that, despite the best fit alignment, the ZEB1 point cloud is slightly “larger” than the C10 one.
Figure 10. Graphic and numerical deviation between scans.
4.2 Leica C10 vs. DOT DPI 8
The data set coming from DOT DPI 8 was not compared with the reference one because of some alignment errors of the original data. Even if the instruments gave good preliminary results during the survey, looking at the final data it was possible to observe a misalignment between consecutive acquisitions.
Figure 11. Misalignment of DOT DPI 8 scans. Section (left), plan (right).
Probably this behaviour is due to the low light conditions and the uniform texture and geometry of the test field. Strongly dark areas were illuminated with torches, but this was not sufficient to assure good results. This is a clear example of what is stated previously regarding the “not ordinary way” in using these instruments. Furthermore, the failure of this survey testifies the difficulties of approaching the survey in CH field and the differences between using such technologies in “real” environments.
4.3 Leica C10 vs. NCTech iSTAR
As expected the results of this evaluation are not suitable for the specific application of reaching the 1:50 restitution scale. The curve is triangular-shaped, the 70% of the values are included in the interval ± 20 mm, the majority of the data are far from the mean that is shifted towards negative values. The spiky shape of the curve is due to noise caused by the basis construction of the equirectangular projection in which may persist some distortions. A solution could be the reconstruction of the panoramic image starting from the four images using other stitching methods as in (Barazzetti et al., 2017).
Figure 12. Graphic and numerical deviation between scans.
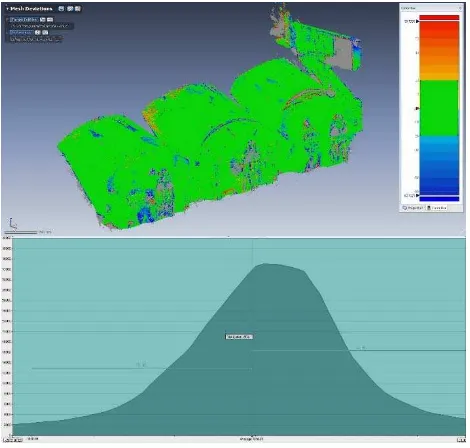
4.4 Leica C10 vs. Fisheye
The point cloud generated from the fisheye photogrammetric test can definitely be considered suitable for the 1:50 restitution scale. We can see how, visually, the deviation between the image-based cloud and the laser one shows that the majority (85%) of points are included within the limit of ± 20 mm, assumed as tolerance. The International Archives of the Photogrammetry, Remote Sensing and Spatial Information Sciences, Volume XLII-2/W5, 2017
Some areas out of this range can be found mainly on the upper parts of the vaults probably due to misalignments of some pictures caused by poor texture and dark images.
Moreover, it has to be noticed that the photogrammetric point cloud is geometrically more complete than the laser one. In particular, the staircase area has been well reconstructed in all its shapes: chiefly risers and treads, while, on the other hand, the C10 point cloud shows many lacks. With the laser scanner, a great number of new scan-station would be needed in order to obtain the same results in term of 3D completeness and, consequently, the involved time would rise as well.
This comparison clearly highlights the real potentiality of each instruments (Kuçak et al., 2016). Considering only the “sordine” areas, leaving the staircase apart, though the photogrammetric point cloud is accurate enough for the 1:50 scale, the data obtained with the TLS are clearly better. No drawbacks have been detected, not even about the manoeuvrability of laser scanner and tripods in this narrow environment. Instead, complications occurred with photogrammetry – classical ones, such as lack of illumination and texture – and others related to the use of a fisheye lens. Consequently, the authors consider the laser scanner approach far superior both in terms of precision and time consumption for the survey of the vault rooms.
On the contrary, speaking about the staircase area, the fisheye photogrammetry approach produced the best result regarding completeness, precision and time consumption. It follows that the best compromise would have been to use the range-based approach when possible – when the area is not too narrow and when the shadow cone is not an issue – and the fisheye photogrammetry only for confined and precise areas too difficult to survey otherwise.
Figure 13. Graphic and numerical deviation between point clouds.
5. RESULTS
The aim of these tests was to find the most suitable instruments for the survey of secondary and meandering spaces by investigate the current state of the art of new/growing field in survey technology, namely: SLAM systems and photogrammetry with fisheye and spherical cameras. The need has raised by understanding that TLSs are capable of reaching a precision far superior than the one that is needed is such scenarios, moreover, their usability is strongly affected by their size and weight which
both are high to make such a precision possible. The moment we decide that is not needed to go any further in accuracy than 2 cm, it is compulsory wandering whether is possible to prefer manoeuvrability and/or time efficiency rather than such a high precision.
The whole set of compared instruments we tested passed the manoeuvrability requirements. The ZEB1 happens to be the best one, while the worst (but still fine enough) was the fisheye photogrammetry approach merely because of its dependency from lights conditions. Indeed, the fisheye approach was the only one that needed two operators to be comfortably employed. Another parameter considered through these tests was the time involved to complete the survey considering both the on-field work and the post processing. Leaving the DOT DPI 8 aside, because of the clear difficulty in ending the acquisition, the most promising device is the ZEB1, even if it carries some issues regarding the absence of additional information such as the normals, intensity and the RGB components. Considering only the “large” rooms of the “sordine”, all the others instruments didn’t show any advantage respect to the laser scanner approach, chiefly, fisheye photogrammetry took many hours of manual adjust work. The “contenders” outshine the TLS is in those really extreme spaces like the staircase, where the laser scanner demonstrates its limits.
In terms of data completeness, the best point cloud obtained was the fisheye one closely followed by the ZEB1. The two clouds differ mainly for the points density whether both of them managed to completely survey the staircase area.
Finally, mainly for the exceptional ease of use, the ZEB1 slam system – while still not ready to be employed in the CH field – clearly shows its potentials (Rodríguez-Gonzálvez et al., 2017). It’s not hard to imagine future developments of this family of devices toward accurate architectonical and archaeological surveys. Until then, results have shown that the best solution does not resides into one instrument alone, but instead, in the integration of different sensors choosing them depending on the operation environment (Fassi et al., 2010). Being capable of planning precisely in advance which areas are to be surveyed with which instruments would make the whole difference concerning time efficiency and correctness of the data.
C10 ZEB1 DOT
DPI 8 iSTAR Fisheye
Time (survey) 4 h 10 min 12 h 6 h 6 h
Time (process) 1 h / / 4 h * 16 h *
Million points 440 18 106 17 80
Intensity Yes No No No No
RGB Yes No Yes Yes Yes
Weight 13 GB 300 MB 18 GB 1 GB 5 GB
Restitution scale 1:20 1:100 / 1:100 1:50
Completeness
●
●
●
●
●
Manoeuvrability
●
●
●
●
●
* The time process includes the manually check of alignment, this is a quite long mandatory task to reach high precision. A complete automated process is still not possible due to the high radial distortion of the fisheye lenses.
Table 1. Summary of the results per each instrument. The International Archives of the Photogrammetry, Remote Sensing and Spatial Information Sciences, Volume XLII-2/W5, 2017
6. CONCLUSIONS
Concluding, the tools tested are optimal for hard-to-reach places, thanks to their form factor, weight and speed. Although, nowadays, they are designed to be employed for large-scale case studies rather than architectonical one that do not require such precision. On the other hand, fisheye photogrammetry permits to combine both speed and accuracy, but more work is still to be done to speed up the elaboration process. The mobile scanner technology is developing fast to reach more and more high precision results in very short time. This is demonstrated by the fact that while the article is in writing a new version of ZEB1, called ZEB-REVO has been released; also, some other mobile mapping products, such as “mobile mapping backpacks”, are spreading on the market. Doubtless, this is the direction for the future regarding the survey technologies even in the CH field. Hence, switching from static instruments to mobile ones. Therefore, a research topic of the future would be the development of a hybrid and versatile solution composed by different kinds of sensors merged and integrated together in the same shell. Such level of versatility, may be not necessary in all the application. As we found out, the usefulness of a multi-sensors tool rises together with the growing challenging and extreme features of the environments that have to be surveyed. The first step could be to investigate the slam-backpacks already available on the market such as the Pegasus backpack by Leica and the Heron by Gexcel, even if the main problem of those tools nowadays remains their reliability; the ZEB1 is a perfect example of that. To solve the reliability issues, studies can be performed regarding the optimisation of the acquired data. It has just been undertaken the possibility of segmenting the whole acquisition into smallest ones, aiming at aligning them back together giving at the same time, more degrees of freedom and some constraints (such as spherical targets).
Summarising, one must identify time to time the best solution (what type of sensors to employ) to face different cases and also a standard method able to join and integrate the data together. A further goal to pursue is to design and assemble low-cost devices, both range- and image-based together to keep the best of each method arriving at a unified final data and, in mean time, adjust and validate it in real time.
ACKNOWLEDGEMENTS
The authors want to express their gratitude to the VFD staff, especially the Director Eng. Francesco Canali, the foreman Francesco Aquilano and the technical office, in the person of Massimiliano Regis. A great thank-you also to Nadia Guardini from ME.S.A. srl and Simone Oppici from Leica Geosystems to let us test respectively the ZEB1 and DOT DPI 8 for several days.
REFERENCES Agisoft, 2017. www.agisoft.com
DotProduct, 2017. www.dotproduct3d.com
Geoslam, 2017. www.geoslam.com
NCTech, 2017. www.nctechimaging.com
Barazzetti, L., Previtali, M., Roncoroni, F., 2017. Fisheye lenses for 3d modeling: evaluations and considerations. In: Int. Arch. Photogramm. Remote Sens. Spatial Inf. Sci., Nafplio, Greece,
Vol. XLII-2/W3, pp. 79-84, doi:10.5194/isprs-archives-XLII-2-W3-79-2017.
Fassi, F., Achille, C., Fregonese, L., Monti, C., 2010. Multiple data source for survey and modelling of very complex architecture. In: Int. Arch. Photogramm. Remote Sens. Spatial Inf. Sci., Newcastle upon Tyne, UK, Vol. XXXVIII, Part 5, pp.
234-239.
Fregonese, L., Fassi, F., Achille, C., Adami, A., Ackermann, S., Nobile, A., Giampaola, D., Carsana, V., 2016. 3D survey technologies: investigations on accuracy and usability in archaeology. The case study of the new “Municipio” underground station in Naples. Acta IMEKO, 5 (2), pp. 55-63,
doi: 10.21014/acta_imeko.v5i2.342.
Hassani, F., 2015. Documentation of cultural heritage; techniques, potentials, and constraints. In: Int. Arch. Photogramm. Remote Sens. Spatial Inf. Sci., Taipei, Taiwan, Vol.
XL-5/W7, pp. 207-214, doi:10.5194/isprsarchives-XL-5-W7-207-2015.
Kuçak, R. A., Kiliç, F., Kisa, A., 2016. Analysis of terrestrial laser scanning and photogrammetry data for documentation of historical artifacts. In: Int. Arch. Photogramm. Remote Sens. Spatial Inf. Sci., Instambu, Turkey, Vol. XLII-2/W1, pp.
155-158, doi:10.5194/isprs-archives-XLII-2-W1-155-2016.
Landes, T., Kuhnle, G., Bruna, R., 2015. 3D modeling of the Strasbourg’s Cathedral basements for interdisciplinary research and virtual visits. In: Int. Arch. Photogramm. Remote Sens. Spatial Inf. Sci., Taipei, Taiwan, Vol. XL-5/W7, pp. 263-270,
doi:10.5194/isprsarchives-XL-5-W7-263-2015.
Nocerino, E., Menna, F., Remondino, F., 2014. Accuracy of typical photogrammetric networks in cultural heritage 3D modeling projects. In: Int. Arch. Photogramm. Remote Sens. Spatial Inf. Sci., Riva del Garda, Italy, Vol. XL-5, pp. 465-472,
doi:10.5194/isprsarchives-XL-5-465-2014.
Pérez Ramos, A. Robleda Prieto, G., 2016. Only image based for the 3d metric survey of gothic structures by using frame cameras and panoramic cameras. In: Int. Arch. Photogramm. Remote Sens. Spatial Inf. Sci., Prague, Czech Republic, Vol. XLI-B5, pp. 363-370, doi:10.5194/isprs-archives-XLI-B5-363-2016.
Perfetti, L., Polari, C., Fassi, F., 2017. Fisheye photogrammetry: tests and methodologies for the survey of narrow spaces. In: Int. Arch. Photogramm. Remote Sens. Spatial Inf. Sci., Nafplio,
Greece, Vol. XLII-2/W3, pp. 573-580, doi:10.5194/isprs-archives-XLII-2-W3-573-2017.
Rodríguez-Gonzálvez, P., Fernández-Palacios, B. J., Muñoz-Nieto, A., L., Arias-Sanchez, P., Gonzalez-Aguilera, 2017. Mobile LiDAR System: new possibilities for the documentation and dissemination of large cultural heritage sites. Remote Sens.,
9(3), 189; pp. 1-17, doi:10.3390/rs9030189.
Sirmacek, B., Shen, Y., Lindenbergh, R., Zlatanova, S., Diakite, A., 2016. Comparison of Zeb1 and Leica C10 indoor laser scanning point clouds. In: ISPRS Ann. Photogramm. Remote Sens. Spatial Inf. Sci., Prague, Czech Republic, Vol. III-1, pp.
143-149, doi:10.5194/isprs-annals-III-1-143-2016.
Troisi, S., Baiocchi, V., Del Pizzo, S., Giannone, F., 2017. A prompt methodology to georeference complex hypogea environments. In: Int. Arch. Photogramm. Remote Sens. Spatial Inf. Sci., Nafplio, Greece, Vol. XLII-2/W3, pp.639-644,
doi:10.5194/isprs-archives-XLII-2-W3-639-2017.