MICROVEGA (MICRO VESSEL FOR GEODETICS APPLICATION): A MARINE
DRONE FOR THE ACQUISITION OF BATHYMETRIC DATA FOR GIS
APPLICATIONS
F. Giordanoa, G. Matteia,*, C. Parentea, F. Pelusoa, R. Santamariaa
a Dept. of Science and Technologies, University “Parthenope” Napoli (Italy)– (francesco.giordano, gaia.mattei, claudio.parente, francesco.peluso, raffaele.santamaria)@uniparthenope.it
Commission V
KEYWORDS: Marine AUSV, Open Prototype, Morpho - Bathymetric Survey, GIS application, Bathymetric data interpolation, 3D elaboration
ABSTRACT:
Bathymetric data are fundamental to produce navigational chart and sea-floor 3D models. They can be collected using different techniques and sensors on board of a variety of platforms, such as satellite, aircraft, ship and drone. The MicroVEGA drone is an Open Prototype of Autonomous Unmanned Surface Vessel (AUSV) conceived, designed and built to operate in the coastal areas (0-20 meters of depth), where a traditional boat is poorly manoeuvrable. It is equipped with a series of sensors to acquire the morpho-bathymetric high precision data. In this paper we presents the result of the first case study, a morpho-bathymetric survey carried out at Sorrento Marina Grande. This survey is a typical application case of this technology; the Open Prototype MicroVega has an interdisciplinary breath and it is going to be applied to various research fields. In future, it will expect to do new knowledge, new survey strategies and an industrial prototype in fiberglass.
1. INTRODUCTION
Bathymetry is the science of measuring and charting the depths to determine the topography of seafloor and other bodies of water; data are gathered from a variety of source, including satellite, aircraft, surface ships, submersible and underwater platforms (Kearns and Breman, 2010).
One of the most powerful instruments for bathymetric survey is the SONAR (acronym for SOund Navigation And Ranging) that uses sound to detect the seabed: emitting pulses of sounds and listening for echoes, it permits to calculate the range by multiplying the speed of sound in water and the time difference between the signals being transmitted and received. A transducer located under the ship transmits the acoustic signal through the water to the seabed and received the echoes that are reflected back. The speed of sound in water is influenced by different factors such as temperature, salinity, and density, which must be considered to prevent errors. To achieve the correct sea-bottom morphology the position and attitude of the ship are necessary, so Global Navigation Satellite Systems (GNSS) and Inertial Measurement Unit (IMU) are used.
A single beam sonar measures the bathymetry using a single sonar beam that produces a strip of measured depths in the same direction of the ship travel. It is well suited for generating seafloor profiles and is used to assist navigation in real time because permits to measure the depth immediately below the vessel.
The multi-beam sonar measures the bathymetry using an array of beams and supplies an extensive swath of measured depths perpendicular to the ship root.
Light detection and ranging (LIDAR) techniques permit to obtain accurate topographical and bathymetric maps. Terrain heights are determined by Airborne Laser Scanning that uses an infrared laser; water depths are determined by Airborne LiDAR bathymetry that uses infrared and green laser (McNair 2010). LIDAR surveys can produce 10- to 15-cm vertical accuracy at a spatial resolution greater than one elevation measurement per square meter (Klemas, 2011).
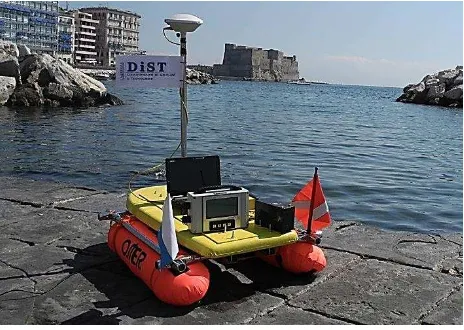
Figure 1. MicroVeGA components
Airborne LiDAR bathymetry emits a short pulse, consisting of
infrared and green lasers, to the water’s surface. The infrared pulse is scattered across the water’s surface; the green one
between the two pulses is used to determine the depth (Alsubaie, 2012).
To derive water bathymetry by satellite, attenuations of radiation into and out of the atmosphere, as well as into and out of the water column are to be considered (Bierwith et al, 1992). Radiations are differently attenuated in dependence of the wavelengths: visible bands with shorter wavelengths, such as blue, penetrate the water column deeper than a band with longer wavelength such as red (Alsubaie, 2012). The principal limit of this approach is the distribution of data per area that is linked to the geometric resolution of the satellite image: now the smaller cell size for multispectral data is 2 m for Geo-Eye and WorldView-2 (Maglione et al, 2014) and 1.20 m for WorldView-3.
Mapping shallow water bathymetry from ships by sonar is a quite an expensive task; many shallow water areas are not accessible by hydrographic ships due to rocks, coral reefs or simply the shallowness of the water); active or passive remote sensing from aircraft and/or satellites could be the tools to solve the problem (Gholamalifard e al, 2013). Because systems from aircraft are very expensive and ones from satellite are limited by the geometric resolution, in this paper Open Project Prototype MicroVeGA drone (Figure 1) is proposed to realize low coast morpho-bathyimetric surveys in critical area, where a traditional boat can not freely navigate.
2. DATA AND METHODS
2.1 Study Area and data
The first application of this new technology has been carried out during a geo-archaeological survey made in Sorrento Marina Grande (Naples, Italy), to study the evolution of the coastline over the last 2000 years.
An imperial roman villa of considerable size is present in the site. It includes a domus and a seaside villa (Mingazzini, 1946). The seaside villa is composed by a series of marine construction made of stone (Ninfeo) and wood (pavilions, bridges, terraces type bathing) and a large fishpond that is a very rare example of its kind.
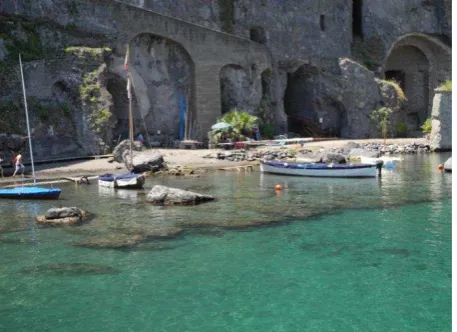
The harbour annexes, today submerged, are the shuttering in conglomerate cement, regular shaped and built at regular intervals (Figure 2). (Mingazzini, 1946).
Figure 2. Access to the sea, underwater piers and ninfeo
In this site, a bathymetric survey (Jones, 1999) through Micro VEGA drone has been realized, integrating it with direct measures by meansof graduated stadia.
Direct measures by meansof graduated stadia have carried out both in correspondence of the submerged finds, to calibrate the indirect measurements made by the echo sounder installed on the drone (Figure 3).
2.2 System Architecture
The MicroVeGA drone is an Open Project of an Autonomous Unmanned Surface Vessel (AUSV) conceived, designed and built to operate in the coastal areas (0-20 meters of depth), where a traditional boat is poorly manoeuvrable. It is an open prototype designed to test the procedures and methods of morpho-bathymetric surveys execution in critical areas, as described in this paper.
It is equipped with a set of sensors to acquire the morpho-bathymetric high precision data.
Figure 3. Direct measure by meansof graduated stadia
The drone is small and ultra-light catamaran, assembled in 30 minutes (Figure 4), with a few draught centimetres, therefore suitable to perform surveys up to the shoreline; driven by non polluting electric motors, therefore suitable to perform surveys in marine protected areas.
The MicroVega data management software has been implemented in order to interact with the GIS systems in all stages of the survey: planning, processing of the acquired data, and production of the final output.
Characteristics Measures
Overall Length 135 cm
Width 85 cm
Weight in navigation trim 14 kg
Engine 2 electric motors
Operating speed 0.5 - 2 m / s Power Autonomy 2 - 4 hours
Figure 4. Drone assembling
The architecture of the data acquisition system is structured in three blocks (Figure 5):
1. Base station, which manages the mission data by means of the TrackStar software, managed by an operator which defines the navigation routes;
2. On board computerized system that acquires and organizes the GPS, echo sounder, inertial platform, obstacle detection sensor data;
3. Communication system via data link, to connect the AUVS with the base station, allowing the mission progresses monitoring by the operator.
The data is stored on board in RAW format and teletransmitted to the base station. The transmission is in broadcasting, and then several operators can simultaneously receive in real time the measured data.
Figure 5. Architecture of the data acquisition system of the drone MicroVEGA
The instrumentation on board includes:
a) Data acquisition and transmission software (TrakStar);
b) Data transmission system; c) Onboard electronics; d) Differential GPS system; e) Single beam echo sounder;
f) Integrated system to 9 axes for attitude control.
g) Video acquisition system (both above and below sea level)
h) Anti- collision system (SIROS1)
In particular, the MicroVeGA data transmission (b), is based on two distinct wireless networks (Figure 6).
1. The first trasmits the data telemetry (position, depth, structure, atmospheric temperature, obstacle detection) from boat to the Trackstar software.
2. The second one transmits the videos of the two on board cameras to the base station. This information is managed by a specific App, to viewing the images on tablet in real time.
A microcomputer OLinuXino (c), with Linux operating system, and two high-speed serial, is dedicated to the mission management, the data recording and their wi-fi transmission to the base station.
The Arduino microcontroller (c) is dedicated to the controlling of the drone motors, the temperature measure and the manegment of the anti-collision ultrasound systems.
The GPS receiver (d), installed on board of MicroVeGA, is the
Trimble DSM ™ 232 (24-channel L1 / L2), the ideal solution for dynamic positioning tasks in the marine environment. The device configurations allow to a scalable accuracy levels enable you to choose from SBAS (Satellite Based Augmentation System), Beacon, OmniSTAR-VBS/XP/HP, and RTK (Real-Time Kinematic) differential correction sources (DSM 232 User Guide).
Figure 6. Data transmission system of MicroVeGA
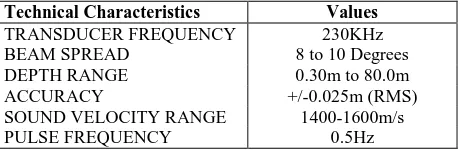
The SonarLite (Omex) is the single beam echo sounder installed on board (e). It is optimized for the bathymetric survey in coastal waters, and his trasducer is positioned vertically above the GPS receiver in order to remove same off-set.
Technical Characteristics Values
TRANSDUCER FREQUENCY 230KHz
BEAM SPREAD 8 to 10 Degrees
DEPTH RANGE 0.30m to 80.0m
ACCURACY +/-0.025m (RMS)
SOUND VELOCITY RANGE 1400-1600m/s
PULSE FREQUENCY 0.5Hz
The inertial platform used on board of MicroVeGA is Xsense MTi series G (f), a reliable device for the measurement of balace and direction (Attitude and Heading Reference System).
These corrections, stored in the survey geodatabase, allow an accurate processing of the acquired measures by the on-board instrumentation.
The G series is characterized by its lightness and reliability and represents a standard for the applications on the drone, both air and marine.
Specifications
Static accuracy (roll/pitch) < 0.5 deg
Power Consumption 350 mW
Gyro Bias Stability 20 deg/h
Timing accuracy 10 ppm
Static accuracy (heading) < 1 deg Dynamic accuracy 2 deg RMS Angular resolution 0.05 deg
Table 3. Specification of Xsense MTi series G inertial platform
Two GO PRO HERO 3 cameras are installed on board, one emerged and submerged another (g). The cameras make a video recording during the whole survey, allowing the operator to check for the environmental conditions and to control in real-time the obstacles presence.
Finally, the anti-collision system (h) is equipped with an ultrasonic sensor and an Arduino Mega microcomputer. The system checks for potential emerged obstacles, in a range from 5 centimeters to 4 meters from the drone bow. SIROS1 is an experimental system that allows to detect with good accuracy the presence of emerged obstacles, using same components common in robotic field.
The System is based on: an Arduino controller; an ultrasonic sensor; a servomechanism; an electronic components; a software application.
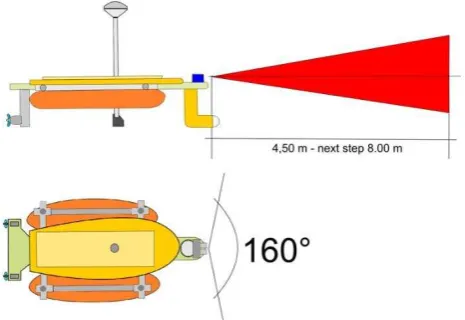
The obstacle detection system is organised so as to scan a prow sector about of 160 degrees, using a servomechanism (Figure 7).
Figure 7. Action range of anti-collition system.
The software routine implemented for the purpose, controls the Ultrasonic Sensor and moves the azimuth of the same sensor in steps of 5 degrees, by the servomechanism. The data is sent to
the base station and displayed on the mission software Trackstar, permitting the appropriate course changes.
In case of critical alarm, the software stops the motors automatically.This feature, along with the camera's surface, is very useful in the presence of not marked on the cartography trigger pulse to the sensor, and then another input pin to receive the pulse indicating the objects distance.
Ultrasonic sensor module Description
Working Voltage 5V(DC)
Static current Less than 2mA. Output signal Electric frequency signal, high
level 5V, low level 0V Sensor angle Not more than 15 degrees. Detection distance 2cm-450cm.
High precision Up to 0.2cm
Input trigger signal 10us TTL impulse Echo signal output TTL PWL signal Mode of connection 1.VCC 2.trig(T) 3.echo(R)
4.OUT 5.GND Use method Supply module with 5V, the
output will be 5V while obstacle in range, or 0V if not. The out pin of this module is used as a switching output when anti-theft
module, and without the feet when ranging modules.
Table 4. Table of HY-SR05 Ultrasonic sensor module description
Since the detection distance is also a function of the air temperature, the anti-collision system was equipped with a temperature sensor (LM35) that allows to compensate temperature variations with accuracy +/- 0.5 ° C, thus providing the correct value distance between sensor and obstacle and making the anti-collision system more efficient.
� = 33 ,3��+ ,6 6 �� (1)
where: v= sound velocity in the air
331,5 m/s = the sound velocity at 0°C
Ti = Air temperature value in a specified measure time
V1 Table 5. Comparison table between the distance measurement at
the standard temperature of 20 ° C (columns V1 and D1), and the distance measure at the actual temperature (columns V2 (t)
and D2). The column dD shows the difference between D1 (distance measured at the standard temperature) and D2
(distance measured at the actual temperature).
Table 5 shows how the variation of the temperature influence on the measured values.
In the next step, it will install a sensor with an extended range to 8m.
2.3 Data Acquisition and Software
The data acquisition software used during the bathymetric survey in Sorrento was the TrackStar mission software. The TrackStar is an application that manages the data acquisition (position, depth and balance). Our research group carried out this software to manage the survey activities and to create automatically a measures geodatabase.
The software captures and calculates in real time (Figure 9): - the measured depth and GPS location;
- the route followed;
- the route to follow to get to the endpoint of the navigation line;
- the deviation in meters of the vessel from the line planned;
- the supposed time of arrival at the end of line.
Figure 9. Trackstar Desktop
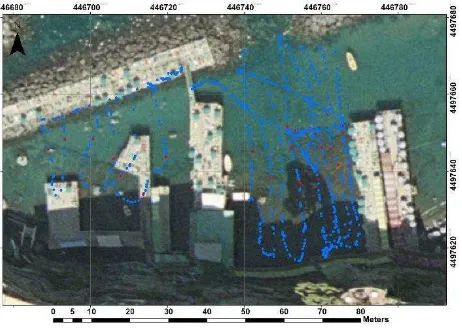
The navigation of the bathymetric survey (Figure 10) had a linear development about of 500m, with a distance between the navigation lines about of 2m.
In Figure 10, the red points highlights the fix making during the survey and indicating the submerged archaeological remains localized.
Figure 10. Navigation lines of bathymetric survey, in blue and position of submerged remains in red
2.4 Elaboration of Bathymetric Data
MicroVeGA has been designed in order to interact with the GIS systems in all survey phases: the planning, the data processing, and the production of the final output (Giordano, 2010).
2.4.1 Survey Phases: The planning phase is necessary for a rational organization of the survey, as well as for a preliminary study of the area from an environmental perspective. The GIS layers created in this phase were:
- cartography of the area (Marina Grande in Sorrento), with appropriate coordinate system (UTM - WGS84);
- layer of navigation lines, spaced two meters;
- layer of the base station position, located on the bathhouse wooden structure (Bagni Salvatore);
- layers of the interesting environmental information, such as the position of the finds submerged identified from aerial photos.
The post-processing phase allows to analyzing in detail the survey data within a single GIS project. In this phase the correction (respect to the tidal level and atmospheric pressure) of bathymetric measures has been realized, utilizing the methodologies described below (paragraph 2.4.2). The GIS layers were:
order to transform the point measurements in continuous measurements.
The outputs were:
- isolines of equal depth (isobaths) - typical processing used to produce a bathymetric map of the area (Figure 11); - seabed DTM - to reconstruct the seabed morphology
(Figure 12);
- points measurement of archaeological remains submersion (Figure 12).
If necessary, additional processing, to perform specific environmental studies, may be carried out as the calculation of the slope for the evaluation of the risk of coastal erosion.
Figure 11. Bathymetric map of the study area (UTM - WGS84 zone 33N)
Figure 12. 2D visualization of bathymetric DEM and submersion measures of archaeological remains by means of
SBES
2.4.2 Correction of bathymetric measures: In order to perform the depth corrections of the bathymetric data and archaeological findings (amount of submersion) was applied the methodology described by LEONI and DAIPRA 1997.
� = � + ℎ�+ ∆ℎ� (2)
where q = correct depth compared to the average sea level (m)
Q = survey measure (SBES or graduated stadia) (m) hi = tidal level at the time of measure (m)
∆hp = barometric correction (m)
In particular, the tidal height hi is calculated by mean of a linear
interpolation between the tidal height values of the two ports nearest to the site in question, in function of the relative distances.
2.4.3 Interpolation method of bathymetric data: Inverse distance weighted (IDW) is one of the simplest and most readily available methods for interpolation; it is based on an assumption that the value at an unsampled point can be approximated as a weighted average of values at points within a certain cut-off distance, or from a given number of the closest points (Mitas and Mitasova, 1999).
The weight is a function of inverse distance and the surface being interpolated should be that of a locationally dependent variable; in other terms this method assumes that the variable being mapped decreases in influence with distance from its sampled location (ARCGIS 10.1, 2012).
Weights assigned to data are assumed proportional to a power of distance (Watson 1992). As the power increases, the grid node value approaches the value of the nearest point; for a smaller power, the weights are more evenly distributed among the neighboring data points (Chin-Shung Yang et al, 2004). The method performs as an exact interpolator. To calculate the height in a grid node, the weight assigned to each data point is a fraction and the sum of all the weights is equal to 1.0. When a grid node is coincident with a particular observation, the distance between the grid node and that observation is 0.0; a weight of 1.0 is assigned to that observation; weights of 0.0 are given to all other observations. For consequence the grid node is assigned the value of the coincident observation (Surfer 8.0, 2002).
3. RESULTS AND DISCUSSIONS
The Marina Grande Sorrento bathymetric survey was carried out to evaluate the maneuverability and the measure precision of the MicroVeGA drone.
The use of the drone in the study area is a typical case in which this marine technology allows to realize a bathymetric survey also in presence of natural and anthropic obstacles, as the outcropping rocks or cliffs and piers.
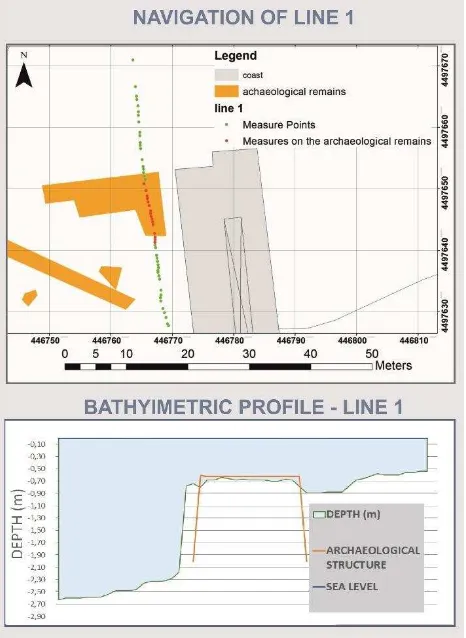
Furthermore, the very small navigation interline permitted the reconstruction of the archaeological remains topographic profile (Figure 13) and then the submersion measure of this objects (Table 6).
In addition, a wide photographic documentation has been collected during the whole mission, in order to characterize the marine environment.
With regard to the data processing, a GIS application has been specifically developed in this research, in order to manage all survey phases, as well as to apply the powerful tools of spatial analysis, present in ARCGIS, to the data processing.
The main results of processing data were:
Topographic profile topographic profiles along the lines of navigation (Figure 12);
ID Time Marker SBES Corrected
Measure
1 11:28 quay A -0,9
2 11:33 quay B -1,04
3 11:34 pier C -1,01
4 11:35 quay D -1,02
9 12:14 quay F -0,6
10 12:14 quay H -0,77
11 12:16 quay G -0,77
12 12:17 quay I -0,79
13 12:40 fishponds -0,74
Table 6. Table of archaeological remains submersion: ID column is a univocal counter; Time is precise hour of measure;
Marker is the archaeological remain abbreviation; SEBES corrected measure is the Echo sounder the recorded data corrected by means of the methodology described in 2.4.2
paragraph.
Figure 13. Navigation of Line 1 in the upper part, and bathymetric profile in the lower part
4. CONCLUSIONS
MicroVEGA is an Open Prototype platform made to experiment same methods of morpho-bathymetric survey in coastal areas difficult to access by boat, as well as to test the performance of individual components installed on board.
This project has an interdisciplinary breath and it is going to be applied to various research fields.
The operational areas of this project are manifold: To make bathymetric surveys in critical areas; To test satellite methods, to extract the bathymetry
from multispectral data;
To perform 3D spatial analysis to study the coastal erosion or other environmental hazards, such as the monitoring of riverbeds in order to prevent flooding; To realize underwater archaeological surveys to study
the evolution of the coastal landscape.
In the second phase of this project, the experience obtained during the current development phase will be used to providing a low cost method aimed at realizing morpho - bathymetric surveys in critical areas. In future, it will expect to do new knowledge, new survey strategies and an industrial prototype in fiberglass.
ACKNOWLEDGEMENTS
This paper synthesizes results of works performed within the project PRIN 2010-11 financed by MIUR (Ministero
dell’Istruzione, dell’Università e della Ricerca) and developed at the University of Naples “Parthenope” (Coordinator: Prof.
Raffaele Santamaria).
REFERENCES
ArcGIS 10.1 (2012), Help documents, ESRI.
Alsubaie, N.M., 2012. The Potential of Using Worldview-2 Imagery for Shallow Water Depth Mapping, thesis, Department of Geomatics Engineering, Calgary, Alberta.
Bierwith, P. N., Lee, T., and Burne, R. V., 1992. Shallow sea-floor reflectance and water depthderived by unmixing multispectral imagery. The First Thematic Conference on RemoteSensing for Marine and Coastal Environments. New Orleans, Louisiana, 8.
Gholamalifard , M., Kutser, T., Esmaili-Sari, A., Abkar, A. A, and Naimi, B., 2013. Remotely Sensed Empirical Modeling of Bathymetry in the Southeastern Caspian Sea, Remote Sens., 5, pp. 2746-2762.
Giordano, F., 2010. Metodi Geofisici per l’Archeologia
Subacquea. ISBN 978-88-89821-72-5, Ed. Gaia, p. 1-80. Jones, E,J.W., 1999. Marine Geophysics. Wiley, Baffins Lane, Chichester, England.
Klemas, V., 2001. Beach profiling and LIDAR bathymetry: an overview with case studies. Journal of Coastal Research, 27.6, pp.1019-1028.
Leoni, G., Dai Pra, G., 1997. Variazioni del livello del mare nel tardo olocene (ultimi 2500 anni) lungo la costa del Lazio in base ad indicatori geo-archeologici. Interazioni fra neotettonica, eustatismo e clima. ENEA, Dipartimento Ambiente, Centro Ricerche Casaccia, Roma, RT/AMB/97/8.
Maglione, P., Parente, C., Vallario, A., 2014. Coastline extraction using high resolution WorldView-2 satellite imagery, European Journal of Remote Sensing, 47: pp. 685-699. McNair, G., 2010. Coastal Zone Mapping with Airborne LiDAR Bathymetry. Department of Mathematical Sciences and Technology, Norwegian University of Life Sciences.
Mingazzini, P., 1946. Forma Italiae: Latium et Campania. Surrentum, Vol. 2. De Luca Ed.
Mitas, L., Mitasova, H. (1999). Spatial interpolation. Geographical information systems: principles, techniques, management and applications, 1, 481-492.
Surfer 8.0 (2002), User’s guide, Golden software.
Watson D F 1992 Contouring: a guide to the analysis and display of spatial data. Oxford, Pergamon.