L
Journal of Experimental Marine Biology and Ecology 242 (1999) 21–39
www.elsevier.nl / locate / jembe
Macrofaunal associations with seagrass epiphytes
Relative importance of trophic and structural characteristics
*
Paul A.X. Bologna , Kenneth L. Heck Jr.
University of South Alabama, Department of Marine Science, Dauphin Island Sea Lab, Dauphin Island, AL36528, USA
Received 9 June 1998; received in revised form 28 May 1999; accepted 28 June 1999
Abstract
Attached epiphytes often make important contributions to total primary production in seagrass meadows. Additionally, they may increase the spatial complexity of seagrass habitats. Experiments conducted using artificial seagrass units (ASU) manipulated both epiphytic structure and epiphytic food resources. Previous work suggested that the increase in faunal density associated with epiphytes was related to increases in structure, but our results indicate that the primary impact of epiphytes lies in their trophic role. Data showed that epifaunal density was significantly greater in
22
conditioned ASUs fouled with a live community of epiphytes (12 285 individuals m ) compared 22
to ASUs with artificially created epiphytic structure (5099 inds. m ) and to control ASUs (5955 22
inds. m ). This response to epiphytic trophic resources was significant for most herbivore / omnivore taxa, but not necessarily for filter feeding or predatory epifauna. However, densities of two predatory taxa (fish and mud crabs) were significantly greater where epiphytic biomass was higher, which may reflect their response to increased prey abundance. Additionally, ASUs conditioned with live epiphytes had greater taxa richness than other ASUs. Epiphytic structure appeared to play only a limited role in determining the density of most mobile epifauna, but epiphytic structure appeared to be important in augmenting the settlement of bivalves. By using ASUs we were able to control aspects of blade length and shoot density, but the pre-experiment conditioning of treatments fouled with live epiphytes may have played a role in determining absolute differences in macrofaunal density among ASU treatments. Overall, our work suggests that the trophic role of epiphytes can have a dramatic impact on associated epifaunal communities, although future investigations are needed to assess this relationship more fully. 1999 Elsevier Science B.V. All rights reserved.
Keywords: Artificial seagrass unit; Epifauna; Epiphyte; Gulf of Mexico; Seagrass; Thalassia testudinum
*Corresponding author. Current address: Rutgers University Field Marine Station, 800 Great Bay Blvd. c / o 132 Great Bay Blvd., Tuckerton, NJ 08087, USA. Tel.: 11-609-296-5260 x255; fax: 11-609-296-1024. E-mail address: [email protected] (P.A.X. Bologna)
1. Introduction
Seagrass phototrophic epiphytes principally consist of cyanobacteria, diatoms, crus-tose and ephemeral algae (Ballantine and Humm, 1975; Thursby and Davis, 1984; Novak, 1984). Although a great deal of research has assessed seagrass primary production (Phillips, 1974; Wium-Andersen and Borum, 1984), epiphytic primary production has often been considered low and relatively unimportant due to their low biomass (Penhale, 1977; Borum et al., 1984). However, recent studies in seagrass meadows have shown that epiphytic primary production may often exceed seagrass production in both weight specific (g Carbon / g chlorophyll a, Pollard and Kogure,
22 21
1993) and total annual production (g Carbon m year , Morgan and Kitting, 1984; Moncreiff et al., 1992). In these habitats the seagrasses themselves are not thought to be preferred food, due to their low nitrogen content (Koike et al., 1987), high cellulose content, and presence of phenolics (McMillan et al., 1980), and it has been suggested that seagrasses are usually only consumed to any significant extent by large vertebrate herbivores (Thayer et al., 1984, but see Camp et al., 1973; Valentine and Heck, 1991). Many small herbivores, however, appear to rely upon associated algae for their nutritional needs (Kristensen, 1972, see Kikuchi and Peres, 1977; van Montfrans et al., 1984; Kitting, 1984; Nielsen and Lethbridge, 1989; Klumpp et al., 1992; Conlan, 1994; Alcoverro et al., 1996; Jernakoff et al., 1996; Jernakoff and Nielsen, 1997).
Seagrass epiphytes, both floral and faunal, can increase structural complexity (Heijs, 1987; Schneider and Mann, 1991b). However, little research has addressed the structural role of seagrass epiphytes (but see Hall and Bell, 1988). The increase in habitat heterogeneity associated with epiphytes may be important for passively settling organisms, those seeking refuge from predation and for organisms who preferentially select habitats with shelters that match their body size (Hacker and Steneck, 1990; Schneider and Mann, 1991a,b). Numerous studies involving seagrasses and supplemental structure (e.g., macroalgae) have shown that increases in habitat heterogeneity increase species richness and density of organisms (Lewis and Stoner, 1983; Stoner and Lewis, 1985; Edgar and Robertson, 1992; Martin-Smith, 1993). Because epiphytes provide additional structure to these habitats, it might be expected that the presence of epiphytes would also increase the density of organisms.
2. Methods
Work was conducted during the summer of 1994 in St. Joseph Bay, Florida, USA (298N, 85.58W). St. Joseph Bay is a shallow semienclosed lagoon with little fresh water input and salinities generally range from 22‰ to 35‰ and temperatures from 8.58C to 328C (Bologna, 1998). Extensive seagrass meadows occupy the shallows (,2 m) and are comprised of T. testudinum, Halodule wrightii, and Syringodium filiforme. T. testudinum is the dominant species and covers approximately 2300–2400 hectares in the bay (Savastano et al., 1984; Iverson and Bittaker, 1986). Research was conducted in an extensive (50 hectare), shallow sand-T. testudinum habitat mosaic (depth ,1.2 m Mean Low Water).
To assess the relative trophic and structural role of seagrass epiphytes, ASUs were constructed in the following manner: substrata were cut from 1.9 cm black VexarEmesh to which artificial seagrass shoots, made from either smooth or crimped green polyribbon (5 mm width), were tied. ASUs were circular with a radius of 124.5 mm
2 21
(0.0487 m ). Shoots were constructed with four leaves shoot and tied at densities
22 21
(|762 shoots m , mean number leaves shoot 54) and leaf heights (|30 cm) similar
to those found in natural high density T. testudinum beds (cf., Iverson and Bittaker, 1986). Three experimental treatments were used: nonmanipulated ASUs (Control), ASUs with artificially created epiphytic structure (ART), and ASUs fouled with live T. testudinum epiphytes (NAT). Nonmanipulated ASUs had leaves constructed from smooth polyribbon. ART ASUs also had leaves constructed using smooth polyribbon, but these leaves were then ‘‘stripped’’ in a haphazard manner using a coarse wood rasp which raised the surface and created small filaments (,5 mm), or separated small
2
portions of the artificial leaf creating small filamentous coils (,40 mm ). These filaments provided additional surface area (although not quantified), and mimicked ‘‘epiphytic’’ structure. NAT ASUs had leaves that were constructed of crimped polyribbon. The decision to use crimped ribbon resulted from previous attempts to establish a natural phototrophic fouling community on smooth polyribbon, which entailed long term deployment of ASUs that often resulted in severe faunal fouling (e.g. barnacles, oysters, tunicates, etc . . . ). It was found that crimped polyribbon allowed rapid colonization of algae while minimizing sessile faunal colonization. Measurements using digital vernier calipers showed that these two ribbons differed, in that each crimped ribbon was 0.12 mm thick compared to 0.1 mm for smooth, and had slight (0.01 mm depth) indentations alternating at 0.625 mm. This difference translated into an
2
additional 22.6 cm surface area for each ASU in the NAT treatments, which 2
represented an increase of 0.5% greater surface area (4440 cm for Control and ART 2
ASUs vs. 4462 cm for NAT ASU).
Based on this design, we attempted to evaluate the following predictions regarding the distribution of fauna among ASUs.
H :2 If epiphytic structure is of primary importance, faunal densities should be similar between NAT and ART ASUs, but greater than Control densities. H :3 If epiphytic trophic resources are of primary importance, then herbivore
density should be greater in NAT than in ART and Control ASUs, while nonherbivore density should be consistent among ASUs.
H :3a If total trophic resources are of primary importance, then density of herbivores and predators should be greater in NAT ASUs, but lower and similar in both ART and Control ASUs (i.e., if herbivore prey abundance is high, then predator abundance should be high also).
H :4 If epiphytic food and structure are both important, then faunal density should follow a gradient from high to low as follows: NAT (food and structure).ART (structure).Control.
Ten spatial replicates of experimental treatments were deployed randomly within a 3310 matrix in an unvegetated region of the T. testudinum mosaic. ASUs were placed in the grid at a spacing interval of 5 m. Consequently, each ASU was 5 m from an adjacent ASU in the matrix, and greater than 7 m from existing T. testudinum beds. NAT ASUs were deployed in the field for 2 weeks before the start of the experiment. Before placement into the experimental array, NAT ASUs were rinsed and held in fresh water for 5 min to insure removal of all fauna (Edgar, 1992). All experimental ASUs were buried to cover the VexarE mesh and anchored using 16 gauge wire. Experimental ASUs were allowed to undergo colonization / recruitment for 4 weeks, at which point (July 27, 1994) ASU samples were collected using a gasoline powered suction sampler (cf. Orth and van Montfrans, 1987). ASUs were sampled sequentially in the matrix by visually locating each ASU and then vacuuming only the area occupied by the ASU until the mesh base was exposed. Two Control replicates were lost to storm events during the experiment.
Collected samples were sieved to retain organisms .500 mm, preserved in 10% formalin and stored in 50% isopropanol. Organisms were identified to lowest possible taxa, enumerated, and categorically placed into groups representing feeding mode (e.g., herbivore / omnivore, nonherbivore) and habitat requirements (e.g., epifaunal, infaunal, sessile). Identification and classification of taxa were accomplished using Gosner (1971, 1978), Bousfield (1973), Fauchald and Jumars (1979), Williams (1984), Robins and Ray (1986), Kensley and Schotte (1989), Andrews (1994), Rehder (1995), and Abbott and Morris (1995). Only motile taxa that were strictly associated with the seagrass leaves and canopy were used in analyses. Due to the time required to process samples comprised of high abundance and species diversity, most taxa were identified to the family level. Six replicate samples were taken in T. testudinum to compare species richness, density, and biomass between experimental treatments and natural seagrass beds. T. testudinum was sampled by randomly placing a polyvinyl chloride cylinder 1.2
2
m high and 0.073 m in area (15.24 cm radius) within the bed. The cylinder was then drained using a suction sampler and all macrofauna were retained, preserved, and processed as above.
h), ashed for 8 h at 5008C and reweighed to determine ash free dry weight (AFDW) per individual. Experiments were analyzed using one-way analysis of variance (ANOVA) with treatment as an independent categorical factor and density, biomass, and species richness as separate dependent variables. Square-root transformations of count data were completed before analysis. Multiple comparisons among treatments used Fishers Least Significant Difference (a 50.05) to determine significant differences.
Upon termination of the experiment, but before sampling began, six leaves from two replicates of each treatment were collected to assess degree of epiphytic fouling. Leaves were transported to the laboratory where epiphyte composition, percent cover, and biomass (AFDW) were estimated. Epiphyte functional groups (sensu Steneck and Dethier, 1994) and percent cover were estimated using a point-intercept grid (square54 mm34 mm). Leaves were then scraped with a razor blade and the epiphytic algal component was dried at 808C for 72 h and ashed at 5008C for 6 h. This eliminated weight bias associated with calcium carbonate from coralline algae. Epiphyte load was
22
then calculated as mg AFDW cm surface area, to standardize for leaf area sampled. Epiphyte percent cover and biomass were also estimated from 137 T. testudinum leaves gathered from nearby, large continuous grass beds on July 18, 1994 (K. Heck, unpub. data) and compared with experimental treatments. Square-root transformed epiphyte load was analyzed using a one-way ANOVA with treatment as the independent categorical variable. Mean biomass among treatments was compared using a Scheffe F-test (a 50.05).
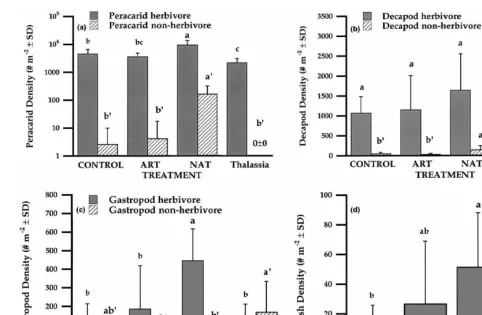
Fig. 1. Schematic representation of epiphytic structural units. Length, height, and lateral extent are expressed in mm.
3. Results
3.1. Epiphyte fouling
Naturally fouled experimental ASUs (NAT) that used crimped polyribbon had greater coverage and biomass of epiphytes (Table 1, Fig. 2). These data showed that greater than 85% of the surface area for NAT ASUs was covered by epiphytes (although not quantified, much of the free space for all experimental ASUs and T. testudinum was probably also covered by bacteria and diatoms, see Ballantine and Humm, 1975; Novak, 1984). Additionally, filamentous algae were more abundant on NAT ASUs than either Control or ART ASUs and samples from T. testudinum. This difference in epiphytic
22
cover translated into significantly greater epiphyte biomass (mg AFDW cm ) on NAT treatments than Control or ART treatments (F3,558.08, P,0.023; Fig. 2). There was approximately twice the epiphytic biomass on NAT treatments (60.9862.98mg AFDW
22
cm , x6SD) and samples from T. testudinum (73.8620.29) than on Controls (29.8365.05) or ART treatments (35.6961.78). The high biomass associated with T. testudinum may have been a result of diatom biomass, since percent cover of
Table 1
Percent cover of identified epiphytes on experimental treatment leaves; percent filamentous refer to the presence of both filamentous and branching filamentous algae (see Steneck and Dethier, 1994)
Treatment % Clean % Crustose coralline % Filamentous % Miscellaneous
Control 57.205 36.67 6.01 0.115
ART 44.885 35.45 19.38 0.285
NAT 14.385 56.375 28.955 0.275
Fig. 2. Algal biomass on artificial leaves of experimental treatments and on leaves from T. testudinum. Differing letters indicate significant difference among means (a 50.05).
filamentous algae was low, but also may reflect the potential addition of T. testudinum biomass in this estimate. Unlike artificial blades, the scraping procedure used to assess epiphyte biomass on T. testudinum may have removed some live grass tissue, thus biasing the biomass data. Since this was not possible for artificial blades, this may account for the differences between low epiphyte percent cover and high biomass seen in T. testudinum data.
3.2. Structural comparison of artificial epiphytes
When the epiphytic structural components were analyzed, T. testudinum leaves contained more structural units per unit area than ART treatments. ART ASUs had fewer filamentous and branching units compared to epiphytes on T. testudinum, but mean filament length and branch area on ART ASUs were greater (Table 2). This was due, in part, to the abundance of small (1 mm31 mm) algal tufts on T. testudinum leaves (see Fig. 1). The opposing differences in branch density and branch area produced similar mean branching area per unit surface area of blade (Table 2). Although differences in density of epiphyte structural units existed between initial ART ASUs and T. testudinum,
22
the similarities in density of filaments cm (which comprised 70–80% of structural
22
Table 2
Comparison of epiphytic structural units between epiphytes on T. testudinum and artificially created epiphytes associated with ART ASUs; values represent means6SD
Structural component T. testudinum epiphytes Artificial epiphytes (ART)
22
No. structural units cm 1.2861.25 0.67760.24
22
No. filaments cm 0.77960.833 0.55860.226
22
No. branches cm 0.49860.461 0.11960.033
Percent filamentous 0.8136.0.062 0.6860.251
Percent branching 0.18760.062 0.3260.251
*
Mean filament length (mm) 1.38660.707 2.43960.644
2
*
Mean branch area (mm ) 1.7261.33 18.95617.5
2 22
Mean branch area per unit surface area (mm cm ) 1.15361.148 2.5462.787
* Indicates significant differences between means (a 50.05).
ASUs was not assessed upon termination of the experiment, because these leaves were used to estimate percent cover and algal biomass. This was also the case for ART and Control ASUs. Based on the data from percent cover and algal biomass, results suggest that epiphytic structure may have been similar between NAT ASUs and T. testudinum, but definitive evidence is lacking. However, the high percent cover of filamentous algae associated with NAT ASUs suggests that epiphyte structural complexity may have been highest in this treatment. Although all possible comparisons of epiphyte structure among T. testudinum, and ASUs were not completed, the similarity in structural units and mean branch area between ART ASU and T. testudinum (Table 2) and similarity in biomass between NAT ASUs and T. testudinum (Table 1, Fig. 2) suggests that overall epiphytic structure among these treatments was similar.
3.3. Community response
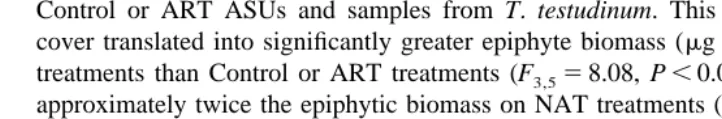
A total of 186 taxa was identified from samples, including representatives from 45 orders in nine phyla. However, only 76 taxa, identified as potential canopy fauna, were used for comparative analyses. Taxa richness was greater in NAT ASUs and T.
testudinum compared to Control and ART ASUs (F3,30529.4, P,0.0001; Fig. 3a).
Fig. 3. Community response to experimental epiphyte treatments. (a) Comparison of taxa richness among experimental treatments and T. testudinum. Differing letters above treatments indicate significant differences among means (a 50.05). (b) Total herbivore and nonherbivore density among ASUs and T. testudinum. Values
22
3.4. Faunal response
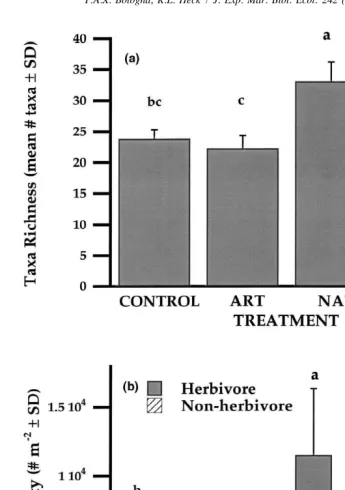
Four major taxonomic groups were identified by relative abundance and biomass in the suite of 76 canopy fauna, pooled for analysis, and include: Peracarida (74.3% total identified), Decapoda (17%), Gastropoda (the ‘‘group’’ Gastropoda also includes members of the Polyplacophora, because of their functional similarities, 4.7%), and Osteichthyes (0.3%). The density of the dominant members of each group are presented in Table 3 for comparison. In most cases, taxa density was greatest in NAT ASUs
Table 3
Taxa density comparison among ASU treatments and T. testudinum; values presented are mean (number
22
m )6SD
ASU Treatment Trophic mode P Control ART NAT T. testudinum
Gastropoda
Mitrella lunata h * 115.5679.1 152.06231.5 342.26156.2 43.4642.8 Crepidula spp. f ns 59.0641.7 37.0627.0 53.4633.8 159.86167.9 Modulus modulus h ** 7.7610.6 6.269.9 50.2646.5 11.4610.3 Chitonidae h *** 2.667.3 0.060.0 47.2633.6 13.7622.9 Diastoma varium h ns 0.060.0 6.269.9 13.7614.4 11.4613.5 Cerithium muscarum h ns 0.060.0 8.2614.4 9.1619.8 4.6611.2 Rissoina bryerea? h ns 2.667.3 8.2614.4 6.8610.6 9.1616.6 Mitrella ocellata h ns 2.667.3 4.168.7 4.668.7 060 Epitoniidae ep ns 2.667.3 0.060.0 6.269.9 16.0616.0
Peracarida
Aoridae h *** 2464.161401.6 1441.56624.5 609462810.3 1141.66581 Cymadusa spp. h *** 782.96402.0 932.26404.5 175.76157.9 66.2643.7 Amphithoidae h ns 369.66265.9 199.26120.9 397.06309.3 4.667.1 Sphaeromatidae h * 202.86157.3 154.06107.0 447.26371.9 114.2651.7 Caprellidae h ns 143.7680.7 197.16117.4 246.46207.2 10.065.4 Melitidae h *** 59.0677.2 49.3646.6 413.06198.4 184.96117.4 Oedicerotidae h * 77.0636.0 69.8650.5 212.26268.5 41.1636.8 Pleustidae h ns 97.5623.9 61.6638.7 164.3692.4 315.16180.5 Lilljeborgiidae h *** 10.3615.5 8.2610.6 228.26189.2 060 Lysianassidae p *** 2.667.3 4.1613.0 134.66155.1 060 Erichsonella spp. h ns 10.3611.0 4.1613.0 82.1688.2 4.667.1
Decapoda
Caridea h ns 764.96405.0 932.26814.4 1104.36673 246.6690 Paguroidea h * 290.0676.4 205.4678.6 470.26312.5 157.5651.1 Portunidae p ns 35.9630.6 24.6628.7 38.8640.8 2.365.6 Xanthidae p *** 7.7610.6 2.166.5 70.7686.7 11.4628 Majidae h ** 7.7610.6 6.269.9 41.1640.8 11.4616
Osteichthyes
Gobiosoma bosc p ns 7.7610.6 22.6640.4 29.7636.3 6.8611.5 Syngnathus spp. p ns 2.667.3 2.166.5 4.168.7 060 Chasmodes saburrae p ns 0.060.0 0.060.0 9.1610.6 060 Opsanus spp. p ns 0.060.0 0.060.0 4.668.7 060
* ** ***
.X
.
Bologna
,
K
.L
.
Heck
/
J.
Exp
.
Mar
.
Biol
.
Ecol
.
242
(1999
)
21
–
39
31
22
(exception: nonherbivore Gastropoda densities were greater in T. testudinum and Control ASUs). The density of both herbivorous and nonherbivorous epifaunal Peracarida was significantly greater in NAT compared to other ASUs and samples gathered in T.
testudinum (F3,30512.7, P,0.001 herbivores, F512.8, P,0.001 nonherbivores; Fig.
4a). Additionally, when the most abundant Peracarida families were analyzed separately among ASU treatments, most showed greater densities in NAT ASUs when compared to Control and ART ASUs (Table 3). Only Cymadusa spp. (Amphithoidae) showed significantly greater densities in Control and ART ASUs when compared to NAT ASUs (F2,25514.7, P,0.0001). However, no Peracarida showed significant responses to changes in epiphyte structure associated with ART ASUs (i.e., ART5NAT4
Control).
Decapoda densities varied significantly between ASU treatments and samples collected from T. testudinum. Specifically, decapod herbivore density was greater in ASUs than T. testudinum (F3,3055.2, P,0.005), but density did not differ significantly among ASUs (Fig. 4b). However, both Paguroidea and Majidae showed significantly greater densities in NAT than in ART or Control ASUs (Table 3). Additionally, nonherbivore Decapoda density was significantly greater in NAT ASUs compared to other ASUs and T. testudinum (F510.5, P,0.0001) and this response was primarily due to Xanthidae, but not Portunidae (see Table 3).
Herbivorous Gastropoda, primarily Mitrella lunata, Modulus modulus, and Chitonidae, were significantly greater in NAT ASUs than in other ASUs and T.
testudinum (F3,3057.17, P,0.001). However, nonherbivorous gastropod density was
greater in samples collected in T. testudinum than in ASUs (F3,3053.19, P,0.05), although densities did not differ significantly among ASU treatments (Fig. 4c, Table 3). Fish density was also significantly greater in NAT ASUs than in Control ASUs or T.
testudinum (F3,3053.2, P,0.036; Fig. 4d).
Although bivalves were not considered in the above analyses because they are not motile epifauna, they did provide a post-hoc opportunity to assess the structural impacts of epiphytes on recruiting organisms. Specifically, Mytilidae and Argopecten irradians are known to use seagrass leaves as initial settlement sites (Bayne, 1964; Eckman, 1987; Newell et al., 1991), and their density distributions were analyzed among treatments. Bivalves settled in significantly higher densities in NAT ASUs (2704.361451.8) and T.
testudinum (1054.86626.7) compared to ART (457.96553.2) and Control
(182.26100.9) ASUs (F3,30516.75, P,0.0001).
4. Discussion
and Caprellidae showed greater densities in ART over Control ASUs (albeit nonsignific-ant), and they appear to be the only taxa collected in this study that may be associated with both the structure and trophic resources of epiphytes. These results suggest that the structure of seagrass blades may be adequate refuge from predation for macrofauna and that minor increases in structure associated with epiphytes provide no additional refuge value. Therefore, either taxa did not respond to the experimental manipulations, the level of taxonomy could not distinguish faunal epiphytic structural preferences, or epiphytic structure plays only a limited role for larger mobile seagrass fauna (e.g., vs. meiofauna, Hall and Bell, 1988).
Crustaceans and gastropods often constitute the greatest density of seagrass epifauna (Fig. 4a–c), and discerning the cause of their distributional patterns is essential in understanding how secondary production is regulated in seagrass habitats (Howard, 1981; Kitting, 1984; Valentine and Heck, 1993). When seagrass epiphytes were abundant on NAT ASUs, we found that the densities of small grazers (primarily crustaceans and gastropods) were significantly greater (based on 55 identified / suspected herbivore / omnivore taxa, Fig. 3b, Table 3). If herbivores were merely attracted to increases in surface area or structure, then both ART and NAT ASUs should have had similar densities; or minimally, ART ASUs should have had greater densities than Control ASUs. That was clearly not the case for herbivores as a whole, or within taxonomic groupings, which suggests that trophic resources may be relatively more important for herbivores than the structure provided by epiphytes. However, nonherbivore density was also significantly greater in NAT compared to Control and ART ASUs (Fig. 3b). The most abundant identified nonherbivorous epifauna were either filter feeding or parasitic (Gastropoda) or predatory in nature (Peracarida, Decapoda, and Osteichthyes). When the differences in density among ASUs were assessed for separate taxonomic groups, two relatively distinct responses occurred: no response or elevated densities in NAT ASUs. Nonherbivore Gastropoda showed no significant differences in density among ASUs (Fig. 4c). This response was primarily due to the similarity in Crepidula spp. density among ASUs (Table 3). Crepidula spp. are filter feeders often associated with surfaces. Consequently, it might be expected that they would not be influenced by either structure or epiphytic trophic resources and densities were consistent with the predictions that nonherbivore taxa should show no preference among ASUs.
amphipod densities. Given the high densities of Peracarida in NAT ASUs (.8500
22
m ), Cymadusa spp. may have been competitively displaced from NAT ASUs by larger or more competitive Peracarida. Therefore, faunal densities in ASUs may be affected by trophic resource availability, competitive interactions, predation potential as well as refuge requirements.
Given the rapid colonization of patches (Virnstein and Curran, 1986) and the high turnover rates for fauna in seagrass habitats (Howard, 1985; Edgar, 1992), increased density in NAT ASUs suggests that the presence of algal food resources affects the immigration to emigration ratios for mobile herbivores. If organisms are exposing themselves to predation risk by crossing open sediment to colonize new habitats, they must either be seeking essential resources (i.e., food, mates, or habitat) or they are being competitively excluded from preferred habitats. If they are excluded from natural habitats under high density conditions, then why should epifaunal density be less in seagrass beds than in artificial seagrass habitats (Fig. 3a)? Rather, Virnstein and Curran (1986) proposed a nearest refuge hypothesis where mobile fauna must seek refuge when conditions favor visual predators. Therefore, ASUs in unvegetated regions become islands of refuge in inhospitable habitat and may concentrate individuals over a larger area. This certainly can explain the differences in density between ASUs and T. testudinum and this response is similar to results from other studies (Sogard, 1989; Bologna, 1998). The presented results suggest that when epifauna leave large continuous seagrass habitats they may seek the primary structure of artificial grass to escape being eaten. However, because Control and ART ASUs provided little nourishment for herbivores (see Fig. 2, Table 1), these same organisms must again leave to forage if they are to survive. Therefore, ASU herbivore density should be determined by the immigration (seeking food or refuge) to emigration (seeking food) ratio (see Edgar and Robertson, 1992). These data suggest that when food is available, herbivore density should increase because immigration rates would remain constant while the relative emigration rate decreases until resources are depleted (i.e., if there is food and shelter, why leave?).
these forces are integral to settlement and recruitment of bivalves and polychaetes (Snelgrove et al., 1993).
4.1. Potential effects of experimental techniques
Because the goal of this experiment was to assess the trophic versus structural role of seagrass epiphytes, experimental ASUs needed to be fouled with epiphytic algae before use. As previous attempts using smooth polyribbon to create ASUs with a natural fouling community entailed long term deployments that often resulted in severe faunal colonization (e.g. oysters, barnacles, ascidians), the trade off between using the crimped ribbon that allowed rapid floral colonization, while minimizing faunal fouling, and using identical smooth polyribbon in all experimental treatments was deemed acceptable. The creation of ASUs for experimentation was designed to tease apart the relative structural and trophic role of epiphytes and there is a clear relationship between Control and ART ASU treatments, because they were constructed of the same material and were placed in the field at the same time. Consequently, they differ only in presence of secondary structure mimicking epiphytes. However, the NAT ASUs differ from both Control and ART ASUs in several ways. First, NAT ASUs were constructed using a different ribbon, resulting in differences in initial surface area; second, NAT ASUs were placed in the field 2 weeks prior to the initiation of the experiments; and lastly, NAT ASUs were rinsed in fresh water to remove epifauna prior to initiation of the experiment. Each of these differences therefore, may have contributed to the differences in faunal density among treatments.
ASUs controlled leaf length (i.e., ASU canopy height), therefore, a small increase in surface area (0.5%) associated with crimped polyribbon occurred. Even though increases in leaf surface area have been associated with greater species richness and faunal density (Stoner, 1983; Lewis, 1984), we do not believe that a 0.5% increase in surfaced area would result in a 100% increase in faunal density (Fig. 3b). Differences in leaf morphology have been shown to influence epifaunal density (Schneider and Mann, 1991b; Kenyon et al., 1997) and this may have played a role in determining minor density differences among ASU treatments, but we believe that the differences in faunal densities and species richness are more likely attributable to the significantly greater epiphytic biomass associated with NAT ASUs (Fig. 2), and not to the minor differences between construction materials of artificial leaves.
because algal biomass was present on all ASUs (Fig. 2) and the presence of these algae represent the development of biofilms on ASUs. Additionally, if experiments were conducted for a greater length of time, fouling of epiphytes on all ASUs would have limited our ability to discern the structural versus trophic role of epiphytes. Although this may confound absolute interpretation of our results, we contend that the trophic role of epiphytes is clearly more important than their structure alone. Lastly, treatment of NAT ASUs in the water bath may have biased our results. Edgar (1992) showed that some amphipod taxa showed a positive response to a water bath treatment, dramatically increasing total epifaunal density. Consequently, the response of Peracarida taxa to NAT ASUs may be due, in part, to the exposure of NAT ASUs to the water bath treatments and not differences in food or structure. Recognizing these limitations, the data show that preconditioned NAT ASUs had the greatest density of organisms and the density differences among ASUs may be due in part to ASU construction materials, precondi-tioning and the water bath, and length of the experiment. However, we believe that the response of herbivorous taxa (Fig. 3b) clearly indicate a positive response to the presence of epiphytic food resources, while the absence of response to secondary structure associated with ART ASUs indicates that epiphytic structure may play only a limited role in determining macrofaunal densities in some seagrass communities.
5. Conclusions
In summary, this research has shown that mobile seagrass fauna respond positively to the presence of trophic resources, but not necessarily to increases in secondary structure. Although the first result may be intuitive, the lack of faunal response to epiphytic structure in the experiment was not expected, since numerous studies have shown positive faunal responses with increasing habitat heterogeneity (Stoner and Lewis, 1985) or changes in epiphytic presence (Hall and Bell, 1988; Edgar and Robertson, 1992). This suggests that epiphytic physical structure alone may have had little influence in determining the overall density patterns of mobile seagrass fauna in ASUs, although it is probable that epiphytic structure did play a role in determining the density of some fauna (Table 3). However, the striking density difference between NAT ASUs and other ASU treatments and T. testudinum provides evidence that trophic resources are extremely important. Consequently, future research should continue to address the trophic role of epiphytes and their importance in determining faunal density and secondary production.
Acknowledgements
Alabama Department of Marine Science and the Dauphin Island Sea Lab. This is contribution [312 to the Dauphin Island Sea Lab.
References
Abbott, R.T., Morris, P.A., 1995. In: A Field Guide To Shells, The Peterson Field Guide Series, Vol. 3, Houghton Mifflin, New York, p. 350.
Alcoverro, T., Duarte, C., Romero, J., 1996. The influence of herbivores on Posidonia oceanica epiphytes. Aquat. Bot. 56, 93–104.
Andrews, J., 1994. In: A Field Guide To Shells of the Florida Coast, Gulf Publishing, Houston, TX, p. 182. Ballantine, D., Humm, H.J., 1975. Benthic algae of the Anclote Estuary. I. epiphytes of seagrass leaves. Fla.
Scientist 38, 150–162.
Bayne, B., 1964. Primary and secondary settlement in Mytilus edulis L. (Mollusca). J. Anim. Ecol. 33, 513–523.
Bologna, P.A.X., 1998. The effects of seagrass habitat architecture on associated fauna. Ph.D. Dissertation, University of South Alabama, pp. 225.
Borum, J., Kaas, H., Wium-Andersen, S., 1984. Biomass variation and autotrophic production of an epiphyte–macrophyte community in a coastal Danish area: II. epiphyte species composition, biomass and production. Ophelia 23, 165–179.
Bousfield, E.L., 1973. In: Shallow-water Gammaridean Amphipoda of New England, Cornell University Press, Ithaca, NY, p. 312.
Camp, D.K., Cobb, S.P., van Breedveld, J.F., 1973. Overgrazing of seagrasses by a regular urchin, Lytechinus variegatus. Bioscience 23, 37–38.
Conlan, K.E., 1994. Amphipod crustaceans and environmental disturbance: a review. J. Nat. History 28, 519–554.
Eckman, J.E., 1987. The role of hydrodynamics in recruitment, growth, and survival of Argopecten irradians (L.) and Anomia simplex (D’Orbigny) within eelgrass meadows. J. Exp. Mar. Biol. Ecol. 106, 165–191. Edgar, G., 1983. The ecology of south-east Tasmanian phytal animal communities. IV. factors affecting the
distribution of ampithoid amphipods among algae. J. Exp. Mar. Biol. Ecol. 70, 205–225.
Edgar, G., 1991. Artificial algae as habitats for mobile epifauna: factors affecting colonization in a Japanese Sargassum bed. Hydrobiologia 226, 111–118.
Edgar, G., 1992. Patterns of colonization of mobile epifauna in a Western Australian seagrass bed. J. Exp. Mar. Biol. Ecol. 157, 225–246.
Edgar, G., Robertson, A., 1992. The influence of seagrass structure on the distribution and abundance of mobile epifauna: pattern and process in a Western Australia Amphibolis bed. J. Exp. Mar. Biol. Ecol. 160, 13–31.
Fauchald, K., Jumars, P.A., 1979. The diet of worms: a study of polychaete feeding guilds. Oceanogr. Mar. Biol. Annu. Rev. 17, 193–284.
Fretwell, S.D., Lucas, H.L., 1970. On territorial behaviour and other factors influencing habitat distribution in birds. 1. Theoretical development. Acta Biotheor. 19, 16–36.
Gosner, K.L., 1971. In: Guide To Identification of Marine and Estuarine Invertebrates, Wiley, New York, p. 693.
Gosner, K.L., 1978. In: A Field Guide To the Atlantic Seashore, The Peterson Field Guide Series, Vol. 24, Houghton Mifflin, New York, p. 329.
Hacker, S., Steneck, R., 1990. Habitat architecture and the abundance and body-size-dependent habitat selection of a phytal amphipod. Ecology 71, 2269–2285.
Hall, M., Bell, S., 1988. Response of small motile epifauna to complexity of epiphytic algae on seagrass blades. J. Mar. Res. 46, 613–630.
Howard, R., 1981. The ecology and trophic role of caridean shrimps in the eelgrass community of Western Port, Victoria. Ph.D. Thesis, University of Melbourne, pp. 196.
Howard, R., 1985. Measurements of short-term turnover of epifauna within seagrass beds using an in situ staining method. Mar. Ecol. Prog. Ser. 22, 163–168.
Iverson, R.L., Bittaker, H.F., 1986. Seagrass distribution in the eastern Gulf of Mexico. Estuar. Coast. Shelf Sci. 22, 577–602.
Jernakoff, P., Nielsen, J., 1997. The relative importance of amphipod and gastropod grazers in Posidonia sinuosa meadows. Aquat. Bot. 56, 183–202.
Jernakoff, P., Brearley, A., Nielsen, J., 1996. Factors affecting grazer–epiphyte interactions in temperate seagrass meadows. Oceanogr. Mar. Biol. Annu. Rev. 34, 109–162.
Kensley, B., Schotte, M., 1989. In: Guide To the Marine Isopod Crustaceans of the Caribbean, Smithsonian Institute, Washington, DC, p. 308.
Kenyon, R., Loneragan, N., Hughes, J., Staples, D., 1997. Habitat type influences the microhabitat preference of juvenile tiger prawns (Penaeus esculentus Haswell and Penaeus semisulcatus De Haan). Estuar. Coast. Shelf Sci. 45, 393–403.
Kikuchi, T., Peres, J.M., 1977. Animal communities in the seagrass beds. In: McRoy, C.P., Helferrich, C. (Eds.), Seagrass Ecosystems: A Scientific Perspective, Marcel Dekker, New York, pp. 147–193. Kitting, C., 1984. Selectivity by dense populations of small invertebrates foraging among seagrass blade
surfaces. Estuaries 7, 276–288.
Klumpp, D.W., Salita-Espinosa, J.S., Fortes, M.D., 1992. The role of epiphytic periphyton and macroinverteb-rate grazers in the trophic flux of a tropical seagrass community. Aquat. Bot. 43, 327–349.
Koch, E.W., 1994. Hydrodynamics, diffusion-boundary layers and photosynthesis of the seagrasses Thalassia testudinum and Cymodocea nodosa. Mar. Biol. 118, 767–776.
Koike, I., Mukai, H., Nojima, S., 1987. The role of the sea urchin, Tripneustes gratilla (Linnaeus), in decomposition and nutrient cycling in a tropical seagrass bed. Ecol. Res. (Japan) 2, 19–29.
Kristensen, J.H., 1972. Carbohydrases of some marine invertebrates with notes on their food and on the natural occurrence of the carbohydrases studied. Mar. Biol. 14, 130–142.
Lewis, F.G., 1984. The distribution of macrobenthic crustaceans associated with Thalassia, Halodule, and bare sand substrata. Mar. Ecol. Prog. Ser. 19, 101–113.
Lewis, F.G., Stoner, A.W., 1983. Distribution of macrofauna within seagrass beds: an explanation for patterns of abundance. Bull. Mar. Sci. 33, 296–304.
Martin-Smith, K., 1993. Abundance of mobile epifauna: the role of habitat complexity and predation by fishes. J. Exp. Mar. Biol. Ecol. 174, 243–260.
McMillan, C., Zapata, O., Escobar, L., 1980. Sulphated phenolic compounds in seagrasses. Aquat. Bot. 8, 267–278.
Moncreiff, C.A., Sullivan, M., Daehnick, A.E., 1992. Primary production dynamics in seagrass beds of Mississippi Sound: the contributions of seagrass, epiphytic algae, sand microflora, and phytoplankton. Mar. Ecol. Prog. Ser. 87, 161–171.
Morgan, M.D., Kitting, C.L., 1984. Productivity and utilization of the seagrass Halodule wrightii and its attached epiphytes. Limnol. Oceanogr. 29, 1066–1076.
Newell, C., Hidu, H., McAlice, B., Podniesinski, G., Short, F., Kindbloom, L., 1991. Recruitment and commercial seed procurement of the blue mussel Mytilus edulis in Maine. J. World Aquaculture 22, 134–152.
Nielsen, J., Lethbridge, R., 1989. Feeding and epiphyte food resource of gastropods living on the leaves of the seagrass Amphibolis griffithii in southwestern Australia. J. Malacol. Soc. Aust. 10, 47–58.
Novak, R., 1984. A study in ultra-ecology: microorganisms of the seagrass Posidonia oceanica (L.) Delile. P.S.Z.N.I: Mar. Ecol. 5, 143–190.
Orth, R.J., van Montfrans, J., 1987. Utilization of a seagrass meadow and tidal march creek by blue crabs Callinectes sapidus. I. seasonal and annual variations in abundance with emphasis on post-settlement juveniles. Mar. Ecol. Prog. Ser. 41, 283–294.
Penhale, P.A., 1977. Macrophyte–epiphyte biomass and productivity in an eelgrass (Zostera marina L.) community. J. Exp. Mar. Biol. Ecol. 26, 211–224.
Pollard, P.C., Kogure, K., 1993. The role of epiphytic and epibenthic algal productivity in a tropical seagrass, Syringodium isoetifolium (Aschers.) Dandy, community. Aust. J. Mar. Freshwater Res. 44, 141–154. Rehder, H., 1995. In: National Audubon Society Field Guide To North American Seashells, Chanticleer Press,
New York, p. 894.
Robins, C.R., Ray, G.C., 1986. In: A Field Guide To Atlantic Coast Fishes of North America, Houghton Mifflin, New York, p. 324.
Savastano, K.J., Faller, K.H., Iverson, R.L., 1984. Estimating vegetation coverage in St. Joseph Bay, Florida, with an airborne multispectral scanner. Photogram. Eng. Remote Sensing 50, 1159–1170.
Schneider, F.I., Mann, K.H., 1991a. Species specific relationships of invertebrates to vegetation in a seagrass bed. I. correlation studies. J. Exp. Mar. Biol. Ecol. 145, 101–117.
Schneider, F.I., Mann, K.H., 1991b. Species specific relationships of invertebrates to vegetation in a seagrass bed. II. experiments on the importance of macrophyte shape, epiphyte cover and predation. J. Exp. Mar. Biol. Ecol. 145, 119–139.
Snelgrove, P., Butman, C.A., Grassle, J.P., 1993. Hydrodynamic enhancement of larval settlement in the bivalve Mulinia lateralis (Say) and the polychaete Capitella sp. 1 in microdepositional environments. J. Exp. Mar. Biol. Ecol. 168, 71–109.
Sogard, S., 1989. Colonization of artificial seagrass by fishes and decapod crustaceans: importance of proximity to natural eelgrass. J. Exp. Mar. Biol. Ecol. 133, 15–37.
Steneck, R.S., Dethier, M.N., 1994. A functional group approach to the structure of algal-dominated communities. Oikos 69, 476–498.
Stoner, A.W., 1983. Distributional ecology of amphipods and tanaidaceans associated with three sea grass species. J. Crust. Biol. 3, 505–518.
Stoner, A.W., Lewis, F., 1985. The influence of quantitative and qualitative aspects of habitat complexity in tropical sea-grass meadows. J. Exp. Mar. Biol. Ecol. 94, 19–40.
Thayer, G.W., Bjorndal, K., Ogden, J., Williams, S., Zieman, J., 1984. Role of larger herbivores in seagrass communities. Estuaries 7, 351–376.
Thursby, G.B., Davis, J.S., 1984. Species composition and relative abundance of attached diatoms and other algae in the coastal waters adjacent to Seahorse Key, Florida. Fla. Scientist 47, 130–140.
Tritar, S., Prieur, D., Weiner, R., 1992. Effects of bacterial films on the settlement of the oysters, Crassostrea gigas (Thunberg, 1793) and Ostrea edulis, Linnaeus, 1750 and the scallop Pecten maximus (Linnaeus, 1758). J. Shellfish Res. 11, 325–330.
Valentine, J.F., Heck, K.L., 1991. The role of sea urchin grazing in regulating subtropical seagrass meadows: evidence from field manipulations in the northern Gulf of Mexico. J. Exp. Mar. Biol. Ecol. 154, 215–230. Valentine, J.F., Heck, K.L., 1993. Mussels in seagrass meadows: their influence on macroinvertebrate abundance and secondary production in the northern Gulf of Mexico. Mar. Ecol. Prog. Ser. 96, 63–74. van Montfrans, J., Wetzel, R., Orth, R., 1984. Epiphyte–grazer relationships in seagrass meadows:
conse-quences for seagrass growth and production. Estuaries 7, 289–309.
Virnstein, R., Curran, M., 1986. Colonization of artificial seagrass versus time and distance from source. Mar. Ecol. Prog. Ser. 29, 279–288.
Weiczorek, S.K., Todd, C.D., 1997. Inhibition and facilitation of bryozoan and ascidian settlement by natural multi-species biofilms: effects of film age and the roles of active and passive larval attachment. Mar. Biol. 128, 463–473.
Williams, A.B., 1984. In: Shrimps, Lobsters, and Crabs of the Atlantic Coast of the Eastern United States, Maine To Florida, Smithsonian Institute, Washington, DC, p. 550.