OFFICIALS AT PADANG PRIMARY TAX OFFICE IN
TAXPAYERS’ PERSPECTIVE
Charoline Cheisviyanny1, Herlina Helmy2, Sany Dwita3 Department of Accounting, Padang State University
Abstract
The research aims to get information about the performance of Account Representative (AR) officials at Padang Primary Tax Office in taxpayers’ perspective. The performance is measured by how excellent service quality that they deliver to taxpayers.The population was all AR officials and all taxpayers in Padang. The sample of taxpayers was selected by using purposive sampling method i.e. taxpayers who ever experinced AR’s services and was obtained 199 taxpayers. The data were analyzed using independent sample t-test, paired t-test, and Importance Performance Analysis (IPA). The resuts showed that (1) there are significant differences between AR perceptions and taxpayers’ perceptions on AR performance and (2) there are significant differences between taxpayers’ perceptions and expectations on AR performance.The limitation of this study is the use of negative questions in questionnare which were indicated mislead the respondents. It suggests to : (1) be careful in using negative questions in questionnare, (2) explore the AR performances between two primary tax office in Padang, and (3) to analyze the effectiveness of separated dual roles of AR.
Keywords :service quality,taxpayers’ expectation and perception
I. Introduction
Since 2002, Indonesian Directorate General of Taxation (DGT) has undergone fundamental changes, ranging from organizational restructuring to human resource development and use of information technology in tax administration (Priyadi, 2012). One of the enhanced dimension associated with the tax reform is the existence of Account Representative (AR) officials in Supervison and Consultation Division. The main functions of the officials are (1) to supervise taxpayers’ compliance, (2) to give consultation and service, (3) to explore potential tax and do tax intensification, and (4) to collect and analyze taxpayers’ data and information. AR officials are expected to enhance taxpayers’ compliance so the tax target could be realised.
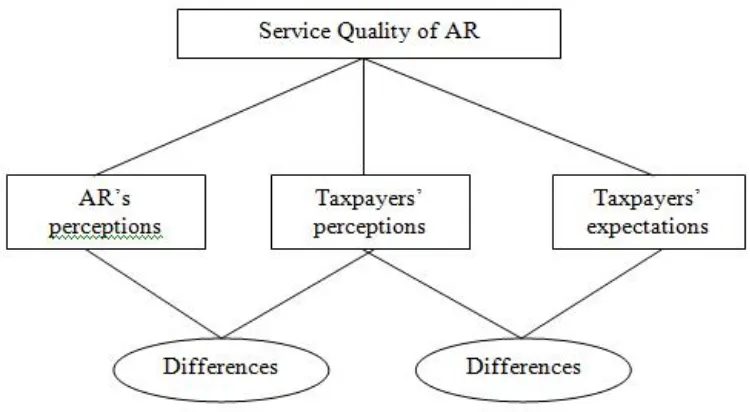
On the other hand, taxpayers have an expectation that AR officials can give solutions for all of their problems in fulfilling tax liability. But what they see in reality is the dual roles that should be implemented by AR officials sometimes causes taxpayers uncomfortable. This condition get worse when some of AR officials do not give excellent services to taxpayers. So, it is clear that there are differences in perceptions between AR officials and taxpayers. The difference is often referred to as expectation gap. According to Zikmund (2008), "the expectation gap reflects a perceived difference between what one is expected to accomplish by others and what one personally believes he must accomplish." Expectation gap illustrates differences between one’s perceptions and expectationstowards others who are believed to be able to meet the expectations. This study uses this definition of expectation gap for its examination, namely, the difference between taxpayers’ perceptions and expectations towards services provided by AR officials.
This difference may disrupt good relationship between taxpayers and tax officials. Thus, it is important for the tax office to adopt strategies that encourage transparency in tax administration that meets the dimensions of service quality. Dimensions of service quality consists of tangible, reliability, responsiveness, assurance, and empathy (Zeithmal: 2003).
Since there are not many studies about AR’s service quality which has been done, the researchers are interested to conduct a research about that topic. The study isconducted because of the limitation of previous study which has been done by Helmy et all (2015). The result of the study could not conclude the difference between taxpayers’ perceptions and expectations on AR performance because of validity and reability constraints. One of the constraints was the low number of respondents. So, this study is conducted again by increasing the number of respondents and enhancing the scope by analyzing the perception differences between AR officials and taxpayers on AR performance.
This paper is organized as follows. Section 2 provides a theory development of this study. Section 3 presents conceptual framework and hypotheses formulation of this study. Section 4 discusses research methods utilized including the data analysis employed in this study. Section 5 discussed results and analysis of the study and followed by conclusion in the last section.
II. Theory Development and Hypotheses Formulation Service quality
Quality is defined as a measure of how well the level of service delivered matches the customers’ expectation (Parasuraman, 1985 as cited by Dina, 2009). If the perceived quality equals or exceeds the expectation, the service quality is said to be satisfactory.
employees in providing services; and (3) Credibility, which is related to the taxpayers’ trust the confidentiality of the data they submit. (e) Empathy, the ability of workers to establish interpersonal communication and understand customer needs. To realize the implementation of this dimension, tax officials should be able to give special attention to individual taxpayer. The empathy dimension is an amalgamation of dimensions: (1) Access (ease), include the ease to utilize the services offered by the company; and (2) Communication, which refers to the ability to communicate to convey information to customers.
As mentioned earlier, this study focuses on the service quality provided by Account Representative (AR). Account Representative (Supervision and Consultation) Department is responsible for: (a) Supervising taxpayers’ compliance with tax obligations, (b) Providing guidance/appeal and technical consultation to taxpayers, (c)Preparingtaxpayers’ profile (d) Conducting performance analysis of taxpayers, (e)Reconciling taxpayers’ data in the context of intensification, (f) Developing proposed rectification of tax assessment and evaluating results of appeals.
Differences in perceptions and expectations
Perception is the process of how an individual chooses, organizes, and interprets input information to create a picture of the world that has a meaning (Kotler, 2000). The perception is influenced by both internal and external factors (Thoha, 2003: 154). Internal factors include feelings, attitudes and individual personalities, prejudices, desires or expectations, attention (focus), learning, physical, psychiatric disorders, values and needs are also of interest, and motivation (Thoha, 2003: 154). The external factors include family background, obtained information, and knowledge about the needs, intensity, size, opposition, movement repetition, new things and familiarity of an object.
Expectation is what taxpayers think that should be provided by tax officials as community service (Hill as cited by Adinur, 2006). In another opinion, expectation is a customer confidence before trying or buying a product, which is used as a standard or reference in assessing the performance of the product in question (Zeithaml et al., 1993). Customers’ expectations is basically a yardstick in determiningthe quality of a product.
The relationship between expectation and perception can lead to several possibilities, including: (a) If the perception is smaller than expectation, (P <E), consumers will give negative assessment on the service received. This will create a consumer dissatisfaction. (b) If the perception equals to expectation, (P = E), consumers will adopt a neutral assumption, depend on the service received. This will make consumers quite satisfied with the service. (c) If the perception is greater than expectation, (P> E), consumers will give a positive assessment on the service received. This will make consumers feel very satisfied with the service.
III. Conceptual Framework and Hypotheses
Based on the theory development, this study formulated three hypotheses in the form of alternative hypotheses (Ha) as follows.
H1: There are differences between AR perceptions and taxpayers’ perceptions on AR performance.
The research instrument used for the purpose of this study was developed from the theories that have been proposed in the earlier section. The main part of the instrument comprised questions eliciting participants’ perceptions and expectations on service provided by AR. The participants’ responses were measured using a 5-point Likert scale (where 1 denotes strongly disagree and 5 denotes strongly agree that the service fulfil the dimensions of quality). Table 2 presents the indicators used in developing the research instrument. This instrument has been used by a number of prior research examining service quality (i.e., Widyawati, 2007). The use of an instrument that has been tested for its readability and validity was consistent with the suggestion that the use of previously tested scenarios enhances the scope, depth, validity, and credibility of the research (Patel, 2006: 98).
Participants
The research population in this study wasall AR officialsand all taxpayers registered at Padang Primary Tax Office. This study was conducted when there still was one primary tax office, while there are two primary tax offices in Padang now. The total number of population is 40 AR officials and 257,943 taxpayers, consisting of 229,125 individuals, 4,429 trust agencies, and 24,389 companies. The sample of taxpayers in the survey questionnaire was calculated by Slovin formula with an error of 5%. The purposive and convenience sampling methodswere used to select the sample for this study. The criteria for the sample is taxpayers who had met with and being served by AR officials for at least two times. This type of information were not available in records; thus this study selected the sample directly at the fieldwork. Participants of this study is taxpayers in Padang since more than 70% taxpayers registered at Padang Primary Tax Office werelocated in Padang. Therefore, the participants chosen for this study were considered representative of the total population of taxpayers. Questionnaires were distributed to 40 AR officials (collected 30 AR officials) and 199 taxpayers (collected all).
Data analysis
For testing the first hypothesis, data were analyzed using independent sample t-test, which means that the variable is derived from the different population (Ghozali, 2012). While for testing the second hypothesis, data were analyzed using paired sample t-test, which means that the variable is derived from the same population (Ghozali, 2012). The test criteria is if tcount ≥ ttable; -thitung<-ttabelatau α <0.05, then the results rejected Ho(Ha is supported). If tcount<ttable; -thitung≥-ttabelor α> 0.05 then the results fail to reject Ho(Hais not supported).
V. Results and Discussion
Preliminary analyses of validity and reliability tests were conducted to responses for each department’s service quality before further analysis of independent sample t-test, paired sample t-test, and IPA were carried out.
The differences between AR perceptions and taxpayers’ perceptions on AR
performance
Results of independent sample t-test in Appendix 1 show that there are significant differences between AR perceptions and taxpayers’ perceptions on AR performance (service quality) where AR perceptions are higher that taxpayers’ perceptions. If we look closely at each dimension, it shows that AR gives higher perceptions for dimensions of assurance, reliability, emphaty; while taxpayers give higher perceptions for dimensions of tangibles and responsiveness.
The results indicate that taxpayers need higher assurance, reliability, and emphaty from AR officials. Taxpayers want AR officials to be more friendly and polite, have good communication skills, and give excellent service and attention. These demands, hopefully, could be fulfilled by current condition when two tasks (consultant and supervisor) are handled by two AR officials. AR officials could focus on their task to serve taxpayers without being disturbing by two conflicting roles like happened before.
The differences betweentaxpayers’ perceptions and expectations on AR performance
Results of paired sample t-test in Appendix 2 show that there are significant differences between taxpayers’ perceptions and expectations on AR performance (service quality). If we look closely at each dimension, it shows that the differences appear from assurance, reliability, and responsiveness dimensions.
Moreover, the IPA graph in Appendix 2 shows that all elements (questions) of service quality (excepts number 19,20,21) are in quadrant B that means those elements have been well implemented by AR officials. The other three elements are in quadrant C that means those elements are not necessary to be enhanced. The analyses made of those three elements shows that the questions in questionnare are in negative forms that could mislead the respondents.
The results indicate that although there are significant differences between taxpayers’ perceptions and expectations on AR performance (service quality), but IPA graph shows that, in fact, taxpayers have been satisfied of AR officials’ performanceswhich suit to their expectations. However, they expect AR officials consistent to give excellent services as indicated in the results of H1 testing.
VI. Conclusion
The study concludes that : (1) there are significant differences between AR perceptions and taxpayers’ perceptions on AR performance and (2) there are significant differences between taxpayers’ perceptions and expectations on AR performance.
References
Adinur, Prasetyo. (2006).Pengaruh uniformity dan kesamaan persepsi, serta ukuran perusahaan terhadap administrasi pajak di Indonesia. Jakarta: Grasindo.
Helmy, Herlina et all. (2015). The Analysis of Service Quality at Padang Primary Tax Office. Proceeding of Asia Pacific Conference on Accounting and Finance 11-12 June 2015. Hanlon, M. and Heitzman, S. (2010). A review of tax research. Journal of Accounting and
Economics, 50: 127–178.
Hidayat, Nur. (2010). Penyimpangan Pemeriksaan Pajak. Accessed from
www.pencerahanpajak.blogspot.comon 9 March 2013.
Kotler, Philip. (2000).Marketing Management. Jakarta: Gramedia Pustaka Utama. Law No. 16/2009 on Taxation Regulations and Procedures.
Maharani A., Deasy and Herawati, Nurul. (2010). Adakah kesenjangan antara harapan dan persepsi wajib pajak badan terhadap pelaksanaan pemeriksaan pajak?Jurnal Akuntansi, Manajemen Bisnis, dan Sektor Publik, 6 (2), February 2010, pp. 177–196.
Maydew, E. (2001). Empirical tax research in accounting: a discussion.Journal of Accounting and Economics, 31: 389–403.
Minister of Finance Regulation No. 17/PMK.03/2013 on Tax Audit Procedures. Minister of Finance Regulation No. 199/PMK.03/2007 on Tax Audit Procedures.
Minister of Finance Regulation No. 82/PMK.03/2011 about changes in Minister of Finance Regulation No. 199/PMK.03/2007 on Tax Audit Procedures.
Patel, C. (2006).A ComparativeStudy of Professional Accountants’ Judgments: Elsevier.
Priyadi, Wahyu Agung. (2012). Mencicipi Modernisasi Perpajakan. Accessed
fromwww.pajak.go.idon 12 Mei 2014
Resmi, Siti. (2016).Perpajakan: Teori dan Kasus. Book 1. 9thEdition. Jakarta: Salemba Empat. Suhardjito. (2014). Reformasi perpajakan dalam rangka peningkatan kepatuhan wajib pajak, tata
kelola yang baik serta kemandirian bangsa. Jurnal Manajemen, 13 (3). Accessed from
www.pusdiklatmigas.comon 14 Mei 2014.
Sultoni. (2012). Account Representative (AR) Riwayatmu kini. Accessed
fromwww.tontax.blogspot.comon 12 Mei 2014.
Tjiptono, Fandy dan Chandra, Gregorius. (2007). Service, quality and satisfaction. Yogyakarta: Penerbit Andi.
Umar, M. Taufik. (2010). Pemeriksaan pajak sebagai pembuktian modernisasi wajib pajak dan petugas pajak. Accessed fromwww.pusatperpajakan.blogspot.com on9 March 2013. Waluyo. 2015.Perpajakan Indonesia. Book 1. 11thEdition. Jakarta: Salemba Empat.
Widodo, Muji Rahayu. (2009).Tugas dan wewenang seksi-seksi di KPP Pratama. Accessed from
www.mujirahayuwidodo.blogspot.comon 12 Mei 2014.
Zeithaml, Valerie A. and Bitner, Mary Jo. (2003).Service Marketing Integrating Customer Focus Across the Firm. Third Edition. New York: The McGraw-Hill Company.
Appendix
Independent Samples Test for Testing H1 Assurance Dimension
Tangibles Dimension
Responsiveness Dimension