is an absolute must-have book for anyone who develops, tests, or supports software for Microsoft Windows.”
—Bob Wilton, Escalation Engineer, Critical Problem Resolution Team, Microsoft Corporation
“I have been fortunate enough to personally work with the authors on extremely demand-ing systems projects for more than eight years. This volume contains the kind of stuff we all wish we had known back at the beginning of those projects—the kind of stuff that the debugging guru tells you over a coffee-spilled keyboard on February 29 only because an extra day showed up and he has the afternoon free; the kind of stuff that only comes from actually building and then debugging complex systems projects instead of just read-ing about somebody else doread-ing it.
“Most books leave the advanced cases as ‘exercises to the reader’ or to ‘other, more advanced books,’ and those never seem to materialize. This book is one of those very rare ‘other’ books. Get two copies. You will always be lending the other one out.”
—Raymond McCollum, Architect, Microsoft Forefront Security Products
“This book by Microsoft authors Mario and Daniel is an excellent reference for both intermediate and advanced debuggers. In-depth examples showing how to debug intri-cate problems, such as stack and heap corruptions, make this book stand out among cur-rent available literature on debugging Win32 software on Windows. The book is highly practical and is filled with numerous debugging tricks and strategies.”
—Kinshuman, Development Lead, Windows Core OS Division
“I am pleased to see this guided tour through a comprehensive set of clever debugging techniques. It does not only tell how to deal with tough diagnosis problems, but it also explains the mechanisms behind the techniques used. The pragmatic approach taken in
Advanced Windows Debugging makes it a good resource to understand several key Windows areas.”
tracking down the cause of various classes of software bugs. It includes representative examples of typical defects, the tools used to investigate these defects, and step-by-step instructions for using these tools. Software developers and testers will greatly benefit from becoming familiar with these examples.”
—Daniel Mihai, Software Design Engineer, Developer Productivity Tools, Microsoft
“I wrote the WinDbg symbol handler, Symbol Server, and Source Server. Even so, I can’t get my own wife to use WinDbg. She thinks it is hard to use, and, consequently, she hasn’t learned of the potential of this toolset. I am buying a copy of this book, so she can learn it. The chapters on postmortem debugging and memory corruption are essential reading that provide real insight into the internals of the runtime and OS in the context of a program fault. Mario and Daniel’s understanding of debugging comes from being asked to resolve completely unexplained bugs in unfamiliar target programs. This is what industrial strength debugging is all about.”
Mario Hewardt
Daniel Pravat
Upper Saddle River, NJ • Boston • Indianapolis • San Francisco New York • Toronto • Montreal • London • Munich • Paris • Madrid
The authors and publisher have taken care in the preparation of this book, but make no expressed or implied warranty of any kind and assume no responsibility for errors or omis-sions. No liability is assumed for incidental or consequential damages in connection with or arising out of the use of the information or programs contained herein.
The publisher offers excellent discounts on this book when ordered in quantity for bulk purchases or special sales, which may include electronic versions and/or custom covers and content particular to your business, training goals, marketing focus, and branding interests. For more information, please contact:
U.S. Corporate and Government Sales (800) 382-3419
For sales outside the United States please contact: International Sales
Visit us on the Web: www.awprofessional.com Library of Congress Cataloging-in-Publication Data: Hewardt, Mario.
Advanced windows debugging / Mario Hewardt, Daniel Pravat. p. cm.
Includes index.
ISBN 0-321-37446-0 (pbk. : alk. paper) 1. Microsoft Windows (Computer file) 2. Operating systems (Computers)— Management. 3. Debugging in computer science. I. Pravat, Daniel. II. Title.
QA76.76.O63H497 2007 005.4’46—dc22
2007030163
Copyright ©2008 Pearson Education, Inc.
All rights reserved. Printed in the United States of America. This publication is protected by copyright, and permission must be obtained from the publisher prior to any prohibited reproduction, storage in a retrieval system, or transmission in any form or by any means, electronic, mechanical, photocopying, recording, or likewise. For information regarding permis-sions, write to:
Pearson Education, Inc. Rights and Contracts Department 501 Boylston Street, Suite 900 Boston, MA 02116
Fax (617) 671 3447
This material may be distributed only subject to the terms and conditions set forth in the Open Publication License, v1.0 or later. (The latest version is presently available at http://www.opencontent.org/openpub/.)
me to follow my dreams and passions. Mario Hewardt
Foreword . . . .xiii
Preface . . . .xv
Acknowledgements . . . .xxvii
About the Authors . . . .xxviii
P
ARTI: O
VERVIEW. . . .1
Chapter 1: Introduction to the Tools . . . .3
Leak Diagnosis Tool . . . .4
Debugging Tools for Windows . . . .7
UMDH . . . .9
Microsoft Application Verifier . . . .9
Global Flags . . . .16
Process Explorer . . . .21
Windows Driver Kits . . . .23
Ethereal . . . .26
DebugDiag . . . .27
Summary . . . .27
Chapter 2 Introduction to the Debuggers . . . .29
Debugger Basics . . . .30
Basic Debugger Tasks . . . .45
Remote Debugging . . . .109
Debugging Scenarios . . . .117
Summary . . . .121
Chapter 3 Debuggers Uncovered . . . .123
User Mode Debugger Internals . . . .124
Controlling the Target . . . .168
Summary . . . .178
Chapter 4: Managing Symbol and Source Files . . . .179
Managing the Symbols for Debugging . . . .180
Managing Source Files for Debugging . . . .188
Summary . . . .196
P
ARTII: A
PPLIEDD
EBUGGING. . . .197
Chapter 5: Memory Corruption Part I—Stacks . . . .199
Memory Corruption Detection Process . . . .201
Stack Corruptions . . . .209
Summary . . . .258
Chapter 6: Memory Corruption Part II—Heaps . . . .259
What Is a Heap? . . . .259
Heap Corruptions . . . .281
Summary . . . .314
Chapter 7: Security . . . .317
Windows Security Overview . . . .318
Source of Security Information . . . .328
How Is the Security Check Performed? . . . .334
Identity Propagation in Client-Server Applications . . . .334
Security Checks at System Boundaries . . . .338
Investigating Security Failures . . . .340
Summary . . . .378
Chapter 8: Interprocess Communication . . . .379
Communication Mechanisms . . . .380
Troubleshooting Local Communication . . . .382
Troubleshooting Remote Communication . . . .396
Additional Technical Information . . . .422
Chapter 9: Resource Leaks . . . .427
What Is a Resource? . . . .427
High-Level Process . . . .428
Reproducibility of Resource Leaks . . . .433
Handle Leaks . . . .434
Memory Leaks . . . .460
Summary . . . .492
Chapter 10: Synchronization . . . .493
Synchronization Basics . . . .493
High-Level Process . . . .505
Synchronization Scenarios . . . .510
Summary . . . .550
P
ARTIII: A
DVANCEDT
OPICS. . . .551
Chapter 11: Writing Custom Debugger Extensions . . . .553
Introduction to Debugger Extensions . . . .553
Example Debugger Extension . . . .556
Summary . . . .594
Chapter 12: 64-Bit Debugging . . . .595
Microsoft 64-Bit Systems . . . .595
Windows x64 Changes . . . .602
Summary . . . .629
Chapter 13: Postmortem Debugging . . . .631
Dump File Basics . . . .632
Using Dump Files . . . .645
Windows Error Reporting . . . .653
Corporate Error Reporting . . . .682
!analyze Extension Command . . . .699
Summary . . . .708
Chapter 15: Windows Vista Fundamentals . . . .709
Chapter 1—Introduction to the Tools . . . .710
Chapter 2—Introduction to the Debuggers . . . .711
Chapter 6—Memory Corruptions—Part Heaps . . . .717
Chapter 7—Security . . . .723
Chapter 8—Interprocess Communication . . . .736
Chapter 9—Resource Leaks . . . .736
Chapter 10—Synchronization . . . .737
Chapter 11—Writing Custom Debugger Extensions . . . .741
Chapter 13—Postmortem Debugging . . . .741
Summary . . . .745
Appendix A: Application Verifier Test Settings . . . .747
Exceptions . . . .747
Handles . . . .747
Heaps . . . .749
Locks . . . .757
Memory . . . .760
ThreadPool . . . .762
TLS . . . .764
FilePaths . . . .764
HighVersionLie . . . .765
InteractiveServices . . . .767
KernelModeDriverInstall . . . .768
Low Resource Simulation . . . .769
LuaPriv . . . .771
DangerousAPIs . . . .774
DirtyStacks . . . .775
TimeRollOver . . . .775
PrintAPI and PrintDriver . . . .776
Software has one goal: simplify. If there’s a workflow that can be optimized or auto-mated, data that can be stored or processed more efficiently, software steps in to fill the job. While simplifying, software must not introduce undo complexity, and there-fore should install with minimal user interaction, seamlessly integrate services and data from other applications and multiple sources, and be resilient to changes in its soft-ware and hardsoft-ware environment. For the most part, softsoft-ware magically just works.
However, while software strives to simplify the experiences of end users and administrators, it has become more and more complex. Whether it’s the amount of the data they work with, the number of applications with which they communicate, their degree of internal parallelism, or the APIs they import directly and indirectly from the software stack upon which they run, most of software’s apparent simplicity hides a world of subtle timings, dependencies, and assumptions that run between lay-ers of software, often across different applications and even computlay-ers. Just deter-mining which component is at fault—much less why, for a problem that surfaces as a crash in a library, a meaningless error message, or a hang—is often daunting.
The reason you’re reading this book is that you develop, test, or support software, and therefore face breakdowns in software’s myriad moving parts that you are charged with investigating through to a root cause and maybe fixing. Success in this endeavor means identifying the source of a problem as quickly and efficiently as pos-sible, which requires knowing what to look with, where to look, and how to look. In other words, succeeding means knowing what tools are at your disposal, which ones are the most effective for a class of failures, and how to apply the tool’s features and functionality to quickly narrow in on the source of a problem.
Learning how to troubleshoot and debug Windows applications on the job has, for the most part, been the only option, but when you debug an application failure, knowing about that one obscure tool or scenario-specific debugger command can mean the difference between instantly understanding a problem and spending hours or even days hunting it without success. That’s why a book like this pays for itself many times over.
heap manager influences the behavior of buffer overflows or what debugger extension command you should use to troubleshoot DCOM hangs, for example. I’ve been debugging my own Windows applications and device drivers for over 10 years, but when I reviewed the manuscript, I learned about new techniques, tools, and debugger commands that I’d never come across and that I’ve already found use for.
We all earn our pay and reputations not by how we debug, but by how quickly and accurately we do it. Whether you’ve been debugging Windows applications for years or are just getting started, Mario and Daniel equip you well for your bug hunting expeditions. Happy hunting!
Mark Russinovich
xv
Not long ago, we were reminiscing about a really tough problem we faced at work. The Quality Assurance team was running stress tests on our product, and every four or five days, a crash would rear its ugly head. Sure, we had debugged the crash as far as we thought possible, and we had done extensive code reviews to try to figure it out, but alas, not enough information could be gained to get to the bottom of it. After sev-eral weeks of unfruitful attempts, we started looking for alternative approaches. During a random hallway conversation, someone happened to casually mention a tool called gflags. Having never heard of this tool before, we set out to do some research to find out how it could help us get to the bottom of our crash. Unfortunately, the learning process proved to be somewhat difficult. First, finding information about the tool proved to be a real challenge. There was a ton of great information in the refer-ence documentation that came with the tools, but it was hard to figure out how to actually get started. We quickly realized that without some basic guidance, there was little hope for us to be able to utilize the tool. Naturally, we decided to ask the per-son who had happened to mention the tool if he knew of any documentation or point-ers. He gave us some brief descriptions of the tool and, perhaps more importantly, the names of other people who had worked with the tool extensively. What followed was a series of long and instructive conversations, and bit by bit the basic idea behind the tool started falling into place.
Did we ever get to the bottom of the crash? Yes—we did. As a matter of fact, enabling the correct tool while running our stress tests pinpointed the problem to such accuracy that it only took an hour of code reviewing to locate and fix the misbe-having code. Had we known about this tool and how to use it from the start, we would have saved several weeks of work. From that point on, we dedicated quite a lot of time to furthering our understanding of the tools and how they can help while trying to troubleshoot misbehaving code.
engineers at Microsoft (some of whom wrote the tools), but without this luxury, many hopeful developers end up at a dead end and are never able to reap the benefits of the tools. This unfortunate problem of a lack of learning material also turned out to be a great opportunity for a solution, and thus the idea for this book was born. The key to enable developers to gain the knowledge required is to provide a central repository of concise information that fully explains the ins and outs of the debugging tools and processes. The book you are holding serves as that key and is the net result of three years of writing and over 15 years of collective debugging experience.
We hope that you will enjoy reading this book as much as we enjoyed authoring it and that it will open up the door to a truly amazing world of highly efficient soft-ware troubleshooting and debugging. Knowing how to use the tools and techniques described in this book is a critical part of a computer scientist’s work and can teach you how to very efficiently troubleshoot some of the toughest problems in software.
Who Is This Book For?
The short answer to this question is anyone who is involved in any facet of software development and has a strong desire to learn what is actually happening deep inside Windows. Although the technical nature of the book might make you believe that its content is only intended for advanced system engineers, this is absolutely not true. One of the key points of this book is the removing of the magic. For various reasons, a lot of software engineers believe that there is a magical relationship between the software they are working on and the operating system. When a problem surfaces that requires the analysis of operating system components (such as RPC/COM or the Windows heap manager), this preconceived notion of magic prevents them from venturing inside
Windows to gain more information that can potentially help them solve the problem. To make effective use of this book, you will have to learn how to remove this precon-ceived notion and truly be of the mind-set that there is no magicbehind-the-scenes. The core Windows components should be viewed as an extension of your product and not as a separate and magical layer. After all, it’s all just code—some of which just hap-pened to be written by other people. If you can adjust your mind-set to accept this, you will have taken your first steps to mastering the art of Windows debugging.
Software Developers
Over the years, we’ve had several discussions with higher-level RAD developers who claim that they really don’t see the need to learn about these low-level topics. After all, the beauty of writing code at a higher level is that all of the low-level intricacies are abstracted and hiddenaway from the developer. We couldn’t agree more. However, our claim is that although abstractive programming allows the developer not to have to focus on low-level details, it does notnegate the need to know how the abstraction really works. The substance behind this claim is simple. What you are working with is really just that—an abstraction. Usage of this abstraction in a design that it was not suited for can cause serious problems in your software; and, in such a case, without a solid understanding of how the abstraction works, it can mean the difference between shipping your product on time and slipping the release date by several months.
Another key factor when considering mastering the Windows debuggers and tools is related to the debugging of live production servers. While every attempt should be made to fix bugs before shipping a product, we all know that some bugs might slip through the cracks. When these bugs do surface post release, it can be a real headache tracking them down. Customers who encounter the bugs on live produc-tion servers are typically very sensitive to downtime and configuraproduc-tion changes, mak-ing it impossible to install a complex debugger package. The Debuggmak-ing Tools for Windows, on the other hand, enables live debugging with no server configuration change and no installation requirements. In short, it enables customers to keep a pris-tine server during the troubleshooting process.
Quality Assurance Engineers
Product Support Engineers
In much the same way that quality assurance uses the Windows debuggers and tools to make root cause analysis more efficient, so can the product support engineers. Product support faces many of the same problems that quality assurance and software developers face on a day by day basis. The key difference, however, is the environ-mental constraints that they work under. The constraints can include not having full access to the server exhibiting the problems, having a limited amount of time avail-able for troubleshooting the server, having limited access to customer source code, and other issues.
The information presented in this book will give product support engineers a great deal of ammunition when tackling these tough problems. Knowing how to debug customer problems with minimal downtime and minimal system configuration changes enables product support engineers to much more efficiently and nonintru-sively gather the required data to get to the bottom of the problem.
Where There Is a Will, There Is a Way
It should come as no surprise that the material presented in this book is highly tech-nical in nature. We are not going to try and convince you that you don’t need to know anything about Windows internals to benefit from the book because the simple truth is that you do. As with any technically oriented book, a certain amount of knowledge is assumed.
Curiosity and a Will to Learn
While writing this book, we came to the realization that some of the areas of Windows we were writing about had been taken for granted. Sure, most of the time we knew that those areas worked a certain way, but we did not know exactly what made them workthat way. We could have simply accepted the fact that they just work,but curios-ity got the best of us (as it usually does). We spent quite a lot of time researching the topics and trying to connect the dots. The net result was a more in-depth under-standing of Windows, which, in turn, allowed us to more efficiently debug problems. The basic principle behind learning anything is that there must be a will to learn. Depending on your background, some of the high-level material in the book might feel intimidating. Embrace this intimidation, and you will be in a stronger position to fully grasp and understand the contents of this book.
C/C++
All the sample code throughout the book is written in C/C++, and as such a good understanding of the language as well as its object layout is required. If some of the language concepts in the book are unfamiliar to you and you want to brush up on your C/C++ skills, we recommend the following books:
The C++ Programming Language (3rd Edition), by Bjarne Stroustrup, Boston: Addison-Wesley, 2000.
Inside the C/C++ Object Model, by Stanley B. Lippman, Reading, MA: Addison-Wesley, 1996.
Windows Internals
This book is about advanced Windows debugging, and as such parts of the book are dedicated to describing the internals of several integral Windows components (for example, heap manager, RPC, security subsystem). Our intentions are not to fully explain all aspects of these components but rather to give a brief but in-depth sum-mary of how the component functions in relationship to the debugging scenarios being illustrated. If you want to take your knowledge of the internals of Windows even further, we strongly recommend reading
Microsoft Windows Internals, Fourth Edition: Microsoft Windows Server 2003, Windows XP, and Windows 2000, by Mark E. Russinovich and David A. Solomon. Redmond, WA: Microsoft Press, 2004.
Organization
The book consists of three major parts. In this section, we provide a short description of the contents of each chapter.
Part I: Overview
Chapter 1, “Introduction to the Tools,” provides a high-level introduction to the tools used throughout the book. Topics such as download locations, installation instructions, and usage scenarios are detailed.
Chapter 2, “Introduction to the Debuggers,” introduces the reader to the funda-mentals of the Windows debuggers. Basic concepts such as what debuggers are avail-able, how to use them, and how to configure them are covered.
Chapter 3, “Debuggers Uncovered,” provides a more in-depth examination of user mode debuggers. A minimalist implementation of a debugger is provided, as well as looking at more advanced topics such as how the exception dispatch mechanism works. Chapter 4, “Managing Symbol and Source Files,” discusses how to maintain two of the most critical pieces of information during debugging: symbol files and source files. It gives a brief description of what symbol and source servers are, how to use them in association with the debuggers, and how to effectively manage them by set-ting up symbol servers and maintaining source servers for your organization.
Part II: Applied Debugging
The focus of Part II is to provide the reader with the opportunity to analyze common programming mistakes using the Windows debuggers. Each of the chapters in this section is focused on a particular category of problems, such as memory corruption, memory leaks, and RPC/COM. Each chapter begins with an overview of the Windows component(s) involved followed by one or more scenarios that illustrate common programming mistakes in that area.
With the exception of Chapters 5 and 6, the chapters in Part II are standalone and can be read in any order.
Chapter 5, “Memory Corruption Part I—Stacks,” and 6,” Memory Corruption Part II—Heaps,” take a close look at a very common problem that plagues develop-ers on a daily basis: memory corruptions. Chapter 5 focuses on stack corruptions, and Chapter 6 on heap corruptions. Each chapter begins by explaining the overall con-cept behind the type of memory being examined (stack and heap) and is followed by a number of common scenarios under which the corruption can occur. Each scenario has associated sample code and a walk-through of the process that is used during debugging and root cause analysis.
Chapter 8, “Interprocess Communication,” focuses solely on interprocess com-munication debugging. Arguably perhaps the most used interprocess comcom-munication protocol in Windows but also the most magical is RPC/LPC. Knowing how to trou-bleshoot this important component is paramount when working with most applica-tions. Using the debuggers, this chapter will show how you can track identity, analyze RPC failures, and much more.
Chapter 9, “Resource Leaks,” details a very common problem with software today: resource leaks. The most common form of resource leaks is related to memo-ry but not limited to it. Other examples includes registmemo-ry keys, file handles, and so on. This chapter takes a look at the resource leak problem by showing a number of sce-narios and associated sample code, as well as how to use the debuggers and tools to efficiently track them down.
Chapter 10, “Synchronization,” discusses the topic of application hangs and how to most efficiently make use of the debuggers to track down synchronization prob-lems such as deadlocks and lock contentions. A number of different synchronization scenarios are examined with associated debug sessions that give an in-depth view of the analysis process.
Part III: Advanced Topics
Part III is an advanced section that consists of chapters that discuss topics such as postmortem debugging 64-bit debugging, Windows Vista fundamentals, and much more. The goal of these chapters is not to provide an exhaustive examination of each area, but rather provide just enough fundamentals for the reader to get started in the topic explained.
Chapter 11, “Writing Custom Debugger Extensions,” talks about custom debug-ger extensions. Even though the Windows debugdebug-gers pack an extremely powerful set of commands and tools, there are times when you want to automate certain aspects of your own application debugging sessions. This chapter details how the extensibili-ty model of the debuggers works and describes an example of a sample custom debugger extension.
Chapter 12, “Bit Debugging,” introduces the basic concepts of debugging 64-bit architectures. Basic concepts such as stack traces, function calls, and parameter passing are discussed to enable the reader to get started on debugging these power-ful architectures.
Chapter 14, “Power Tools,” discusses two powerful tools that can be used to auto-mate the debugging process. The first tool is called DebugDiag, and it provides an excellent way of automating resource leak debugging. The other tool is a command called analyze, which automates the initial fault analysis process.
Chapter 15, “Windows Vista Fundamentals,” details some of the fundamentals behind Windows Vista. With the introduction of the new generation Windows plat-form, certain aspects of the operating system have changed dramatically, and some of the key changes are outlined in this chapter.
Required Tools
All the tools required to make full use of this book are available as downloads free of charge. The new Windows Drivers Kit contains a complete command-line C/C++ development environment and a great set of associated development tools.
Sample Code
As software engineers, we spend a great deal of our time hunting for the ultimate treasure of writing perfect code. While writing this book, we were faced with quite the opposite chore—the need to write not-so-perfect code to illustrate common pro-gramming mistakes.
The sample code is structured to achieve one goal: present examples of common programming mistakes in the shortest and most concise fashion as to not pollute the basic principle of the programming mistake being examined. To satisfy the goal of short and concise examples, we had to, at times, concoct examples rather than use real-life examples. Even though the sample code is “made up,” it serves to simulate real-life examples, and every effort was made to ensure that the example stays true to the problem being examined.
All sample code is written in C/C++. We chose this language for two simple reasons:
■ C/C++ is predominantly used in Windows development.
All sample code is compiled and tested using the Windows Drivers Kit. The WDK was chosen so that readers would be able to enjoy learning the art of Windows debug-ging without being required to purchase a complete developer suite.
The source code assumes a Unicode environment, and as such Win32 API calls, as seen in the debugger, will be illustrated using the Unicode version of the API. For example, the sample code might show a call to the CreateProcess API, but when working in the debugger, the CreateProcessWAPI will be utilized. The API shown in the debugger is prefixed by the module name implementing the API. One exam-ple is the CreateProcessWAPI, which is implemented in kernel32.dll. It is often required to specify both the module name and the API name separated by the (!) character (kernel32!CreateProcessW).
All sample code and binaries are available on the book’s Web site (http://www.advancedwindowsdebugging.com). In addition to source code and bina-ries being available, the site acts as a symbol and source code server for the book’s binaries. When you try out the debugging sessions illustrated in the book, there is no need to download all the symbols for the binaries; rather, point your debuggers sym-bol path directly to the book’s symsym-bol server, and you can debug with remote symsym-bols. The sources are also retrieved by the source servers from the book’s Web site.
To provide a consistent learning experience, the binaries on the book’s Web site have been built as nonoptimized and checked releases for the x86 architecture using the Windows XP platform. We chose to use Windows XP as the common denomina-tor due to its widespread usage. If you choose to build the samples on your own using a different target platform, there might be minor variations in the debug output.
To build the samples on your own, simply open a WDK build window and type
build /ZCc from the directory containing the makefile. If the source code being compiled requires additional steps, those steps will be spelled out in the chapter dis-cussing the sample code.
Throughout the book, it is assumed that all binaries have been downloaded from the Web site and copied to the local hard drive (keeping the folder structure intact) to the following location: C:\AWDBIN, and the sources have been downloaded to the
C:\AWDfolder.
Conventions
debugger displays as a result of some action that the user takes. Typically, this debug spew consists of information shown in a very compact and concise form. In order to effectively reference bits and pieces of this data and make it easy for you to follow, the boldface and italic types are used. Additionally, anything with the boldface type in the debug spew indicates commands that you will be entering. The following exam-ple illustrates the mechanism.
0:000> ~*kb
. 0 Id: 924.a18 Suspend: 1 Teb: 7ffdf000 Unfrozen ChildEBP RetAddr Args to Child
0007fb1c 7c93edc0 7ffdf000 7ffd4000 00000000 ntdll!DbgBreakPoint
0007fc94 7c921639 0007fd30 7c900000 0007fce0 ntdll!LdrpInitializeProcess+0xffa 0007fd1c 7c90eac7 0007fd30 7c900000 00000000 ntdll!_LdrpInitialize+0x183 00000000 00000000 00000000 00000000 00000000 ntdll!KiUserApcDispatcher+0x7 0:000> dd 0007fd30
0007fd30 00010017 00000000 00000000 00000000 0007fd40 00000000 00000000 00000000 ffffffff 0007fd50 ffffffff f735533e f7368528 ffffffff 0007fd60 f73754c8 804eddf9 8674f020 85252550 0007fd70 86770f38 f73f4459 b2f3fad0 804eddf9 0007fd80 b30dccd1 852526bc b30e81c1 855be944 0007fd90 85252560 85668400 85116538 852526bc 0007fda0 852526bc 00000000 00000000 00000000
In this example, you are expected to type ~*kbin the debug session. The result of entering that command shows several lines, with the most critical piece of informa-tion being 0007fd30.Next, you should enter the dd 0007fd30command illustrat-ed to glean more information about the previously highlightillustrat-ed number 0007fd30.
All tools used in this book are assumed to be launched from their installation fold-er. For example, if the Windows debuggers are installed in the C:\Program Files\ Debugging Tools for Windowsfolder, the command line for launching windbg.exe will be shown as
Supported Windows Versions
Windows XP or higher is required to fully make use of this book. All sample code and debugging scenarios have been run on Windows XP SP2 or Windows Server 2003 SP1, depending on the requirements of the specific scenario. Please note that service packs or even specific patches can change the result of various commands, although these changes will not affect the overall outcome of what is being illustrated with the debug session.
Chapter 15, “Windows Vista Fundamentals,” covers the most important changes made in Windows Vista and includes debug sessions that must be run on a machine running Windows Vista.
Furthermore, all samples and debug sessions were run using the 32-bit version of Windows. Samples used in Chapter 12, “Bit Debugging,” were run using the 64-bit version of Windows XP.
Support
While every attempt has been made to make this book 100% accurate, without a doubt errors will be found. If you encounter an error in this book, feel free to contact us using any of the following resources:
Email: [email protected]
Writing a technical book is a large-scale effort, far more substantial than we had orig-inally anticipated. As authors, we provided the raw material and the first draft of the book, but throughout the project, a number of people shared their insights and expertise to make this book worth the time spent reading it.
Thanks to all the team members at Addison Wesley, especially Elizabeth Peterson, Jana Jones, Curt Johnson, Joan Murray, and Gina Kanouse. Chris Zahn also played an instrumental role in editing the book and in correcting our self-styled syntax.
As with any technical publication, technical accuracy is of utmost importance. We were fortunate to have great engineers (many of them own the specific technology areas discussed in the book) look at the material and provide feedback. Thanks go to Mark Russinovich, Ivan Brugiolo, Pat Styles, Pavel Lebedynskiy, Daniel Mihai, Doug Ellis, Cristi Vlasceanu, Adrian Marinescu, Saji Abraham, Kamen Moutafov, Kinshuman Kinshumann, Bob Wilton, Raymond McCollum, Viorel Mititean, Andy Cheung, Saar Picker, Drew Bliss, Jason Cunningham, Adam Edwards, Jen-Lung Chiu, Alain Lissoir, and Brandon Jiang.
Special thanks go to Mark Russinovich for not only reviewing the book but also writing the foreword. Mark’s remarkable body of work is well known among software developers and has been a great influence on us and countless other engineers.
Ivan Brugiolo was also instrumental in reviewing and providing in-depth feed-back. Ivan was incredibly generous with his spare time, sharing knowledge that has added considerable value to this book.
We also want to extend our gratitude to Alexandra Hewardt for designing and implementing the book’s Web page.
Mario Hewardt is a senior design engineer with Microsoft Corporation and has worked extensively in the Windows system level development arena for the past nine years. Throughout five releases of Windows (starting with Windows 98), he has worked primarily in the server and desktop management arena, focusing the majority of his time on ensuring the reliability, robustness, and security of the product.
Daniel Pravat is a senior design engineer with Microsoft Corporation and was actively involved in releasing several windows components in multiple Windows releases. Prior to joining Microsoft, he developed telecommunication software for computer-based telephony servers. He expects all software applications to be reliable, predictable, and efficient.
©www.BrookeClark.com
O
VERVIEW
Chapter 1
Introduction to the Tools . . . .3Chapter 2
Introduction to the Debuggers . . . .29Chapter 3
Debuggers Uncovered . . . .1233
I
NTRODUCTION TO THE
T
OOLS
Many books and articles have been written about the importance of proper software design and engineering principles. Some of the publications take a very balanced approach between methodology and practice, whereas others focus mostly on methodology. Books written about the importance of object-oriented design and pro-gramming, design patterns, or modular programming are all great examples of methodologies that help us write better software. Without a doubt, proper software methodologies are the precursors to all successful software projects. However, they are not the sole contributors to the success of the software. Regardless of how well we think that we can design software and regardless of how accurate we believe our scheduling to be, mysterious problems always plague us during the development process. Hectic schedules, complex component interactions, and legacy code are just some of the reasons why we cannot practically anticipate and solve all the problems by simply employing good development methodologies. In addition to the method-ologies, we have to know how to troubleshoot complex problems in a cost- and time-efficient manner.
This chapter introduces you to invaluable tools that will be of great aid in the trou-bleshooting process, as well as help reduce the time and money spent on handling a wide range of common problems. A lot of the problems that we discuss in this book leave developers feeling frustrated because of their complex nature. Even if a devel-oper has an idea of how to manually approach a particular problem, the effort of track-ing it down is typically very costly. Unbeknownst to many developers, help is out there; the help comes in the form of incredible tool sets that aid developers in tracking down and solving a lot of these types of problems. Not only does it help with the problem solving, but it does so in a very efficient manner.
problem. This chapter can be viewed as an introduction to the tool set that comple-ments its practical usage scenario in subsequent chapters in the book.
Note that the tools this chapter describes are the latest versions of each tool avail-able at the time of writing. Newer versions might have been published by the time you read this chapter. This does not constitute a problem, as the general tool behav-ior generally stays the same.
Leak Diagnosis Tool
Usage Scenarios Memory leak detection Current Version 1.25
Download Point ftp://ftp.microsoft.com/PSS/Tools/Developer Support Tools/LeakDiag
Analysis Mechanism Log Files
The Leak Diagnosis tool (LeakDiag) is a tool used during the memory leak detection process. It goes well beyond the basic capabilities of showing how much memory a process has leaked to detailed information, such as the exact stack trace that resulted in the allocation and allocation statistics.
The installation process for LeakDiag is trivial. Download leakdiag125.msi from the download point and use the default settings during the install process. The appli-cation is, by default, installed into C:\LEAKDIAG and can run in two modes. Specifically, it has a command-line version and a graphical user interface (GUI) ver-sion. The command-line version is called ldcmd.exe, and the GUI version is called leakdiag.exe. Both can be executed from the command line or by going to the Start button and selecting All Programs, LeakDiag.
Diag includes a superset of the capabilities of UMDH.exe (see the later section “UMDH”) in the sense that UMDH is only capable of showing allocations coming from the standard heap manager. LeakDiag extends this functionality to include not only the standard heap allocations, but also COM allocations (external and internal), virtual mem-ory allocations, and much more. All in all, the current version of LeakDiag supports six different allocators:
■ Virtual Allocator
■ COM AllocatorCoTaskMem ■ COM Private Allocator ■ C Runtime Allocator
The capability of LeakDiag to support all these allocators makes it a very flexible tool to be used for memory leak detection. Another significant difference from most other memory leak detection tools is the way in which LeakDiag collects memory-related activity. Rather than relying on the operating system support for recording memory allocation stack traces, LeakDiag uses Microsoft’s Detours technology to intercept calls to the memory allocators. By doing so, LeakDiag eliminates the need to enable stack tracing support in the operating system.
Figure 1.1 shows the start screen of the GUI version of LeakDiag. The LeakDiag interface has two main sections: the list of all running processes and the available memory allocators with associated action buttons. To start memory allocation tracking, simply select one of the running processes followed by the memory allocator that you want to track. Click the Start button, followed by the Log button. Reproduce the memory leak and click the Log button once again. When you are finished tracking, click the Stop button. LeakDiag outputs all the information into log files in XML for-mat. By default, the log files are written to C:\LeakDiag\logsand the log files are named by LeakDiag itself to guarantee a unique filename for each run.
1.
I
NTRODUCTION
TO
THE
T
OOLS
As with most memory leak detection tools, LeakDiag works on the basis of snapshot comparisons. By taking snapshots of all the memory allocations at regular intervals, LeakDiag is capable of taking a delta between snapshots to describe allocations that have not yet been freed (potential leaks). The Log button is the mechanism by which you take the snapshots.
LeakdDiag has a few options that allow you to customize the default behavior. By selecting the Options menu item on the Tools menu, you are presented with the Options dialog, as shown in Figure 1.2.
Figure 1.2
In the Options dialog, you can change the location of the log files, as well as specify the symbol path. As with most stack tracing tools, proper symbols are required for LeakDiag to be capable of producing useful stack traces. If you incorrectly specify the symbol path or the symbols are wrong, you will see only the addresses for each frame in the stack trace. Having said that, stack trace recording is an expensive operation that can dramatically alter the speed of execution. As a matter of fact, at times, the speed of execution can be altered to the point where the memory leak will not even surface (if it is because of concurrency and/or timing related issues). Fortunately, a check box also exists that allows you to disable the symbol resolution while logging. The Allocation size filter enables you to specify the range of allocation sizes that you want to track. Finally, stack depth enables you to specify the number of frames per stack trace that will be outputted to the log file.
The Microsoft Detours Library
Microsoft Detours is an innovative solution to the problem of instrumenting and/or improving existing code at the binary level. Historically, instrumenting and/or improving code involved simply changing the source code and recompiling. However, in today’s world of commercial development, you will rarely (if ever) have access to the source code for a component or product. Microsoft Detours allows you to intercept binary functions and provide your own detour function that can either completely replace the original function or add some code and then call the original function (via a trampoline). It does this seeming magic by replacing the first few instructions of the original function with an unconditional jump to the new func-tion. It is important to understand that this process happens at runtime and is not persisted, which in essence means that you can detour different instances of the same application inde-pendent of one another.
For more information on Microsoft Detours, please see http://research.microsoft.com/ sn/detours.
Debugging Tools for Windows
Usage Scenarios Collection of debuggers and tools Current Version 6.6.0007.5
Download Point http://www.microsoft.com/whdc/ddk/debugging/
Debugging Tools for Windows is a comprehensive, freely available package that con-tains powerful debuggers and tools to aid developers in becoming more efficient in their day-to-day jobs.
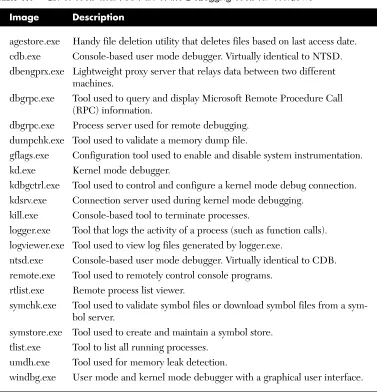
The download point allows you to choose between the 32- and 64-bit (Itanium and x64) versions. Setup is straightforward, and the express setup is sufficient to get all the necessary tools installed. One caveat exists; if you plan on developing custom debugger extensions (as we will show in Chapter 11, “Writing Custom Debugger Extensions”), you must do a custom install and elect to install the SDK as well. Table 1.1 shows all the tools that come as part of this package.
1.
I
NTRODUCTION
TO
THE
T
Table 1.1
Image Description
agestore.exe Handy file deletion utility that deletes files based on last access date. cdb.exe Console-based user mode debugger. Virtually identical to NTSD. dbengprx.exe Lightweight proxy server that relays data between two different
machines.
dbgrpc.exe Tool used to query and display Microsoft Remote Procedure Call (RPC) information.
dbgrpc.exe Process server used for remote debugging. dumpchk.exe Tool used to validate a memory dump file.
gflags.exe Configuration tool used to enable and disable system instrumentation. kd.exe Kernel mode debugger.
kdbgctrl.exe Tool used to control and configure a kernel mode debug connection. kdsrv.exe Connection server used during kernel mode debugging.
kill.exe Console-based tool to terminate processes.
logger.exe Tool that logs the activity of a process (such as function calls). logviewer.exe Tool used to view log files generated by logger.exe.
ntsd.exe Console-based user mode debugger. Virtually identical to CDB. remote.exe Tool used to remotely control console programs.
rtlist.exe Remote process list viewer.
symchk.exe Tool used to validate symbol files or download symbol files from a sym-bol server.
symstore.exe Tool used to create and maintain a symbol store. tlist.exe Tool to list all running processes.
umdh.exe Tool used for memory leak detection.
windbg.exe User mode and kernel mode debugger with a graphical user interface.
Not surprisingly, the most important tool is the debugger itself. Chapter 2, “Introduction to the Debuggers,” and Chapter 3, “Debuggers Uncovered,” are dedi-cated to explaining how the debuggers work, how to set them up, and how to most effectively use them.
Please note that at the time of writing, the most recent version was 6.6.0007.5. It is quite possible that a new version of the Windows debuggers will be released by the time you read this book. Even so, there should be relatively minor changes in the debugger output, and all the material in the book should still apply and be easily fol-lowed. The debugger download URL also keeps a history of debug versions (going back two to three releases) that can be downloaded. If you want to follow the same version, you can download the Debugging Tools for Windows corresponding to ver-sion 6.6.0007.5.
UMDH
Usage Scenarios Memory leak detection Current Version 6.0.5457.0
Download Point Part of Debugging Tools for Windows Analysis Mechanism Log files
UMDH is another form of memory leak detection tool that includes a subset of the functionality of LeakDiag. Whereas LeakDiag is able to track memory from a variety of allocators, UMDH is only capable of tracking memory that originates from the heap manager. In addition, it requires that user mode stack tracing is enabled in the operating system (see the “Global Flags” section of this chapter) to work properly.
Chapter 9 shows examples of how to use UMDH to track down memory leaks.
Microsoft Application Verifier
Usage Scenarios General application troubleshooting Current Version 3.3
Download Point http://www.microsoft.com/downloads/details.aspx? FamilyID=bd02c19c-1250-433c-8c1b-2619bd 93b3a2&DisplayLang=en
Analysis Mechanism Log files and debugger
1.
I
NTRODUCTION
TO
THE
T
Every serious developer needs to be aware of the Application Verifier tool. Enabling Application Verifier for your process allows you to catch a whole range of common programming mistakes. Examples include invalid handle usage, lock usage, file paths, and much more. It is good practice to always have Application Verifier enabled for all the processes involved during development time. Having said that, some test settings in Application Verifier can dramatically alter the speed of execution in your applica-tion and, as such, can cause timing-related issues not to surface. One common solu-tion to this problem is to always have Applicasolu-tion Verifier enabled, and at select milestones turn it off and run the entire test suite again to make sure that timing issues are not a problem. Another good time for Application Verifier to be enabled is when the product is in bug fixing mode. By running with Application Verifier enabled, you can make sure that regressions are not introduced when fixing bugs.
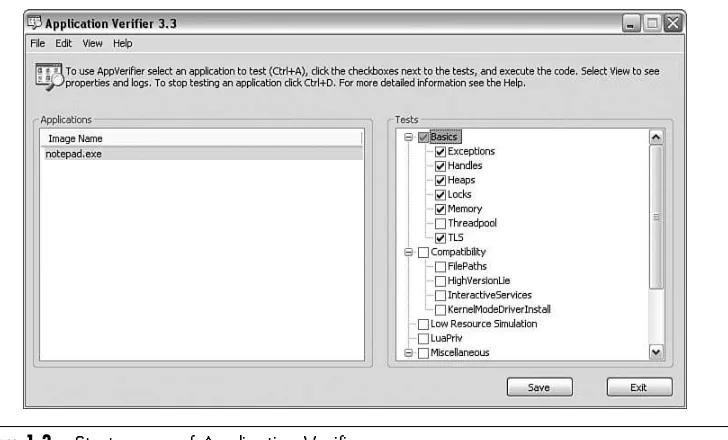
Installation of Application Verifier is straightforward using the default install set-tings. After the installation completes, you can start Application Verifier by going to the Start button and then selecting All Programs, Application Verifier. Figure 1.3 shows the start screen presented when launching Application Verifier.
The Applications pane shows all applications currently enabled for verification. You can add applications by selecting the Add Application option from the File menu. Reciprocally, you can also remove applications by selecting the application and select-ing the Delete Application menu item from the File menu.
To change the settings for a particular application, select the application in the left pane and choose the Property Window on the View menu. This adds a property section to the bottom of the start window that allows you to control the following behaviors:
■ Propagate: Controls whether the test settings of this image will be propagated to child processes. Enabling this property causes the test settings to propagate. ■ AutoClr: If enabled, causes Application Verifier to disable all test settings of
this image once it starts running.
■ AutoDisableStop: If enabled, causes Application Verifier to report a given problem only once.
■ LoggingWithLocksHeld: If enabled, causes Application Verifier to log the DLL load and unload events. Note that this might cause problems in the appli-cation since logging requires I/O that is performed during the execution of the DllMain code path.
To get a brief description of each test setting, you can hover over the test setting to open up a balloon tip. The balloon tip will also tell you whether a debugger is required to see the results of the tests.
To get more details or for configuration settings for each test setting, you can right-click on the test setting and choose from one of two options.
■ Properties: Allows you to control the properties of the selected test. For exam-ple, choosing properties on the Handles test allows you to control the number of traces that will be recorded for handle tracking. Note that the Properties selection is not available for all test settings.
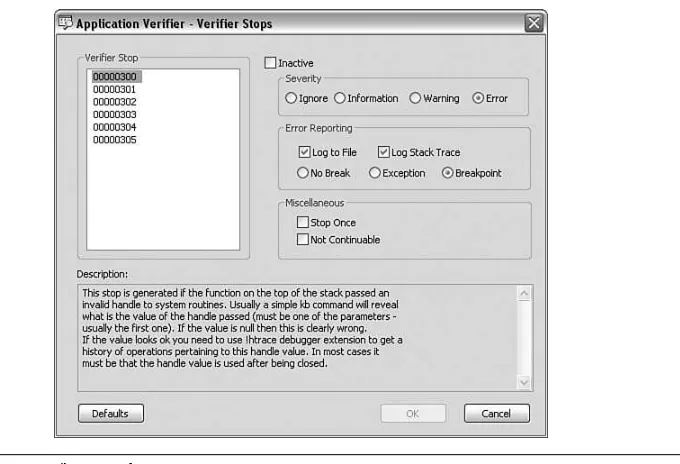
■ Verifier Stop Options: Allows you to control the options for the selected test. Figure 1.4 illustrates the verifier stop options menu selection when used on the Handles test setting.
1.
I
NTRODUCTION
TO
THE
T
Figure 1.4
The Application Verifier Stop options are further divided into several sections:
■ The Verifier Stop Section contains a list of all the verifier stops that the test set-ting is capable of performing. In Figure 1.4, the Verifier Stop section shows that six stops are available when verifying handles. All other sections in this window work on the basis of a selected stop code.
■ The Description section gives a detailed description of the selected verifier stop.
■ The Inactive check box controls whether the selected verifier stop is active or inactive, enabling you to control the granularity of the test setting.
■ The Severity section allows you to control how severe you consider the stop code to be. Depending on what choice is made, it will have a direct impact on how the stop is surfaced. For example, setting the verifier stop 00000300 to Ignore causes the stop, when triggered, not to break into the debugger. ■ The Error Reporting section allows you to control in more detail what should
it should log the stack trace for the stop. The radio buttons control the debug-ger behavior when the stop occurs. You can set it to execute a breakpoint, throw an exception, or not break at all.
■ The Miscellaneous section controls the frequency of the stop. If the Stop Once check box is selected, the stop will only occur the first time it is encountered. If the Non Continuable check box is selected, the debugger will break in when a stop occurs, and you will not be able to recover from the stop—in essence, preventing you from continuing process execution.
The next section of the start screen (refer to Figure 1.3), the Tests pane, shows all available test settings. Selecting the check box enables that particular test setting for the selected process. Right below the Tests pane is a short description of the test set-ting itself.
After an application has been enabled for verification, you can simply run the application, and Application Verifier will work in the background. Depending on how each test setting is configured, there are two primary ways to see the results of an Application Verifier run. The first way is to view the associated log file by selecting the Logs menu item from the View menu and then selecting the application log you are interested in. It is important to note that not all test settings report their results using log files. Some of the test settings require a debugger to get the desired results. To see which test settings require a debugger, simply hover over the test setting to get the context-sensitive help. If a test setting requires a debugger, you must run the application under the debugger to see the results.
When Application Verifier requires a debugger to be attached, the output of a violation observes the following general outline:
VERIFIER STOP <stop-code>: <process-PID>: <message> parameter-1: <description>
parameter-2: <description> parameter-3: <description> parameter-4: <description>
The stop-code indicates the particular violation that occurred, the PID shows the process ID of the faulting process, and the message gives a brief textual description of the fault. The parameter list is dependent on the type of test being performed.
For example, the following output shows the violation as reported by the Application Verifier when trying to close an invalid handle:
1.
I
NTRODUCTION
TO
THE
T
=======================================
VERIFIER STOP 00000300 : pid 0xFF0: Invalid handle exception for current stack trace.
C0000008 : Exception code.
0007FBD4 : Exception record. Use .exr to display it. 0007FBE8 : Context record. Use .cxr to display it. 00000000 : Not used.
======================================= This verifier stop is continuable. After debugging it use `go’ to continue.
=======================================
Using the GUI mode to enable tests for an application is quite convenient, but some-times it is necessary to enable tests in an automated fashion. Let’s say that the prod-uct you are working on is built every night, and automated tests are launched right after the build completes. As part of this test suite, the quality assurance team has requested that Application Verifier be enabled during testing. Rather than having an engineer manually use the GUI mode version of Application Verifier and enable the tests each night, he can simply write a script that uses the console mode version to enable the tests. The default installation path for application verifier is
C:\windows\system32\appverif.exe
When you launch the appverif.exe executable with the /? switch, you will see the
following:
Application Verifier 3.3.0045
Copyright (c) Microsoft Corporation. All rights reserved.
Application Verifier Command-Line Usage:
-enable TEST ... -for TARGET ... [-with [TEST.]PROPERTY=VALUE ...] -disable TEST ... -for TARGET ...
-query TEST ... -for TARGET ...
-configure STOP ... -for TARGET ... -with PROPERTY=VALUE... -verify TARGET [-faults [PROBABILITY [TIMEOUT [DLL ...]]]] -export log -for TARGET -with To=XML_FILE [Symbols=SYMBOL_PATH] [StampFrom=LOG_STAMP] [StampTo=LOG_STAMP] [Log=RELATIVE_TO_LAST_INDEX]
-delete [logs|settings] -for TARGET ...
-logtoxml LOGFILE XMLFILE
(For descriptions of tests, run appverif.exe in GUI mode.)
Examples:
appverif -enable handles locks -for foo.exe bar.exe (turn on handles locks for foo.exe & bar.exe)
appverif -enable heaps handles -for foo.exe -with heaps.full=false (turn on handles and normal pageheap for foo.exe)
appverif -enable heaps -for foo.exe -with full=true dlls=mydll.dll (turn on full pageheap for the module of mydll.dll in the foo.exe appverif -enable * -for foo.exe
(turn on all tests for foo.exe) appverif -disable * -for foo.exe bar.exe
(turn off all tests for foo.exe & bar.exe) appverif -disable * -for *
(wipe out all the settings in the system)
appverif -export log -for foo.exe -with to=c:\sample.xml
(export the most recent log associated with foo.exe to c:\sample.xml) appverif /verify notepad.exe /faults 5 1000 kernel32.dll advapi32.dll
(enable fault injection for notepad.exe. Faults should happen with probability 5%, only 1000 msecs after process got launched and only for operations initiated from kernel32.dll and advapi32.dll)
To enable all Application Verifier tests for a given executable, you could use the fol-lowing command line:
appverif.exe –enable * -for myexecutable.exe
In addition to enabling tests for a given application, it is also possible to control Application Verifier from the debugger. The extension command used to control Application Verifier from the debugger is !avrf. For a complete listing of all the available test settings, see Appendix A, “Application Verifier Test Settings.”
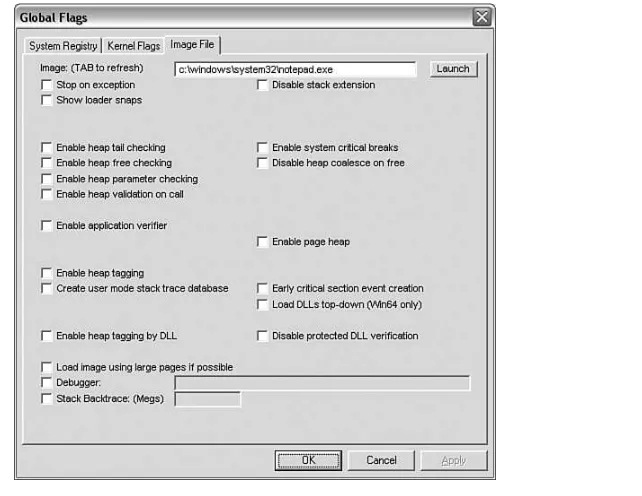
Global Flags
Usage Scenarios Configuration Current Version 6.6.0007.5
Download Point Part of Debugging Tools for Windows Executable gflags.exe
The Global Flags application (gflags) is installed as part of the Debugging Tools for Windows, and the executable (gflags.exe) can be launched from the default installa-tion path. For example, on my system, I would use the following command line to start gflags:
c:\>gflags.exe
Many of the tools we use in this book rely on support from Windows to function prop-erly. For example, UMDH requires that the Create user mode stack trace database option be enabled. Global Flags (or gflags) is the one-stop configuration tool for all the various options available.
GUI Mode
1.
I
NTRODUCTION
TO
THE
T
OOLS
Figure 1.5
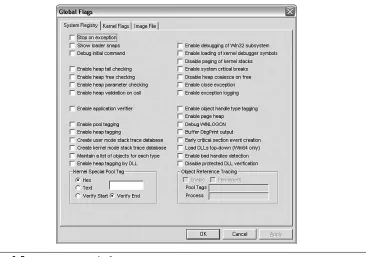
The System Registry tab shows the options available on a systemwide basis, and the Image File tab shows the options available on a per-process basis. If you change any of the systemwide settings, a reboot is generally required. The Kernel Flags tab shows the options that affect the running kernel only. For a per-process setting, the process must be restarted before the settings will take effect.
Because the options available in gflags configure various aspects of the operating system, where are the settings stored, and how are they interpreted? The answer: the Registry. Depending on whether you change systemwide settings or per-process set-tings, they are stored in different locations in the Registry:
■ Systemwide settings: HKEY_LOCAL_MACHINE\SYSTEM\ CurrentControlSet\Control\SessionManager\GlobalFlag
The per-process Registry path has some interesting properties associated with it. In addition to storing the global flags in the GlobalFlag value, other useful settings can be stored there. For example, if you are trying to debug a process not directly start-ed by yourself (such as a service startstart-ed by the service control manager), you can enable debugging of that process by specifying the following registry value:
HKEY_LOCAL_MACHINE\SOFTWARE\Microsoft\Windows NT\Current Version\Image File Execution Options\<Image File Name>\Debugger
You can specify the debugger of choice that you want launched when the process starts. We will see how this feature can be used in more detail in Chapter 2.
The Image File tab allows you to enable instrumentation on a per-process basis. Figure 1.6 shows the available options.
When you first navigate to this tab, all the options will be grayed out until you specify an image name in the Image text field and press the Tab key.
Command-Line Mode
In addition to the GUI mode, gflags can be run on the command line. The options available on the command line mimic the options in GUI mode:
usage: GFLAGS [-r [<Flags>]] |
[-r +spp TAG | -r +spp SIZE | -r -spp | [-k [<Flags>]] |
[-i <ImageFileName> [<Flags>]] |
[-i <ImageFileName> -tracedb <SizeInMb>] | [-p <PageHeapOptions>] (use `-p ?’ for help) |
Each of the options is explained a bit more in the following list:
■ -r controls the persistent options for the entire system (analogous to the System Registry tab in GUI mode).
■ -kcontrols current kernel options (analogous to the Kernel Flags tab in GUI mode).
■ -i controls options on a per-image basis (analogous to the Image File tab in GUI mode).
■ -pcontrols pageheap options (analogous to the Verifier tab in GUI mode).
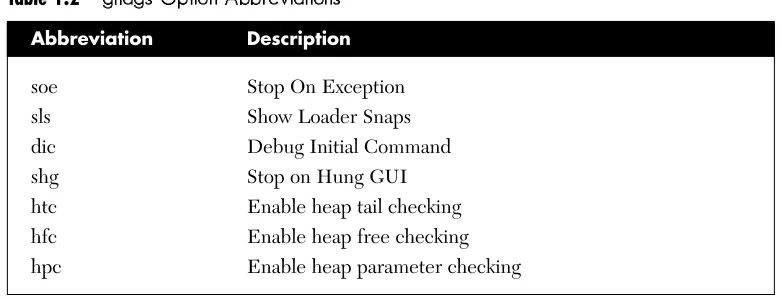
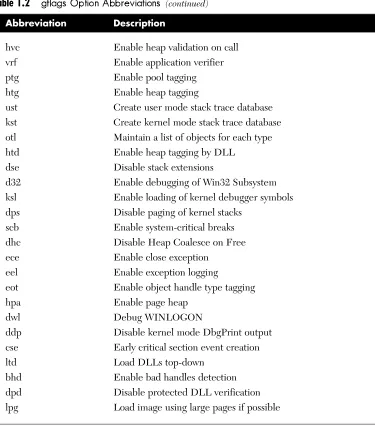
Each of the preceding switches can either display the current settings for the particu-lar switch or modify the settings according to the flags specified. If you simply want to see what the settings are, specify the switch (such as –i notepad.exe) without the flags. If you want to enable the settings, the flags can be specified as either a hexadeci-mal number or an abbreviation that represents the gflags option. Table 1.2 shows the available abbreviations.
Table 1.2
Abbreviation Description
soe Stop On Exception
sls Show Loader Snaps
dic Debug Initial Command
shg Stop on Hung GUI
htc Enable heap tail checking
hfc Enable heap free checking
hpc Enable heap parameter checking
1.
I
NTRODUCTION
TO
THE
T
OOLS
hvc Enable heap validation on call
vrf Enable application verifier
ptg Enable pool tagging
htg Enable heap tagging
ust Create user mode stack trace database kst Create kernel mode stack trace database otl Maintain a list of objects for each type
htd Enable heap tagging by DLL
dse Disable stack extensions
d32 Enable debugging of Win32 Subsystem
ksl Enable loading of kernel debugger symbols dps Disable paging of kernel stacks
scb Enable system-critical breaks
dhc Disable Heap Coalesce on Free
ece Enable close exception
eel Enable exception logging
eot Enable object handle type tagging
hpa Enable page heap
dwl Debug WINLOGON
ddp Disable kernel mode DbgPrint output cse Early critical section event creation
ltd Load DLLs top-down
bhd Enable bad handles detection
dpd Disable protected DLL verification lpg Load image using large pages if possible
To set a specific option, use +<abbreviation>; to deselect a specific option, use -<abbreviation>. For example, if you wanted to enable the user mode stack trace database for notepad.exe, you would use the following command line:
C:\> gflags /i notepad.exe +ust
Current Registry Settings for notepad.exe executable are: 00001000 ust - Create user mode stack trace database
Reciprocally, if you wanted to disable the same option, you would use
C:\> gflags /i notepad.exe -ust
Current Registry Settings for notepad.exe executable are: 00000000
If you simply wanted to find out what the settings are for a particular image, you would use the following:
C:\> gflags /i notepad.exe
Current Registry Settings for notepad.exe executable are: 00000000
To see what options are available for pageheap and Application Verifier, you can use
C:> gflags.exe /p /?
and
C:> gflags.exe /v /?
The final switch of importance is the –tracedbswitch, which allows you to specify the size of the stack trace database. If enough activity exists in the system, the max size can easily be reached. This switch allows you to customize the size of the database.
We will not discuss the meaning behind all the different gflags options in this chapter, as this discussion is intended to merely serve as an introduction to the tool. Throughout Part II, “Applied Debugging,” we will use the various settings exported by gflags to show how they can be leveraged to track down some really interesting and tough problems.
Process Explorer
Usage Scenarios Analyze overall system and process health Current Version 10.2
Download Point http://www.microsoft.com/technet/sysinternals/ ProcessesAndThreads/ProcessExplorer.mspx Executable procexp.exe
1.
I
NTRODUCTION
TO
THE
T
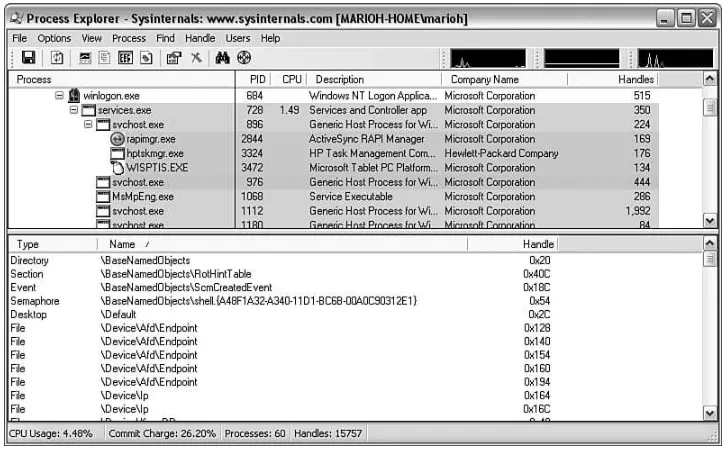
Process Explorer is a tool originally developed by the team over at SysInternals that is now part of Microsoft TechNet. Process Explorer is most easily described as a pow-erful alternative to the Windows Task Manager. It gives detailed information about all the processes currently running on the system. Features include
■ Detailed handle usage, which includes the handle type as well as its name. It also provides detailed information per handle, which includes reference count, signal state, and more.
■ Powerful search capabilities allow you to search for handles by name or type across all processes or, alternatively, search for any process that has a particu-lar file loaded.
■ Detailed process information, such as thread utilization, performance history, security, and much more.
The tool is so powerful that most users who use it end up never going back to the tra-ditional Windows Task Manager. As a matter of fact, one of the Process Explorer options is Replace Task Manager.
Installation of the tool comes in the form of a zip file from which you simply extract the contents to a location of choice. The executable name is procexp.exe. Figure 1.7 shows how Process Explorer looks when you first start it.
By default, Process Explorer consists of two main views. The top view lists all the processes currently running on the system, and the bottom view shows all handles that the process has open (as well as the name of the handle). The columns of the top view can be customized by right-clicking on the column status bar and selecting the Select Columns menu. The bottom view can be changed from listing handles to listing DLLs by choosing DLLs from the Lower Pane View menu on the View menu.
We will be using Process Explorer in Chapter 9 to illustrate how the tool can be used to aid in tracking down resource leaks.
Process Monitor
Process Monitor, which is another recently released tool, is related to Process Explorer. Process Monitor is an advanced monitoring tool that shows file system, registry, and process/thread activity. We use the tool in several chapters in the book. The tool is free of charge and can be downloaded from http://www.microsoft.com/technet/sysinternals/utilities/processmonitor.mspx.
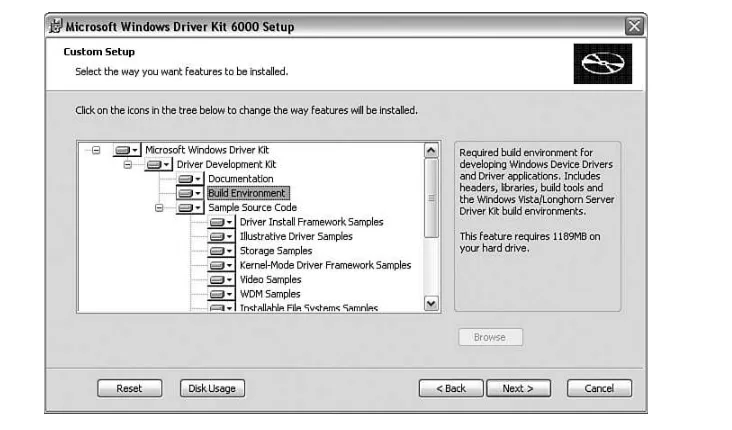
Windows Driver Kits
Usage Scenarios General development Current Version WDK 6000
Download Point Can be downloaded from http://www.microsoft. com/whdc/devtools/wdk/betawdk.mspx
The Windows Driver Kits (WDK) is a powerful and complete build environment that can be used for production development. This development environment is truly remarkable because it includes a large number of powerful development tools (includ-ing the compiler and linker) and is available free from Microsoft.
The WDK supports building for all Windows versions starting with Windows XP up to and including Windows Vista. This allows development targeting the x86, x64, and Itanium architectures.
Installation of the WDK is straightforward, and typically, choosing the default set-tings is sufficient. When the installation begins, you will be asked to install the pre-requisite setup packaged (packages such as the .NET framework 2.0). Once the installation of those packages is complete, you can select to install the WDK.
Figure 1.8 shows the various options available during installation.
1.
I
NTRODUCTION
TO
THE
T