DETERMINATION OF CHOLESTEROL OXIDATION
PRODUCTS IN PORK FLOSS BY GAS CHROMATOGRAPHY
– FLAME IONIZATION DETECTOR
PRACTICAL TRAINING REPORT
This practical training report is submitted for the partial requirement for
Bachelor Degree
By:
JESSICA ASTELIA 14.I1.0130
DEPARTMENT OF FOOD TECHNOLOGY
FACULTY OF AGRICULTURAL TECHNOLOGY
SOEGIJAPRANATA CATHOLIC UNIVERSITY
SEMARANG
i
DETERMINATION OF CHOLESTEROL OXIDATION
PRODUCTS IN PORK FLOSS BY GAS CHROMATOGRAPHY
– FLAME IONIZATION DETECTOR
Practical Training at Fu Jen Catholic University, New Taipei City, Taiwan
By: Jessica Astelia Student ID : 14.I1.0130 Faculty : Agricultural Technology
This Practical training report has been approved and supported by examiner in Practical Training Exam on 7th of March 2017:
Semarang, 7th of March 2017 Department of Food Technology Faculty of Agricultural Technology Soegijapranata Catholic University
Practical Training Advisor I Practical Training Advisor II
Prof. Bin-Huei Chen Dr. Ir. B. Soedarini, MP.
Dean
ii
PREFACE
Praise the Lord because of His grace and blessing, author would have the opportunity to
undergo the practical training and finish the report. This report is complete
accountability from the practical training which was done in Fu Jen Catholic University,
New Taipei City, Taiwan that take place from January 4th until February 28th 2017.
During the training, the author did the research entitled: “Determination of Cholesterol
Oxidation Products in Pork Floss by Gas Chromatography – Flame Ionization
Detector”. This report was written as a requirement to acquire Bachelor Degree of Food
Technology in Soegijapranata Catholic University, Semarang, Indonesia.
The author would not be able to finish this task alone, and only by support and guidance
given by people around the author, this report could be finished. Special thanks for:
1. Dr. V. Kristina Ananingsih, ST, MSc. as a Dean of Faculty of Agricultural
Technology, Soegijapranata Catholic University for giving the opportunity to
join this practical training.
2. Prof. Bin-Huei Chen as the advisor from Fu Jen Catholic University for giving
guidance and supporting all the time during the practical training.
3. Dr. Ir. B. Soedarini, MP. as the advisor from Soegijapranata Catholic University
for always taking care and giving advices during the practical training.
4. Che-Wei, Lauren, Jerry, Kyle, Yi-Fen, Jun-Yu, and Hua as the students in Fu
Jen Catholic University (EP310) and all of the friends from Taiwan that author
can’t mentioned one by one who always support and accompany author.
5. My family who always support and cheer everyday
6. Denny and Fia who has been the practical training mates during the practical
training program.
The author realizes that this report is still far from perfect and there are still many
shortcomings due to the limitation of the author. However, author hopes that this report
iii
Semarang, March 7th 2017
iv
1.1. Background of Practical Training ... 1
1.2. Purpose ... 1
1.3. Time and Place ... 2
2. INSTITUTION PROFILE ... 3
2.1. Fu Jen Catholic University ... 3
2.2. Department of Food Science... 4
2.3. Mission of Faculty ... 4
3. RESEARCH PROJECT ... 5
3.1. Research Overview ... 5
3.2. Background of Research ... 5
3.3. Pork Floss ... 6
3.4. Cholesterol Oxidation Products ... 6
3.5. Sample Extraction ... 7
3.6. Gas Chromatography – Flame Ionization Detector Analysis (GC-FID) ... 7
4. RESEARCH METHODOLOGY ... 8
4.1. Materials ... 8
4.2. Statistics Tool ... 8
4.3. Methods ... 8
4.3.1. Pork Floss Preparation ... 8
4.3.2. Sample Extraction ... 9
4.3.3. Gas Chromatography – Flame Ionization Detector Condition ... 9
v
5. RESULT AND DISCUSSION ... 11
5.1. QuEChERS Method Development ... 11
5.2. Gas Chromatography Method Development ... 12
5.3. Identification Method ... 13
5.4. Quantification Method ... 15
5.5. Analysis of Cholesterol Oxidation Products (COPs) in Pork Floss ... 18
6. CONCLUSIONS AND RECOMMENDATION ... 23
6.1. Conclusions ... 23
6.2. Recommendation ... 23
7. REFERENCES ... 24
vi
LIST OF TABLES
Table 1. Retention time (Rt), retention factor (κ) aand separation factor (α) b
vii
LIST OF FIGURES
Figure 1. Map of Fu Jen Catholic University, New Taipei City, Taiwan ... 2
Figure 2. Logo of Fu Jen Catholic University ... 3
Figure 3. Logo of Department of Food Science FJU ... 4
Figure 4. Principle of Gas Chromatography - Flame Ionization Detector ... 12
Figure 5. Co-Chromatography ... 14
Figure 6. The chemical structure of (a) 5-α-Cholestane (b) Cholesterol ... 16
Figure 7. GC Chromatogram of COPs standards ... 16
Figure 8. The calibration curves of COPs standard ... 17
1 1. INTRODUCTION
1.1. Background of Practical Training
Nowadays, people not only looking for the delicious food, but also pay attention to the
nutritional value contained. From here, we know how important food technologist is to
fulfill the demands of consumers. We should be aware for the changing of food
products demand. These facts become the main reason to conduct the practical training
for students from Food Technology Department, Soegijapranata Catholic University,
Semarang, Indonesia. Besides, we also can exchange some knowledge about the
development of food technology in each country. This program is one of the
requirement to gain Bachelor Degree in Faculty of Agricultural Technology,
Department of Food Technology, Soegijapranata Catholic University, Semarang,
Indonesia.
Food Science Department, Fu Jen Catholic University, New Taipei City, Taiwan, is
chosen as the practical training work because this faculty is advanced in the field of
food processing and development, which is become important recently. During this
practical training, one of the graduate student will help us to doing the research and
become the assistant. This practical training program give opportunity to do research
abroad and experiencing another culture from global citizen.
1.2. Purpose
The practical training in Fu Jen Catholic University, New Taipei City, Taiwan has
purpose:
1. To give an experience about doing food research abroad with the new
environment
2. To give an opportunity to adapt with new circumtances and society in another
country.
3. To sharpen and broaden knowledge and experience.
2
1.3. Time and Place
The practical training was conducted in Food Science Department, Fu Jen Catholic
University, New Taipei City, Taiwan. This activity took place between January 4th until
February 28th 2017.
Figure 1. Map of Fu Jen Catholic University, New Taipei City, Taiwan
The red indicates the location of Fu Jen Catholic University which is located in No. 510
Zhongzheng Rd, Xinzhuang District, New Taipei City, 24205, Taiwan (R.O.C)
3 2. INSTITUTION PROFILE
2.1. Fu Jen Catholic University
Fu Jen Catholic University (FJU) is the first university in China that founded in Beijing
in 1925 by the Bendedictines of Saint Vincent Archabbey. Fu Jen Catholic University is
also called Fu Jen or Fu Da. Moved by Christian understanding of love and inspired by
the high ideals of Confucian education; it adopted the name “Fu Jen” to give expression
to its universal vision and mission realized through holistic education. Fu Jen also hopes
to serve society through various additional academic programs and community services.
Fu Jen University has history of 80 years, and provides the country with good educated
students characterized by integrated physical, social, intellectual, aesthetic, moral, and
spiritual development which have contributed greatly in all fields in society.
Fu Jen is noted for attracting foreign students from another country include Indonesia.
Fu Jen provides 11 colleges such as Liberal Arts, Arts, Communication, Education,
Medicine, Science and Engineering, Foreign Languages, Human Ecology, Law, Social
Sciences, Management; 48 departments, 47 master’s programs, 23 in-service master’s
programs, 11 Ph.D. programs and School of Continuing Education. The land capacity of
the university is about 35 hectars and current student enrollment is 26,000. The
University has about 120 relations with the other universities in the world.
4
2.2. Department of Food Science
In 1963, Department of Family Studies and Nutrition Sciences was established and
grouped into the Family Studies and the Nutrition Sciences section. Nutrition Sciences
section was combined with the Food Sciences section as the Department of Nutrition
and Food Sciences in 1971. The Graduate Institute of Nutrition and Food Sciences was
established in 1983 and started to offer a master’s degree program. The doctoral
program was joined to the Institute in 1995. Food Sciences section became an individual
department in 2006. The Department of Food Science offers Bachelor’s degree program
and Master’s degree program.
Figure 3. Logo of Department of Food Science FJU
2.3. Mission of Faculty
Uphold the spirit of pursuing truth, goodness, beauty and holiness, the Department of
Food Science at Fu Jen Catholic University integrates basic sciences with latest
technology for excellence education, research, and service. We are committed to
promote the healthier, tastier and safer for improving eating quality, human health and
5 3. RESEARCH PROJECT
3.1. Research Overview
The topic of the research is “Determination of Cholesterol Oxidation Products in Pork
Floss by Gas Chromatography – Flame Ionization Detector”. There are seven kinds of
standard solutions. Then there are five pork floss samples extracted with QuEChERS
method at day one, five, and ten. The objective of this research is to determine the
different formation of COPs in pork floss during storage at room temperature. The
advisor of this research is Prof. Bin-Huei Chen.
3.2. Background of Research
Nowadays, people more consider about the relationship between food products and
health. Many studied been widely encourage to improve people dietary habits.
Processed meat products are highly consumed by people, however they are not
considered healthy because a high consumption of meat products may be increase the
risk of several cancer (WHO, 2015). Cholesterol contents of meat and meat products
varied considerably, but in general it is less than 70 mg/100 g except for edible offal and
it is assumed that one-third of daily intake come from meat and meat products
(Chizzolini et al., 1999). Cholesterol is an important biological compound, but its oxidation products can be harmful for human health.
Cooking is essential as it improves taste, digestibility, and extends shelf life. However,
this method is related to the formation of Cholesterol Oxidation Products (COPs).
Cooking, dehydration during storage, and radiation are some of the main causes of
cholesterol oxidation in food products of animal origin. COPs have been proven to be
cytotoxic, mutagenic, and carcinogenic, and also considered to be a primary factor
responsible for atherosclerosis (Khan et al., 2015). In general, healthy human plasma contains 12.6 mg/L of COPs and consumption of foods containing COPs will increases
these levels in plasma which leads to negative health effects (Linseisen & Wolfram,
1998). Hence, this study aimed to determine the formation of COPs in meat products,
6
3.3. Pork Floss
Pork floss is a popular traditional Chinese dried meat with a light and crispy texture.
People usually used it as a topping for many foods or eat it as a snack. It is prepared by
boiling fresh raw pork until the muscle fibers could easily separate. Followed by
cooling, pressing, and then adding the various additives, such as sugar, salt,
monosodium glutamate, edible oil, sauce, and spices. Then the cooked pork stir fried for
about 1 hour until turned out to brown-colored in a shredded form (Liao et al., 2009). However, no information is available for the variety and amount of COPs in pork floss.
3.4. Cholesterol Oxidation Products
Cholesterol is a steroid which is biosynthesized by all animal cells that has many
metabolic functions. Animal products are the major source of cholesterol in the diet.
Although cholesterol is a relatively stable compound, it can be oxidized under mild and
harsh conditions, processing step, and storage time (Garcia-Marquez et al., 2014). Cholesterol oxidation reactions resulting a wide range of secondary products which
called COPs. COPs are group of sterols that are similar in structure to cholesterol but
contains an additional hydroxy, ketone or epoxide group on the sterol nucleus and/or a
hydroxyl group on the side chain of their molecules (Hur et al., 2007).
There are several factors that influence the formation of COPs: presence of oxygen,
light (photo-oxidation), high temperatures, and other factors (Ahn et al., 2001). Thereby, we can delay their formation by using the packaging materials that can help
avoid the entrance of air and light, stored it with the right temperature, and adding the
antioxidant (Garcia-Marquez et al., 2014). COPs are considered more harmful than cholesterol and they have been shown to be cytotoxic, atherogenic, mutagenic and
carcinogenic. So, a high consumption of COPs has an adverse effect on human health.
The most common products of cholesterol oxidation found in foods are 7α
-hydroxycholesterol (7α-OH); 7β-hydroxycholesterol (7β-OH); 5,6β-epoxide (5,6β-EP);
5,6α-epoxide (5,6α-EP); cholestanetriol (triol); 25-hydroxycholesterol (25-OH);
7
3.5. Sample Extraction
Quick, Easy, Cheap, Effective, Rugged, and Safe (QuEChERS) is a method that we
used for extracting sample in this research. However, the QuEChERS method is popular
in the analysis of pestcides and other compounds in huge variety of food products. This
method has important advantages over another extraction methods which are enable
yielding high recovery rates for wide range of analytes, very accurate results, high
sample throughput, low solvent consumption and very small waste generation (Lehotay
et al., 2005). This method involves two simple steps. First, the homogenized samples
are extracted and partitioned using an organic solvent and salt solution. Then, the
supernatant is purifying using dispersive solid-phase extraction (d-SPE) (Schenck and
Hobbs, 2004). The main factors considered in initial extraction and extraction part are
the type and amount of extraction solvent, sample amount, and sample/solvent ratio. For
clean up stage, the major problem are the type and amount of sorbent and their
selectivity (Rejczak and Tuzimski, 2015). Organic solvent extraction is then followed
by derivatization and analyzed by gas chromatography.
3.6. Gas Chromatography – Flame Ionization Detector Analysis (GC-FID)
GC is a dynamic method for separation and detection volatile organic compounds in a
gas mixture, which commonly used to estimate the concentration of a substance in the
gas phase. There are several types of detector and we used FID for this research. FID
will ionization the organic compound by burning the compounds in the hydrogen and
air. This detector is the most common used for gas chromatography because it has high
sensitivity for various components and worked at various concentrations (Grob & Barry,
2004). The detector is placed in the end of the column and will present the
8 4. RESEARCH METHODOLOGY
4.1. Materials
Materials that used for this research are 5 different brand (©) of pork floss. A 味小寶
wèi xiǎo bǎo (味全-wèi quán), B 義美 yìměi (義美-yìměi), C 得意的一天 déyì de
yītiān (佳格-jiā gé), D 新東陽 xīn dōngyáng (新東陽-xīn dōngyáng ), E is lab-made, deionized water, acetone, extraction powder, d-SPE sorbent, pyridine, nitrogen,
derivation agent (Sylon BTZ), and standard (7α-OH, 7β-OH, 5,6β-EP, 5,6α-EP, triol,
25-OH, 7-keto) purchased from Sigma (St. Louis, MO, USA), fresh pork, water, salt,
sugar, monosodium glutamate, soy sauce, lard, spices, gravy.
4.2. Statistics Tool
Statistic tools that used for this research are An Agilent Technologies series HP6890
Gas Chromatographic system equipped with a flame ionization detector (GC-FID),
centrifuge Sorvall RC5C High Speed Centrifuge, Du Pont, USA (Wilmington,
Delaware, USA), centrifuge tube, eppendorf tubes, beaker glass, micropipette, tips,
scale, filter, ceramic stone (10 x 25 mm), vortex mixer, syringe, pressure cookers,
wooden mallet.
4.3.Methods
4.3.1. Pork Floss Preparation
Sample E that we used for this research was made in Fu Jen Laboratory. First step, 1200
gram of fresh pork was boiled with the pressure cookers for 1 hour until the muscle
fibers could easily separate. After that, cooling it for a while and using a wooden mallet
to smash the muscle fiber and shredded it. Followed by mixing it with the various
additives, such as 20% sugar, 1.6% salt, 1% monosodium glutamate, 8% soysauce, 30%
gravy, and 0.1% spices, and stir fried the cooked pork. After 25 minutes, adding 14%
lard and cooked it for about 1 hour until turned out to brown-colored in a shredded
9
4.3.2. Sample Extraction
Standard solutions were prepared by dissolved the standards with pyridine. For sample
preparation, two grams of sample was dissolved in 10 ml of deionized water in the
centrifuge tubes. A ceramic stone homogenizers was put into the solution and then
vortex it for one minute. Then, the sample was added by 10 ml acetone and vortex it for
one minute. After that, added the extraction powder which consist of MgSO4 4 g and Na
Acetate 1 g. The tube was vortexed for one minute and centrifuged with 3000 rcf
(relative centrifugal force) for 10 minutes at 4oC. The supernatant (4 mL) from the
centrifugation process was collected and added to the d-SPE sorbent which consists of
900 mg MgSO4, 300 mg PSA, and 300 mg C18EC. The tube was vortexed for one
minute and centrifuged with 3000 rcf for 10 minutes at 4oC. Take 1 mL of the
supernatant into 1.5 mL eppendorf tube and dried it with nitrogen. After that,dissolving
it with 100 μl pyridine and vortexing it. The solution was filtered through a 0.22 μm
syringe filter (Nylon). Take 40 uL of sample solution, then add 20 μL of internal
standard and 40 μL of derivatization agent (sylon BTZ). Let the samples derivatized for
1 hour in the dark at room temperature. Next, 1 μL of the resulting solution injected into
GC-FID. Each sample was done in duplicate so there will be ten times extraction.
4.3.3. Gas Chromatography – Flame Ionization Detector Condition
The derivatized extracts were analysed by Gas Chromatography composed of Agilent
technologies series HP6890 and a flame ionization detector (FID). A DB-5MS capillary
column (30 m × 0.25 mm I.D., 0.25 μm ) was purchased from Agilent Technologies
(Palo Alto, CA, USA). A split injection ratio that we used was 1:1. Injection volume was 1 μL and the flow rate was 1 mL/min. Helium was used as the carrier gas. The initial oven temperature set as 230oC and raised to 290oC for 10oC/min and maintain for
9 minutes with the total time being 15 minutes. The condition of injection was set at
280oC, the detector temperature was 310oC, the flow rate of H2 was at 45 mL/min, and
10
4.3.4. Statistical Analysis
Statistical analysis was performed by one-way analysis of variation (ANOVA) using
SAS 9.4 and Duncan’s multiple range test was employed to differentiate the
11 5. RESULT AND DISCUSSION
5.1.QuEChERS Method Development
Sample we used for this research is pork floss. There are five different samples of pork
floss extracted in three different days. The different days is aimed to know the changes
of different COPs during storage at room temperature. First, two grams of sample was
dissolved in 10 mL of deionized water in the centrifuge tubes. A ceramic stone
homogenizers was put into the solution and then vortex it for one minute. Then, the
sample was added by 10 mL acetone and vortex it for one minute. The addition of an
inorganic salt into a mixture of solution causes salting out which will separate the
solution into two-layer. The extraction powder consists of MgSO4 4 g which contributes
to eliminate water and Na Acetate 1 g as the buffer to control the polarity of the
extraction solvents. The tube was vortexed for one minute and centrifuge with 3000rcf
for 10 minutes at 4oC. The supernatant (4 mL) from the centrifugation process collected
and added to the d-SPE sorbent which consists of 900 mg MgSO4, 300 mg PSA, and
300 mg C18EC. PSA and C18 is commonly applied to remove impurities such as sugar,
fatty acid, organic acid, and lipid (Rejczak and Tuzimski, 2015).
Then the tube was vortex for one minute and centrifuge with 3000 rcf for 10 minutesat
4oC to increase distribution of the SPE material and contribute the clean-up process.
Take 1 ml of the supernatant into 1.5 mL eppendorf tube and dried it with nitrogen to
remove solvents (Derewiaka and Molinska, 2015). After that, dissolve it with 100 μl
pyridine and vortex it. The solution was filtered through a 0.22 μm Nylon filter with a
syringe. Take 40 uL of sample solution, then add 20 μL of internal standard and 40 μL
of derivatization agent (sylon BTZ). Let the samples derivatized for 1 hour in the dark at
room temperature. Derivatization is a chemical process to increase the compound
volatility so it will be more suitable for analysis (Kangani et al., 2008). Chemical derivatization often require to improve the peak symmetry. Next, 1 μL of the resulting
12
5.2.Gas Chromatography Method Development
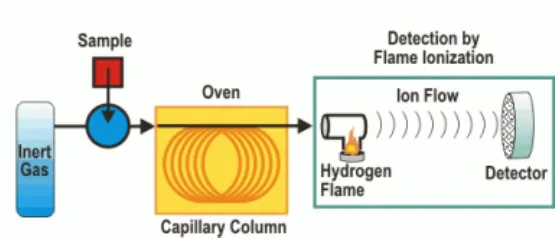
Gas Chromatography principles is vaporized a liquid sample to a gas then carries it
through a column with an inert gas carrier. The column has a stationary phase that
interacts differently with each compound, which will involve a different retention time.
The detector will response and convert it to an electrical signals resulting a gas
chromatogram we can analyze. (Kangani et al., 2008). The advantage of using gas chromatography are the analysis time relatively short and have high sensitivity.
Figure 4. Principle of Gas Chromatography - Flame Ionization Detector (Source :
The test of two initial temperatures (230 and 250°C), two flow rate (0.5 and 1.0
mL/min), and two split ratios (10:1 and 1:1) was conducted to optimized the gas
chromatography method for this research. The result indicated that lower initial
temperature (230°C) will improve the peak symmetry and no thermal degradation was
observed (Chen et al., 1994). Furthermore, at a higher flow rate (1.0 mL/min), all of the COPs showed better separation and shorter retention time (< 15 minutes). Moreover, the
result also showed that a lower split ratio (1:1) will improve the peak symmetry. Hence,
the initial temperature of 230°C, the flow rate of 1.0 mL/min, and the split ratio 1:1 was
chosen. In general, method optimization requires a proper choice of initial temperature,
13
5.3. Identification Method
We used two methods for identification of the COPs in pork floss sample. (1) Compare
the retention time of COPs standard with pork floss sample which shows in Table 1. (2)
Add COPs standard into sample solution for co-chromatography which shows in Figure
5.
Table 1. Retention time (Rt), retention factor (κ) aand separation factor (α) b of COPs
and cholesterol by using GC-FID
Compound Peak
Numbers in parentheses represent values between two neighboring peaks
Table 1 shows retention time, retention factor (κ), and separation factor (α). To have a
14
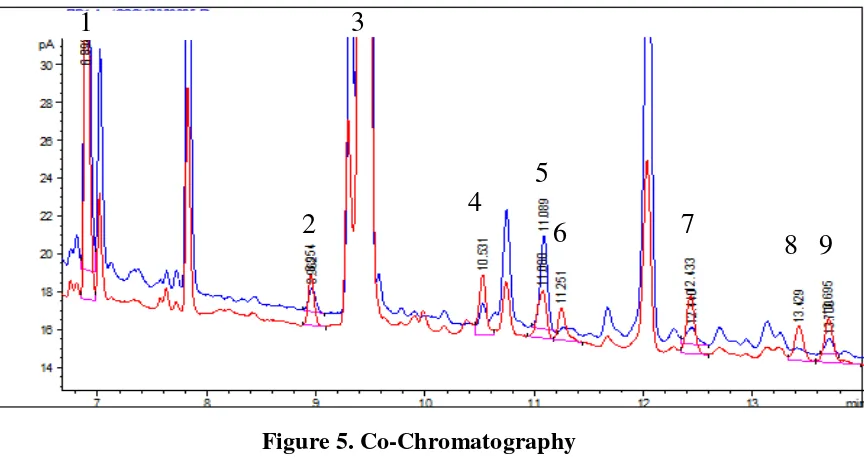
Figure 5. Co-Chromatography
Peaks: (1) internal standard (5α-cholestane), (2) 7α-OH, (3) cholesterol, (4) 7β-OH, (5) 5,6β-EP, (6) 5,6α -EP, (7) triol, (8) 25-OH, (9) 7-keto.
The blue line presents the sample solution
The red line presents the sample solution added with standard solution.
Figure 5. shows the chromatograms of the internal standard when added into sample.
The blue line shows the sample solution while the red line shows the sample soulution
added with standard solution. Then we can see that the COPs in pork floss were
identified.
1
2
3
4
5
15
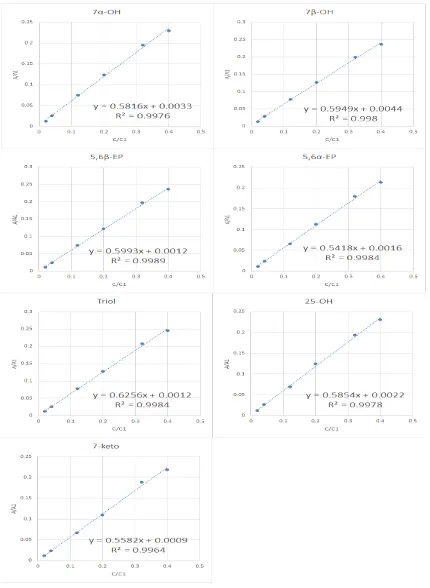
5.4. Quantification Method
Internal standard calibration curve is a common quantification method in instrument
analysis, for example in LC or GC. There are several factors to choose the internal
standards: (1) the structure of the internal standard should be similar with the analyte
(Figure 6.), (2) the internal standard peak should be separate individually (Figure 7.),
and (3) the compound should not be present in the sample (EPA Method 8000C, 2003).
We prepare the COPs standard solution in different concentration between 0.4 ~ 4 ppm,
except for the 5,6β-EP range is 0.4 ~ 28 ppm. Then we calculate the (COPs peak
area/ISTS area, As/Ai) and (COPs standard concentration/ISTD concentration, C/Ci) in
Excel (Figure 8.). Linearity was determined by the values of determination coefficient
obtained from calibration curves. The equations and determination coefficients (R2) for
each analyte are presented in Table 2. The R2 for seven COPs were > 0.9964 which
means the standard calibration curve have a good linearity. We used the following
formula to calculate the COPs amount in each pork floss:
As : COPs sample area
Ai : Internal standard area
b : Intercept in calibration curve
a : Calibration slope
Ci : Concentration of internal standard
16
Figure 6. The chemical structure of (a) 5-α-Cholestane (b) Cholesterol (c) Seven COPs
Figure 7. GC Chromatogram of COPs standards
Peaks: (1) internal standard (5α-cholestane), (2) 7α-OH, (3) cholesterol, (4) 7β-OH, (5) 5,6β-EP, (6) 5,6α -EP, (7) triol, (8) 25-OH, (9) 7-keto.
Reagent peaks shown without number labelling
Table 2. Linearity and Regression Equations from Calibration Curves
COPs standards Calibration Curve Equation R2
17
18
5.5.Analysis of Cholesterol Oxidation Products (COPs) in Pork Floss
The different COPs were analyzed by Gas Chromatography according to the method
previously described. Identification of COPs was based on the comparison of the
retention times of the samples with the standards (Yurchenko et al., 2016). The concentrations of COPS were calculated using the peak area of COPS over the peak
area of the internal standard. The area ratios of COPS to internal standard were
determined at six different concentrations, which are 0.02, 0.04, 0.12, 0.2, 0.32, and 0.4
19
(c)
(d)
(e)
20
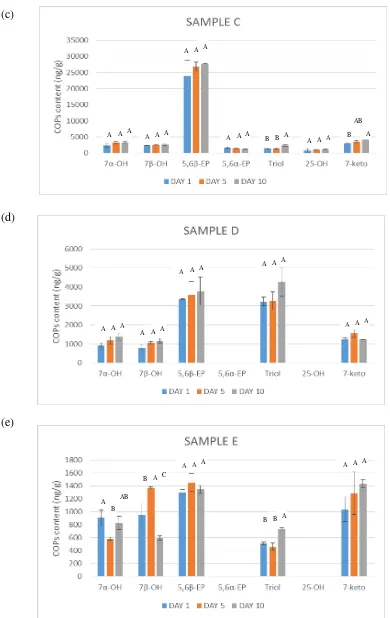
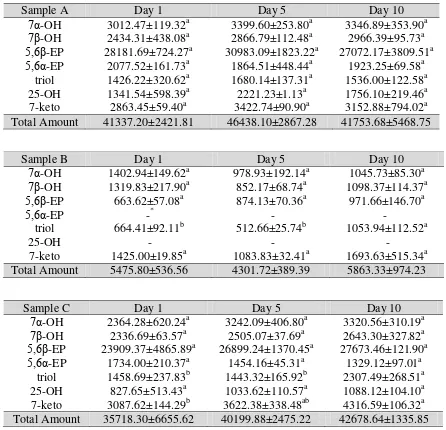
Figure 9. shows the changes of different COPs during storage at room temperature in
sample A to sample E. The separation between different compounds has been
successfully achieved. The result showed that the most predominant oxidized
cholesterol from sample A to sample E were 7α-OH, 7β-OH, 5,6β-EP, triol, and 7-keto.
Table 3. Changes of Different COPs (ng/g) during Storage at Temperature Room (a) Sample A; (b) Sample B; (c) Sample C; (d) Sample D; and (e) Sample E
Sample B Day 1 Day 5 Day 10
7α-OH 1402.94±149.62a 978.93±192.14a 1045.73±85.30a
7β-OH 1319.83±217.90a 852.17±68.74a 1098.37±114.37a
5,6β-EP 663.62±57.08a 874.13±70.36a 971.66±146.70a
5,6α-EP -* - -
triol 664.41±92.11b 512.66±25.74b 1053.94±112.52a
25-OH - - -
7-keto 1425.00±19.85a 1083.83±32.41a 1693.63±515.34a
Total Amount 5475.80±536.56 4301.72±389.39 5863.33±974.23
Sample C Day 1 Day 5 Day 10
7α-OH 2364.28±620.24a 3242.09±406.80a 3320.56±310.19a
7β-OH 2336.69±63.57a 2505.07±37.69a 2643.30±327.82a
5,6β-EP 23909.37±4865.89a 26899.24±1370.45a 27673.46±121.90a
5,6α-EP 1734.00±210.37a 1454.16±45.31a 1329.12±97.01a
triol 1458.69±237.83b 1443.32±165.92b 2307.49±268.51a
25-OH 827.65±513.43a 1033.62±110.57a 1088.12±104.10a
7-keto 3087.62±144.29b 3622.38±338.48ab 4316.59±106.32a
Total Amount 35718.30±6655.62 40199.88±2475.22 42678.64±1335.85
Sample A Day 1 Day 5 Day 10
7α-OH 3012.47±119.32a 3399.60±253.80a 3346.89±353.90a
7β-OH 2434.31±438.08a 2866.79±112.48a 2966.39±95.73a
5,6β-EP 28181.69±724.27a 30983.09±1823.22a 27072.17±3809.51a
5,6α-EP 2077.52±161.73a 1864.51±448.44a 1923.25±69.58a
triol 1426.22±320.62a 1680.14±137.31a 1536.00±122.58a
25-OH 1341.54±598.39a 2221.23±1.13a 1756.10±219.46a
7-keto 2863.45±59.40a 3422.74±90.90a 3152.88±794.02a
21
Sample D Day 1 Day 5 Day 10
7α-OH 900.25±163.69a 1195.51±193.14a 1386.72±183.40a
7β-OH 803.24±158.91a 1055.85±71.33a 1161.05±120.86a
5,6β-EP 3351.07±25.64a 3595.74±690.14a 3785.99±744.97a
5,6α-EP - - -
triol 3240.15±222.70a 3282.74±474.05a 4263.11±742.75a
25-OH - - -
7-keto 1229.94±73.91a 1555.90±191.72a 1232.17±2.96a
Total Amount 9524.65±644.85 10685.74±1620.38 11829.04±1794.94
Sample E Day 1 Day 5 Day 10
7α-OH 906.48±118.54a 582.83±23.55b 825.74±104.80ab
7β-OH 952.91±178.95b 1368.57±18.76a 594.72±34.33c
5,6β-EP 1298.88±42.05a 1453.08±135.43a 1349.93±57.72a
5,6α-EP - - -
triol 509.48±19.94b 461.04±56.75b 727.24±26.67a
25-OH - - -
7-keto 1039.06±191.26a 1286.16±328.49a 1431.49±61.07a
Total Amount 4706.81±550.74 5151.68±562.98 4929.12±284.59
Values of content are MEAN±SD of two replicates.
Different letters whitin a row indicate significant differences between different day. Data expressed as ng/g.
*
- means no detected
The result is presented in Table 3. We can see that the COPs of pork floss varied
significantly during storage. In general, the pork floss contains higer level of COPs
during storage time. Among the tested samples, the highest total COPs content
(4643.8±286.72 µg/g) was observed in Sample A at Day 5 and the lowest
(430.17±38.93 µg/g) in Sample B at Day 5. As we can see there is a significant difference in 7α-OH, 7β-OH, 5,6β-EP, triol, and 7-keto in some samples. The formation of triol and 7-keto for some samples was higher compared to the other compounds. This
result is similar to that of Monahan et al., (1992) who reported a significant increase of total amount of COPs in cooked pork products during storage. The COPs contents after
four days storage were higher than that after two days storage.
Besides, cholesterol oxidation is faster in foods during drying and storage. Processing
procedures like shredding, mincing, and mixing will disrupt muscle structure so it can
increase the storage surface exposed to oxygen (Novelli et al., 1998). But since the
period of storage time is short, which is only ten days, it will be difficult to show the
22
due to a high variation of ingredients in each sample. The oxidation of cholesterol in
food is influenced by many factors, such as food composition, presence of anti-oxidants,
storage condition, food processing, and other factors like moisture (Min et al., 2016). Badiani et al. (2002) also reported that different cooking method will produce different moisture content of meat products which lead to different levels of cholesterol products.
Overall, from this research we can see that COPs contents in pork floss will be higher
23
6. CONCLUSIONS AND RECOMMENDATION
6.1. Conclusions
• QuEChERS extraction method and Gas Chromatography with Flame Ionization
Detector are suitable for the analysis of COPs in pork floss.
• We can use GC-FID combined with DB-5MS capillary column to separate the
internal standard (5α-cholestane), 7α-OH, cholesterol, 7β-OH, 5,6β-EP, 5,6α-EP,
triol, 25-OH, 7-keto whitin 19 minutes.
• The most predominant COPs in pork floss detected were 7α-OH, 7β-OH, 5,6β-EP,
triol, and 7-keto.
• In some of pork floss, we found that COPs content will increase during storage.
6.2. Recommendation
However, further investigation is needed to elucidate the impact of autoxidation on pork
24 7. REFERENCES
Ahn, D. U., Nam, K. C., Du, M. and Jo, C. (2001). Effect of irradiation and packaging conditions after cooking on the formation of cholesterol and lipid oxidation products in meats during storage. Meat Science 57 (2001) 413-418
Anastassiades, M., Mastovska, K. and Lehotay, S. J. (2003). Evaluation of analyte protectants to improve gas chromatography analysis of pesticides. J. Chromatogr. A 1015 (2003) 163-184
Badiani, A., Stipa, S., Bitossi, F., Gatta, P. P., Vignola, G., and Chizzolini, R. (2002) Lipid composition, retention and oxidation in fresh and completely trimmed beef muscles as affected by common culinary practices. Meat Sci. 60,169-186.
Chen, Y. C., Chiu, C. P. and Chen, B. H. (1994). Determination of cholesterol oxides in heated lard by liquid chromatography. Food Chemistry 50 (1994) 53-58.
Chizzolini, R., Zanardi, E., Dorigoni, V. and Ghidini, S. (1999). Calorific value and cholesterol content of normal and low-fat meat and meat products. Trends Food Sci Tech. 1999; 10:119–28.
Derewiaka, D. and Molinska, E. (2015). Cholesterol transformations during heat treatment. Food Chemistry 171 (2015) 233-240
Dumont, Marie-Josee and Narine, Suresh S. (2007). Characterization of Flax and Soybean Soapstocks, and Soybean Deodorizer Distillate by GC-FID. J am Oil Chem Soc (2007) 84:1101-1105
EPA Method 8000C. (2003). Determinative Chromatographic Separations Revision 3, March 2003
Grob, Robert L. and Barry, Eugene F. (2004). Modern Practice of Gas Chromatography, 4th Edition. John Wiley & Sons, Inc. ISBN 0-471-22983-0
Garcia-Marquez, I., Narvaez-Rivas, M., Gallardo, E., Ordonez, J. A. and Leon-Camacho, M. (2014). Characterization and quantification of the cholesterol oxidation product fraction of the intramuscular fat from pork loin (fresh and marinated) with different irradiation and packaging during storage. Grasas Aceites 65 (4), ISSN-L: 0017-3495
25
Kangani, Cyrous O., Kelley, David E. and DeLany, James P. (2008). New method for GC/FID and GC-C-IRMS analysis of plasma free fatty acid concentration and isotopic enrichment. Journal of Chromatography B, 873 (2008) 95-101.
Khan, Muhammad I., Min, Joong-Seok, Lee, Sang-Ok, Yim, Dong Gyun, Seol, Kuk-Hwan, Lee, Mooha and Jo, Cheorun. (2015). Cooking, storage, and reheating effect on the formation of cholesterol oxidation products in processed meat products. Lipids in Health and Disease (2015) 14:89
Lehotay, Steven J., Kok, Andre De., Hiemstra, Maurice and Bodegraven, Peter Van. (2005). Validation of a Fast and Easy Method for the Determination of Residues from 229 Pestcides in Fruit and Vegetables Using Gas and Liquid Chromatography and Mass Spectrometric Detection. Journal of AOAC International Vol 88, No 2, 2005.
Liao, Guozhou, Xu, Xinglian and Zhou, Guanghong. (2009). Effects of cooked temperatures and addition of antioxidants on formation of heterocyclic aromatic amines in pork floss. Journal of Food Processing and Preservation 33 (2009) 159-175
Linseisen, J and Wolfram, G. (1998). Origin, metabolism and adverse health effects of cholesterol oxidation products. Fett-Lipid. 1998;100:211–8.
Min, Joong-Seok., Khan, Muhammad I., Lee, Sang-Ok., Yim, Dong Gyun., Seol, Kuk Hwan., Lee, Mooha and Jo, Cheorun. (2016). Impact of Cooking, Storage, and Reheating Conditions on the Formation of Cholesterol Oxidation Products in Pork Loin. Korean J. Food Sci. An. Vol. 36, No. 1, pp. 23-28(2016)
Monahan, F. J., Gray, J. I., Boreen, A. M., Miller, E. R., Buckley, D. J., Morrissey, P. A., and Gomaa, E. A. (1992) Influence of dietary treatment on lipid and cholesterol oxidation in pork. J. Agr. Food Chem. 40, 1310-1315.
Novelli, E., Zanardi, E., Ghiretti, G. P., Campanini, G., Dazzi, G., Madarena, G. and Chizzolini, R. (1998). Lipid and Cholesterol Oxidation in Frozen Stored Pork, Salame Milano and Mortadella. Meat Science, Vol. 48, No. 1/2., 29-40, 1998
Rejczak, Tomasz and Tuzimski, Tomasz. (2015). A review of recent developments and trends in the QuEChERS sample preparation approach. Open Chem., 2015; 13:980-1010
26
Schenck, F. J. and Hobbs, J. E. (2004). Evaluation of the Quick, Easy, Cheap, Effective, Rugged, and Safe (QuEChERS) Approach to Pestcide Residue Analysis. Bull. Environ. Contam. Toxicol. (2004) 73:24-30
World Health Organization. (2015). Q&A on the carcinogenicity of the consumption of
red meat and processed meat. Accessed on February 21th 2017.