PROCEEDING
“Sustainable Development Challenge and Opportunity
for Professional Accountants in Developing Countries"
INTERNATIONAL SEMINAR
ON ACCOUNTING FOR SOCIETY
PUBLISHED BY
BACHELOR DEGREE OF ACCOUNTING STUDY PROGRAM
FACULTY OF ECONOMY UNIVERSITAS PAMULANG
st
MARCH 21 , 2018
i
PROCEEDING
International Seminar on Accounting for Society
“
Sustainable Development Challenge and Opportunity for
Professional Accountants in Developing Countries"
Auditorium Universitas Pamulang
March, 21
st, 2018
BACHELOR DEGREE
OF ACCOUNTING STUDY PROGRAM
FACULTY OF ECONOMY
ii
Head of Accounting Study Program
H. Endang Ruhiyat, S.E., M.M
Head of The Committee
Listya Sugiyarti, S.E., M.M.
Reviewer
Prof. Dr. Tubagus Ismail, SE, MM, Ak, CA, CMA Prof. Dr. Lindianasari, SE, M.Si, Akt
Prof Madya. Dr. Erlane K. Ghani
Prof Madya Dr. Nor Balkish Zakaria
Ersa Tri Wahyuni, PhD, CA, Ak., CPMA, CPSAK Drs. Dekar Urumsah, S.Si, M.Com, PhD
Ayu Chairina Laksmi, SE, MappCom, Mres, PhD, Ak, CA Dra. Ataina Hudayat, Ak, M.Si, DBA
Abdul Ghofar SE, Msi, Macc, DBA, Ak, CA Arief Rahman, SE, M.Com, PhD
Dr. Ihyaul Ulum SE, Msi, Ak, CA Dr. Hendro Sasongko, Ak, MM, CA
Dr. Arief Tri Hardiyanto, Ak, MBA, CMA, CCSA, CA, CSEP, QIA Dr. IR. H. Sarwani, M.T., M.M
Dr. Eka Maya Sari Siswi Ciptaningsih, B.Ec, MP Dr. Ir. Umi Rusilowati, M.M
Dr. Ali Maddinsyah, S.E., M.M
Amrie Firmansyah, SE, MM, M.Ak, ME Ferry Irawan, SE, SST, MM, ME H. Endang Ruhiyat, S.E., M.M Hj. Holiawati, S.E., M.Si Effriyanti, S.E, Akt., M.Si., CA
Shinta Ningtyas Nazar, S.E., M.Acc., Akt Nofryanti, S.E., M.Akt
Irham Fahreza Anas, S.E.I, M.E, CIBP
Expert Editor
Putri Nurmala
iii
Ibram Pinondang Dalimunthe Aditya Pratama
Angga Hidayat Anis Syamsu Rizal
Yuliana Friska
Publisher
Bachelor Degree of Accounting Study Program, Faculty of Economy Universitas Pamulang
Jalan Surya Kencana No. 1 Pamulang Barat, Tangerang Selatan, Banten 15417
Pages: vii + 269 hlm. Size : 21,0 x 29,7 cm
Mei 2018
ISBN
978-602-60738-3-9
PREFACE
Copyright is protected by law.
iv Bachelor Degree of Accounting Study Program, Faculty of Economy, Universitas Pamulang. This event is a dissemination forum of various scientific papers, both theoretical and empirical research conducted by lecturers, researchers, academics and students from various cities in Indonesia.
The International Seminar on Accounting for Society has a theme "Sustainable Development Challenge and Opportunity for Professional Accountants in Developing Countries". Through this activity, the thoughts and ideas of the participants are expected to contribute to the development of Accounting science in the future for national and regional economic development.
This Proceeding contains 29 papers from various papers with sub themes namely Accounting, Finance and Banking, Good Corporate Governance, Management, Economic Regional, and others sent by lecturers, researchers, and students both from State Universities (PTN ) as well as private universities (PTS) from various cities in Indonesia.
Our gratitude to all presenters who have presented their papers in Bachelor Degree of Accounting Study Program, Faculty of Economy, Universitas Pamulang. We also thank all the organizers who have worked hard in the success of The International Seminar On Accounting for Society.
We recognize that there are still many shortcomings and limitations during the implementation of The International Seminar on Accounting for Society. Therefore, let us say an apology if it is less than pleasing to you.
Wassalamu’alaikum Wr. Wb.
Pamulang, March, 21st 2018
Head of Accounting Study Program Head of The Committee Faculty of Economy,Unversitas Pamulang International Seminar
H. Endang Ruhiyat, S.E., M.M. Listya Sugiyarti, S.E., M.M.
v
Contents ... v
Analysis The Influence of Service Quality on Customer Satisfaction Of Domestic Postal Parcels at Kantor Pos Banjarmasin
Agung Surya Dwianto, Pupung Purnamasari ... 1
The Most Influential Factors Toward Firm Value (Case Study in Indonesia)
Sasya Sabrina, Armanto Witjaksono, Lusianah ... 9
The Influence of Employee Training Towards The Development of Career Employees at PT Corporate University Telkom Bandung
Hesti Sugesti, Vindy Yolan Yulianto Putri ... 18
Evaluation of The Lecturers’ Performance in Sriwijaya University
Efva Octaviana Donata Gozali, Nilam Kesuma, Burhanuddin,
Rika Henda Safitri ... 28
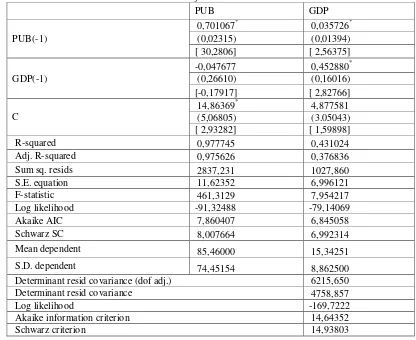
An Empirical Research of The Relationship Between Public Debt and Economic Growth in Vietnam
Le Thi Thanh Ha, Andi Azhar, Wing-Keung Wong ... 38
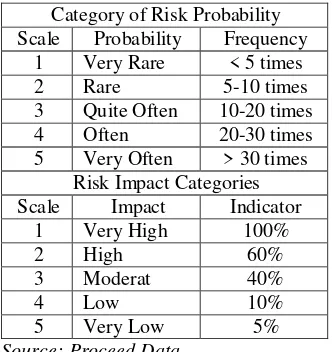
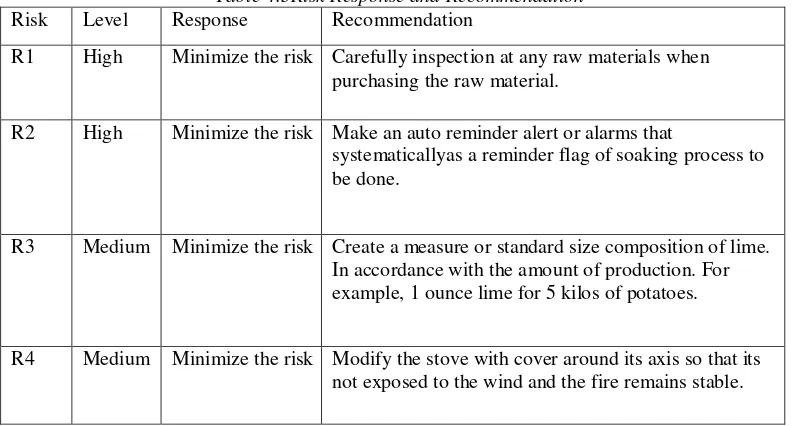
The Analysis of Potato Chips Product Damaged Risk in Widuri Joint Venture Group
Dwi Septi Haryani, Imran Ilyas, Satriadi, Selvi Fauzar ... 48
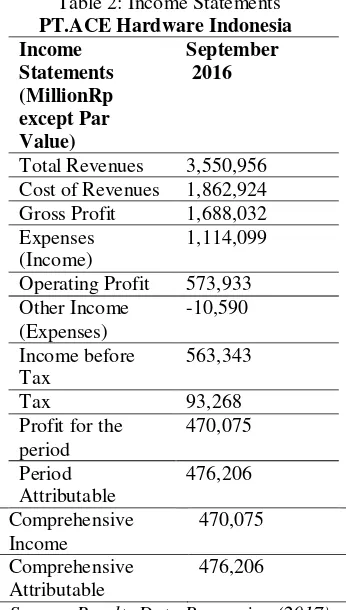
Measuring Financial Performance PT Ace Hardware Indonesia Tbk Through Ratio Calculation
Irwin Ananta Vidada, Raden Mohammad Riezky Pahlevi,
Ani Rakhmanita ... 57
Balanced Scorecard (BSC): Does It Really Matter in Malaysian Private Institutions of Higher Learning?
Mohamad Hafiz bin Rosli, Farrah Fawzia binti Md Ariff,
Jamaliah binti Said ... 64
The Effect of Time Budget Pressure, Locus of Control, Organizational Commitment, and Performance Auditor of Auditor Dysfunctional Behaviors (An Empirical Study in Public Accountant Firm DKI Jakarta)
Wanda Fitria Yanti ... 72
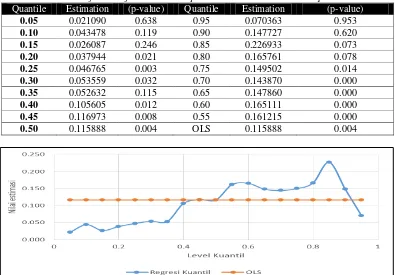
Intellectual Capital and Profitability Towards Firm Value: Analysis Using Quantile Regression Approach
vi The Effect of Implementation of Public Accountant Profession Act On
The Interest of Students Being Public Accountants (Case Study in Pakuan University)
May Mulyaningsih ... 98
The Influence of Audit Opinion to The Company Stock Price
Mochamad Muslih, Muhd. Nuryatno Amin ... 112
The Earth Building Tax Amnesty Selection in Increasing Local Origin Income
Faisal ... 126
The Influence of Professional Commitment, Job Stress, and Job Satisfaction Towards Turnover Intention
(An Empirical Study in Auditors of Public Accountants Firm in DKI Jakarta)
Nurhalipah Abidin ... 137
Factors That Influence Student Intentions Towards Accounting Major In Indonesia
Rudiyanto, Ela Widasari ... 146
Analysis of Financial Performance At PT. Aneka Tambang Tbk Period 2012 – 2016
Dian Indah Sari ... 155
Effect of Investment Oppurtunity Set (IOS) Through Business Risk On Stock Return in Pharmaceutical Companies Listed in
Indonesia Stock Exchange
Arna Suryani, Marissa Putriana, Susi Artati ... 163
Impact of Community Based on Settlement Environment Setup (CBSES) Program to Society Mindset at Sungai Lais District Palembang City
Lily Rahmawati Harahap, Ellys, Reiner Yanmayana Effendi ... 172
Role of Public Accountants to The Success of Tax Amnesty in Financial Institutions and Banking In Indonesia
Nurmala Ahmar ... 181
The Strategic Isssues of Indonesian Border Area Development Based on The Master Plan 2015-2019
Posma Sariguna Johnson Kennedy, Suzanna Josephine L. Tobing,
Adolf Bastian Heatubun, Rutman L. Toruan ... 190
vii
The Role of Dinar-Dirham Users Community In Direct Application as Medium of Exchange
Srie Nuning Mulatsih, Aisyah Ratnasari ... 217
The Effect of Operating Cost, Operational Efficiency, Credit Risk, Liquidity Risk, Risk Aversion, Market Share, BI Rate on Margin Bank
Tri Yulaeli ... 224
Influence of Taxpayer Formal Knowledge and Tax Awareness Against
Compliance of Tax Vehicles (Car Taxpayer Case Study in SAMSAT POLDA Jakarta Selatan)
Tyas Pambudi Raharjo, Licke Bieattant ... 233
Financial Management in The Support Good Governance (Study on The Government of Subang District)
Zaenal Hirawan ... 242
The Effect of Corporate Governance Mechanism on Earnings Management Activities (Empirical Study in Manufacturing Companies of Food and Beverage Sub Sectors Listed on Stock Exchange of Indonesia 2012-2016)
Sintia Andriana ... 250
Study on Role of Rural Bank Industry in Supporting Micro, Small, and Medium Enterprise in Indonesia
1
ANALYSIS THE INFLUENCE OF SERVICE QUALITY ON
CUSTOMER SATISFACTION OF DOMESTIC POSTAL
PARCELS AT KANTOR POS BANJARMASIN
Agung Surya Dwianto
Department of Management, STIE Pertiwi, Bekasi Email:[email protected]
ABSTRACT
This research is intended to know the influence of service quality (tangibles, reliability, responsiveness, assurance and empathy) either partially or simultaneously to the consumers’ satisfaction and to know the more dominant influence from quality service (tangibles, reliability, responsiveness, assurance and empathy) to the Consumers’ Satisfaction of Post Package Service of PT. Pos Indonesia in Banjarmasin Post Office.The theory used in this research is Marketing Management Theory related to the service quality. It uses descriptive quantitative and case study using survey. This is also explanatory. The technique of data collection is interview, distributing the questioners to the sample for 100 respondents and documentation study. To test the hypothesis, it uses multiple regression by using t-test an F-test. The result of study shows that service quality can be seen from 5 dimensions: tangibles, reliability, responsiveness, assurance and empathy as simultaneous and partial significant influence to the Consumers’ Satisfaction of Post Package Service of PT. Pos Indonesia in Banjarmasin Post Office. In this research, a variable which have significantly dominant influence is responsiveness variable. With the value of determination coefficient (R Square) 69,4%, it means that the independent variable may describe dependent variable, while the remaining 30,6% is explained by the other independent variables which are not included in this study model’s.
Key Words: Tangibles, Reliability, Responsiveness, Assurance, Empathy, Satisfaction of Consumers
1. INTRODUCTION
The service sector today has seen a dramatic increase over the previous decade. This is evident from the contribution of this sector to the world economy which now has dominated about two-thirds. In Europe, for example, this sector has contributed 60% of GDP, while in Indonesia it reaches almost 30% (Lupiyoadi - Hamdani, 2006). This contribution can be seen in terms of profit and ability to absorb most of the labor supply. With
such drastic growth, it is certain that more and more companies are engaged in the service industry, and one of the areas of service industry that has experienced a remarkable increase is the courier service industry.
2
postcards, postcards, and postal parcels and the issuance of new laws that guarantee freedom of business courier service, so many service companies that arise to emerge to participate enliven this messenger courier, especially in the field of delivery of goods or packages.
In the era of free trade as it happens today, every company faces increasingly fierce competition, not least in the field of courier service industry. Increased intensity of competition and the number of competitors, demanding companies engaged in courier services, to always pay attention to the needs and desires of consumers and trying to meet consumer expectations by providing services that are more satisfactory than those done by competitors. Thus, only qualified companies can compete and dominate the market.
With the improvement of the quality of good services it will be able to generate a consumer satisfaction, and most likely can attract new customers. Customers or consumers who are satisfied with a service product, will be a loyal customer, or can be interpreted the consumer feels satisfied needs so that will make repurchase of the service products. It is very profitable for the company, because with the satisfaction of consumer needs, the consumer will not glance at companies providing similar service products as well as most likely free promotion in the form of word of mouth made by satisfied consumers to other consumers.
Implementation of the quality of services performed by a company engaged in services is to provide the best service quality (service) for consumers with the aim to create customer satisfaction. Quality provided by the company, will cause consumer perceptions of the quality given to him.
Often there is a difference between consumer expectations and consumer perceptions of the quality provided by
the company. To find out whether the company has provided quality services
in accordance with consumer
expectations, it is necessary to evaluate from consumers.
Good service quality is a very important thing to reach the market. Consumer satisfaction is the level of consumer feeling after comparing the perceived performance (outcome) with expectations (Fandy Tjiptono, 2000). Consumer research to disclose consumer reactions to services provided by the company with the level of satisfaction associated with the service is very relevant and required by a consumer-oriented company.
During this time the concept and measurement of service quality or service has grown rapidly. One tool that is often used in developing the measurement of service quality or service is a service quality measuring tool that is SERVQUAL (Service Quality) developed by Parasuraman,
Zeithaml, and Berry (Lupiyoadi, 2001). Finding criteria that can provide customer satisfaction are: Reliability, Responsiveness, Assurance, Empati (empathy), and Tangible (Physical Evidence).
3 ofwaiters to satisfy their customers
which in turn will create loyal customers to the company. Making consumers feel satisfied is the main weapon that must be done by a courier company, the company must be able to satisfy the consumer, where the satisfied consumer
will be a loyal customer.
Implementation of good service quality will be able to satisfy the consumer and will eventually make the consumer loyal. Having a loyal customer is a key asset and key to a shipping company or a freight forwarder because it can increase revenue.
In the goods delivery business, POS
INDONESIA has a competitive
advantage that is in the extent of the network owned by the company, both place and space. Market size, the shipping industry is quite tempting, the total market potential in the field of logistics reaches hundreds of trillion rupiah. Demand (demand) for this delivery of goods is still possible to rise above that amount, in line with the improving conditions of the Indonesian economy.
For more details, the following will present an overview of the volume of packets and revenue value of Banjarmasin Post Office from 2011 to 2016.
Table 1.1Volume post parcels and revenue at the post office Banjarmasin - 70000
Year Volume Post Parcels Revnue Value
2011 13.568 koli Rp.1.308.642.485
2012 14.133 koli Rp.1.319.500.868
2013 15.142 koli Rp.1.347.623.850
2014 19.688 koli Rp.1.863.442.147
2015 10.014 koli Rp.1.065.209.244
2016 10.455 koli Rp.1.155.036.536
Source: PT Pos Indonesia (Persero) Banjarmasin branch, 2017
Based on the above table it can be seen that the volume of packets and revenue value from the logistics field at Post Office Banjarmasin for the last 2 (two) years has decreased condition. In 2011 to 2014, revenues from this field of logistics experienced a significant increase. Meanwhile, from 2015 to 2016, a sharp decline in revenue.
It should be PT. Pos Indonesia (Posindo) in the face of competitors do not have to worry or fear with the policies or strategies of competitors. Seeing at a glance Posindo in the shipping service industry then we seem to see the figure of Goliath in "battle" with a private courier in the service delivery industry.
Historically the post office in Indonesia was present at the time of the Dutch East Indies Government. Logged into a member of the UPU (Universal
Postal Union) on 1 May 1877, now Posindo has transformed into a "giant" business entity for shipping services in the country. With its outstanding postal service facilities, Posindo's activities have been present in 34,722 villages in Indonesia. The number of post offices is 3,876 units, 290 units of city posts, 3.040 units of village post, 378 units of postal houses, 878 units of post office, 1673 postal agents, 344 village postal agents, 452 units of cooperative postal agents.
4
companies holding SIPJT licenses (consent companies license). Of these, there are a total of 2,000 branches in 27 provinces with 36,000 employees. With this data available, the collection of private messengers in network is still less than Posindo.
Nevertheless, Posindo plays double as commercial and public service entity. As a business entity, Posindo is required to achieve the maximum profit possible so as to provide dividends to the government. But ironically, Posindo has been moving a lot on the thin, covering the districts to remote villages. There is even 1 (one) post office of a village unit that sends no more than 10 letters or goods per month. Yet the investment to make one office reach hundreds of millions of rupiah. This is the function of Posindo as an agent of public service providers that inevitably, must be undertaken by Posindo. In other words, the public service entity takes on considerable operational costs, especially with the inclusion of several world-class private operators, such as DHL, FedEx, TNT, UPS with their respective local partners, which of course have a very significant impact on Posindo's performance which will come.
In the midst of intense competition in the courier industry, one-way Posindo can take to retain existing Customers even get more consumers in the future is to improve the quality of service. Because customer satisfaction can be affected by superior service quality. Quality of service itself can be interpreted as the expected level of excellence and control over the level of excellence to meet consumer desires. So, to meet the quality of service as expected consumers, the Posindo must provide excellent service and excellence. Quality of service that is often complained of customers, who almost every day enter the customer service table, among others, about a package that is late and even some of them lost
without traceability, clarity of information either about the constraints experienced in the delivery of the package or in terms of insurance coverage given, as well as other things that can reduce customer satisfaction, especially customer paketpos at Post Office Banjarmasin.
Service quality (Servqual) with the five dimensions that accompany it, namely; tangible, reliability, responsiveness, assurance and empathy become a major component for companies engaged in the courier service business, because the products in this service delivery business, between one company with another company is not different and also easy to imitate. Therefore, competition in this industry will be greatly influenced by the ability of the company in providing the best service quality than its competitors.
2. LITERATURE REVIEW
2.1Understanding Marketing Services
According to Kotler (2005) Marketing is a social process by which individuals and groups get what they need and want by creating, offering, and freely exchanging valuable products and services with others.
According to Yazid (2003), service marketing is planning that moves from focus on transactions to long-term relationships with customers. Meanwhile, according to Kotler in Lupiyoadi (2001), the marketing of services is any action or activity that can be offered by one party to another, basically intangible and does not result in any ownership.
5
2.2Understanding and Characteristics of Services
Some definitions of services from such experts are: According to Leonard L. Berry in Yazid (2003) states that: "Services as deeds (actions, procedures, activities); processes, and intangible performance ".
Zeithaml and Bitner in Yazid (2003), stated that the Service has 4 (four) characteristics:
a. Intangibilities b. Diversity
c. Simultaneity of Production and Consumption
d. Vulnerability
Meanwhile, according to Griffin in Lupiyoadi (2001) mention the characteristics of services as follows: a. Intangibility (intangible).
b. Unutterability (can‘t be saved). c. Customization (customization).
2.3Understanding Service Quality
Quality of service can be defined as how far the difference between the reality and expectations of customers for the services they receive. Service quality can be identified by comparing the customers' perceptions of the services they actually receive. When a customer purchases a service product from a company, then one important factor to be considered is whether the service is qualified or not.
One of the factors that determine the level of success and quality of the company is the ability of the company in providing services to its customers. The success of the company in providing quality services to its customers, high market achievement, and the increase in profits of the company is determined by the approach used.
One approach to service quality that is widely used as a reference in marketing research is the SERVQUAL (Service Quality) model developed by Parasuraman, Zeithmal, and Berry
(Lupiyoadi-Hamdani, 2006).
SERVQUAL is built on the comparison of two main factors, namely customer perceptions of the actual service they receive (perceived service) with the actual service expected (expected service).
2.4Understanding Customer
Satisfaction
In general, Satisfaction is the feeling of pleasure or disappointment of someone who emerges after comparing the performance (result) that occurs to the expected performance (outcome) (Kotler, 2005). If performance is below expectations, customers are not satisfied. If performance meets expectations, customers will be satisfied.
According to Supranto-Limakrisna (2007), In order to win the business competition, the company must be able to give more satisfaction to the
consumer compared to that given by its competitors. Giving satisfaction to the consumer, requires a company to do a better job to anticipate and react to the needs and wants of consumers than is done by its competitors.
2.5Measuring Customer Satisfaction
6
According to Kotler (2004), to know the level of customer satisfaction there are four measurement methods that need to be considered by the company, namely: Complaints and suggestions system, customer satisfaction survey, ghost shopping and lost customer analysis.
3. RESEARCH METHODOLOGY
Data analysis method used in this research is multiple regression analysis. Multiple regression analysis is used to analyze the influence of independent variables consisting of tangibles (X1), reliability (X2), responsiveness (X3), assurance (X4), empathy (X5) on dependent variable that is customer satisfaction (Y).
The equation of multiple regression analysis model in this research can be formulated:
Yi = b0 + b1X1 + b2X2 + b3X3 + b4X4 + b5X5 + e
Note:
Y1 = Customer satisfaction X1 = Tangibles (direct evidence) X2 = Reliability (reliability)
X3 = Responsiveness (responsiveness) X4 = Assurance (insurance)
X5 = Empathy (empathy) b0 = constants
b1…b5 = Regression coefficients of independent variables e = Estimation error
4. RESULTS AND DISCUSSION
Data analysis on 100 domestic destination packet of Banjarmasin Post Office respondents in this research is known 51% consist of men and 49% are women, and mostly aged 25-40 years reaching 40%, respondents in this research by 50% work as entrepreneurs, while the frequency of delivery Postal Package in a year, most in the number of 8-12 times a year that reached 29% of the total respondents. Based on the results of the analysis can be seen that the search sample of respondents to
obtain information about the influence of service quality to customer satisfaction package can meet the requirements of accurate data, where the description of respondents indicate objective information.
The results of the test on the instrument of the study indicate that the 100% question grains are valid and the questions on each variable indicate a reliable question (reliable), so the instrument is legitimate for use in searching data. The results of data that have been processed indicate that simultaneously, all dimensions of service quality significantly influence the customer satisfaction of domestic packet Banjarmasin Post Office. While the variables that influence partially on the satisfaction of customer packet at Post Office Banjarmasin is variable of reliability (reliability), responsiveness
(responsiveness) and empathy
(empathy). As for the variables tangibles (physical evidence) and assurance (assurance) does not significantly affect the customer satisfaction of domestic postal parcels at the Post Office Banjarmasin.
Based on these results can be seen that the customer Postal Package Post Office Banjarmasin has not felt satisfaction from the dimensions of physical evidence (tangibles) and assurance dimensions (assurance). This is a challenge for the Post Office Banjarmasin to improve both variables that proved not yet able to satisfy customers.
7 being marked both in terms of
willingness to help and respond to customer demand. For that the Post Office Banjarmasin must be able to maintain the quality of its service, especially in terms of responsiveness (responsiveness), as well as other services proven significantly influence on customer satisfaction, the variable reliability and empathy.
5. CONCLUSION
Based on the results of research and discussion that has been described in the previous chapter, it can be concluded as follows:
a. That the quality of service consisting of dimension tangibles (physical evidence), reliability (reliability), responsiveness (responsiveness), assurance (assurance) and empathy (empathy) simultaneously have a significant effect on customer satisfaction, while partially only variable reliability, responsiveness and empathy that proved to significantly influence α <5%. As for tangibles and assurance variables are not proven to significantly influence for research on domestic packaged
customers at Post Office
Banjarmasin. Based on the analysis of coefficient of determination (R²) shows that 69.4% variation of customer satisfaction variable (dependent) can be explained by service quality variables are tangibles (physical evidence), reliability, responsiveness, assurance and empathy (empathy). The other 30.6% is explained by other variables not included in the model.
b. Responsiveness variable which is the willingness to explain information about post packet delivery, speed and service delivery at counter, willingness to assist and responding to customer demand, is variable that is considered by customer of domestic post parcel at Post Office
Banjarmasin as thing which is considered important and has the most dominant influence to improve customer satisfaction, this is evident
from the magnitude of
responsiveness variable coefficient, that is 0.426 (42.6%) which is greater than the coefficient of other service quality variables.
REFERENCES
Ghozali, Imam, (2002), Aplikasi Analisis Multivariate Dengan Program SPSS, Semarang: Penerbit Universitas Diponegoro.
Jasfar, (2003), Kepuasan Pelanggan dan Price Acceptance (studi kasus pada Penumpang Penerbangan Nasional), Jurnal Manajemen dan Kewirausahaan, Volume Ketujuh No.2. September 2003.
Kotler, Philip, (2000),
ManajemenPemasaran
diIndonesia: Analisis, Perencanaan, Implementasi dan Pengendalian, Alih Bahasa: AB. Susanto, Edisi Pertama, Jakarta: Salemba Empat.
---, (2004), Prinsip-Prinsip Pemasaran, Edisi Kedelapan, Jakarta: Erlangga. ---, (2005), Manajemen
Pemasaran, Jilid I, Edisi
Kesebelas, Alih Bahasa:
Benyamin Molan, Jakarta: PT. Indeks Kelompok Gramedia. ---, (2005), Manajemen
Pemasaran, Jilid II, Edisi
Kesebelas, Alih Bahasa:
Benyamin Molan, Jakarta: PT. Indeks Kelompok Gramedia. Kristiyono, Demitrius, (2005),
8
Timur, Disertasi, Program Pascasarjana Universitas 17 Agustus 1945, Surabaya.
Lupiyoadi, Rambat, (2001), Manajemen Pemasaran Jasa Teori dan Praktek, Edisi Pertama, Jakarta: Penerbit Salemba Empat.
--- dan Hamdani. A, (2006), Manajemen Pemasaran Jasa, Edisi kedua, Jakarta: Penerbit Salemba Empat.
Manullang, Ida, (2008), Pengaruh Kualitas Pelayanan Terhadap Kepuasan Pelanggan Jasa Penerbangan PT. Garuda Indonesia Airlines Di Bandara Polonia Medan, Universitas Sumatera Utara, Medan.
Malhotra, Naresh K, (2002), Marketing Reseach: An Applied Orientation, New Jersey: Prentice Hall, Inc. Robbins, S – Coulter, Mary, (2004),
Manajemen, Alih Bahasa: T. Hermaya, Edisi Tujuh, Jakarta: Indeks Kelompok Gramedia. Santoso, Singgih dan Tjiptono, Fandi,
(2004), Riset Pemasaran Konsep dan Aplikasi Dengan SPSS, Jakarta: PT. Elex Media Komputindo.
Sari, Aida, (2006), Evaluasi Kepuasan Nasabah Atas Layanan Perbankan
Berbasis Mobile Banking
Network (studi kasus pada Bank Central Asia Cabang Bandar Lampung), Jurnal Bisnis & Manajemen, Volume 3 No.1., September 2006.
Sekaran, Uma, (1992), Research Methode for Business: A Skill Buiding Approach, Edisi Keempat, New York: Jhon Wiley Sons. Inc.
Suhartono, (2005), Pengaruh Dimensi Jasa terhadap Tingkat Kepuasan Pelanggan Yang Menggunakan Jasa Penerbangan AdamAir dengan Rute Perjalanan Medan – Jakarta, Jurnal Manajemen dan
Kewirausahaan, Volume. 6, No. 2 September 2004.
Sugiyono, (2008), Metodologi
Penelitian Bisnis, Bandung: CV Alfabeta.
Supranto – Limakrisna, (2007), Perilaku Konsumen dan Strategi Pemasaran Untuk Memenangkan Persaingan Bisnis, Jakarta: Penerbit Mitra Wacana Media. Supranto, Johanes, (2006), Pengukuran
Tingkat Kepuasan Pelanggan Untuk Menaikkan Pangsa Pasar, Jakarta: PT. Rineka Cipta.
Tjiptono, Fandi, (1998), Strategi Pemasaran, Yogyakarta: Andi Offset.
---, (2000), Servive, Quality & Satisfaction, Yogyakarta: Penerbit Andi. Transtrianingzah, Fia, (2006), Analisis
Pengaruh Kualitas Pelayanan Terhadap Tingkat Kepuasan Nasabah Pada Bank Muamalat Cabang Solo, Surakarta: SekolahTinggi Agama Islam Negeri (STAIN).
Umar, Husein, (2003), Riset Pemasaran dan Perilaku Konsumen, Jakarta: PT. Gramedia.
9
THE MOST INFLUENTIAL FACTORS TOWARD
FIRM VALUE
(CASE STUDY IN INDONESIA)
Sasya Sabrina, Armanto Witjaksono*, Lusianah
Accounting and Finance Department, Faculty of Economic and Communication, University of Bina Nusantara, Jakarta
*Email: [email protected]
ABSTRACT
The purpose of this research is to investigate the most influential factor among investment decision, financing decision, and dividend policy toward firm value. We conducted our own research, and later compare our conclusions with other researcher’s conclusions. In our own research investment decision is measured using Price Earnings Ratio (PER), financing decision is measured using Debt Equity Ratio (DER), dividend policy is measured using Dividend Payout Ratio (DPR), and firm value is measured using Price Book Value (PBV). We use 109 samples from publicly listed manufacturing companies in Indonesia Stock Exchange (Bursa Efek Indonesia) in 2014, 2015, and 2016. Our own research uses classic assumption test as the data analysis and multiple regression analysis as the hypothesis test using IBM SPSS Statistics 20. Results of our own research show that: investment decision influences firm value, financing decision does not influence firm value, and dividend policy influences firm value. After that we compare our result with other researcher’s results. Final conclusion investment decision is the most influential factor toward firm value compared to financing decision and dividend policy.
KeyWords: Investment Decision, Financing Decision, Dividend Policy, Firm Value
1. INTRODUCTION
In general, a company has the short-term goals to gain profit as much as possible using existing resources. Whereas, the long term goals of the company is to maximize the firm value (Ikbal, Sutrisno, & Djamhuri, 2011). There are many opinions about firm value. Some researchers said that firm value is reflected in the share price (Wijaya, Bandi, & Wibawa, 2010). Other researchers said that firm value is reflected in financial statement performance of the company or future investment value (Gumanti & Puspitasari, 2008).
10
2004).The main point of financial management is to create shareholders value (Chowdhury & Chowdhury, 2010). Financial management includes investment decision, financing decision, and dividend policy. Investment decision is related to the choice of fund resource from both internal and external. Internal fund resource is from retained earnings, while external fund resource is from creditors or investors (Arieska & Gunawan, 2011). The managers are recommended to analyze investment opportunities before they make decision about cash distribution to shareholders as dividends and required to avoid the use of cash for unprofitable investment since investment in positive net present value project will increase the welfare of the shareholders (Imanzadeh, Shoja, & Poursaleh, 2012).
These differences between
shareholders and managers will create agency problems. The shareholders want the remaining funds to be distributed to increase the welfare of the shareholders, while managers want the remaining funds to be used to enlarge the company exceed its optimal size so they keep investing to negative net present value project. For the shareholders, that decision is rated as a decision not in favor of shareholders. Therefore, increasing funds through loan from creditors is one of the alternatives to reduce agency cost. The existence of these loans will make manager aware and avoid doing
perquisites, so the company
performance will be more efficient. The manager of the company with most funds come from loan will use the money to fund positive net present value project so it will increase shareholders value (Arieska & Gunawan, 2011). To increase their welfare, investors expect the return in dividend and/ or capital gain. On the other hand, company expects the continuous growth to survive in the long term. Therefore,
dividend policy becomes very important because dividend policy has to be able to satisfy shareholders‘ expectation without hampering company growth. However, dividend policy does not only involve shareholders and managers, but creditors also can influence the number of dividends distributed to shareholders. The amount of dividends distributed to shareholders is based on each company policy so that needs serious consideration from management (Prihantoro, 2003). The companies located in the countries which have high legal protection to non-controlling interest or minority interest will pay
higher dividend than the companies located in the countries which have lower legal protection to minority interest(La Porta, Lopez-de-Silanes, Shleifer, & Vishny, 2002).
Based on the above issues, it is necessary to do research about the influence of investment decision, financing decision, and dividend policy toward firm value with the following research questions: does investment decision have significant effect on firm value, does financing decision have significant effect on firm value, and does dividend policy have significant effect on firm value?
2. LITERATURE REVIEW
11 cycles (Christie, as cited in Kallapur &
Trombley, 2001).
The value of the firm formed by share price indicator is greatly influenced by investment opportunities. Cash out for investment provides positive signal about firm growth in the future thus increase the share price that is the indicator of firm value (signaling theory) (Wahyudi & Pawestri, 2006). With this investment policy, it is expected that within a certain period the company will get the return on the investment and the company will grow. This will be responded positively by the market and the share price will be increased (Hardiningsih, 2009).
2.1 Hypothesis 1: Investment decision influences firm value
In finance area, leverage is the ratio of a company‘s loan (debt) to the value of its equity, so the study about leverage is a part of the study of capital structure (Sasongko, Achsani, Sembel, & Kusumastanto, 2012). There are two views about financing decision. First view is known as traditional view that capital structure affects firm value. Traditional view is represented by Trade off Theory and Pecking Order Theory. The second view is presented by Modigliani & Miller (as cited in Wijaya et al., 2010) that capital structure does not affect firm value. The election between debt and equity aims to find the proper capital structure that can maximize shareholders value. Weighted Average Cost of Capital (WACC) is used to determine firm value by discounting future cash flow. By minimizing WACC, firm value will be more maximal (Chowdhury & Chowdhury, 2010).
According to Masulis (as cited in Wijaya et al., 2010), abnormal returns will be increased a day before and a day after the increase of debt proportion announcement. Share price will be
increased if there is announcement about issuing debt for share buyback. According to Fama and French (as cited in Wijaya et al., 2010), investment resulting from leverage has positive information about the company in the future and then has positive impact to firm value. Based on the research done by Wijaya et al.(2010), it was found that financing decision affect firm value. The similar result was also obtained by Wahyudi & Pawestri(2006).
2.2Hypothesis 2: Financing decision influences firm value.
Dividend policy is the decision to distribute dividend by considering current and future share price maximization. In determining the amount of dividend, companies specify the target of dividend payout ratio based on after tax profit calculation (Sasongko et al., 2012). According to Jensen (as cited inSulong & Nor, 2008), dividend is a well known cash disbursement strategy for public company that seeks to return cash or other assets to the shareholders. Dividend is distributed because minority shareholders press the management to pay dividend. If company‘s profit is not distributed to shareholders as dividend, minority shareholders worry that profit will be used for personal interest or unfavorable
project. Therefore, minority
shareholders prefer dividend(La Porta, Lopez-De-Silanes, Shleifer, & Vishny, 2000).
Based on the research done bySulong & Nor(2008), dividend significantly and positively affect firm value. Wijaya et al.(2010)also found the similar result that dividend influences firm value. Investment decision, financing decision, and dividend pocily simultaneously affect firm value.
2.3 Hypothesis 3: Dividend policy
12
Figure 2.1 Research Framework
3.RESEARCH METHODOLOGY
Population of this research is manufacturing company listed in Indonesia Stock Exchange for 2014-2016. Data for this research is obtained from financial statement published by public manufacturing company from 2014-2016. The sample of this research is taken using purposive sampling method. Using this method, sample is not taken randomly and uses some considerations and criteria. The criteria of sample selection for this research are as follows: the company had positive equity in 2014, 2015, and 2016; the company had net income in 2014, 2015,
and 2016; the company paid cash dividend in 2014, 2015, and 2016; and there is the completeness of data for 2014-2016
Independent variables in this research are investment decision, financing decision, and dividend policy. Investment decision is an unobservable variable and the information about investing decision is not published by most companies. Therefore, proxy is needed to measure investment decision (Kallapur & Trombley, 2001). In this research, the
proxy used is price-based proxy that is Price Earnings Ratio (PER).
𝑃𝐸𝑅= 𝑃𝑟𝑖𝑐𝑒
𝐸𝑎𝑟𝑛𝑖𝑛𝑔𝑠𝑝𝑒𝑟𝑠𝑎𝑟𝑒
Financing decision is related to the selection of fund resource whether it is from internal funding or external
funding. In this research, the formula used to measure financing decision is
Debt to Equity Ratio (DER)
𝐷𝐸𝑅= 𝑇𝑜𝑡𝑎𝑙𝐷𝑒𝑏𝑡
𝑇𝑜𝑡𝑎𝑙𝐸𝑞𝑢𝑖𝑡𝑦
Dividend shows how much
company‘s net income distributed to shareholders (Arieska & Gunawan,
2011). In this research, dividend policy is measured by Dividend Payout Ratio (DPR).
𝐷𝑃𝑅= 𝐷𝑖𝑣𝑖𝑑𝑒𝑛𝑑𝑝𝑒𝑟𝑠𝑎𝑟𝑒
𝐸𝑎𝑟𝑛𝑖𝑛𝑔𝑠𝑝𝑒𝑟𝑠𝑎𝑟𝑒
Investment Decision
Financing Decision
Dividend Policy
Firm Value H1
H2
13 Dependent variable of this research
is firm value. Firm value is defined as market value because firm value can create maximum welfare to the shareholders if the company‘s share
price is increased (Hasnawati, as cited in Wijaya et al., 2010)). In this research, firm value is measured by Price Book Value (PBV).
𝑃𝐵𝑉 = 𝑃𝑟𝑖𝑐𝑒
𝐵𝑜𝑜𝑘𝑉𝑎𝑙𝑢𝑒
Analysis method used in this research is classic assumption test and regression/ hypothesis test. Classic assumption test is run using IBM SPSS Statistics 20 application consisting of multicollinearity test, heteroscedastic test, normality test, and autocorrelation test. Multicollinearity test is used to find out whether there is any correlation between independent variable in multiple linear regression models. There will be Multicollinearity problem if the tolerance value < 0.10 or Variance Inflation Factor (VIF) > 10 (Ghozali, 2009).
Heteroskedastic test is used to identify residual variances differences from the data in the regression model. In this research, heteroscedastic will be tested using graph technique (scatter plot). There will be heteroskedastic problem if the scatter plot shows that the dots form certain pattern. Otherwise, there will not be heteroskedastic problem if the scatter plot shows that the dots spread randomly (Ghozali, 2009).
Normality test is used to find out whether residual value from the
regression model has normal
distribution. In this research, normality will be tested using graph technique (P-P (P-Plot) and take a look at the dots around the diagonal line. If the dots spread around the diagonal line and follow the direction of the line, the regression model fulfills the normality assumption. Otherwise, if the dots spread far from the diagonal
line or do not follow the direction of the line, the regression model does not fulfill the normality assumption (Santoso, 2015).
Autocorrelation test is used to find out whether there is any correlation between variables in period t and variables in prior period (t-1). In this research, autocorrelation will be tested using Durbin-Watson Test. In general, if the D-W value is in between -2 and +2, there is no autocorrelation (Santoso, 2015).
Hypothesis test will be conducted using t-test and F-test on IBM SPSS Statistics 20. Decision making in this test is if the probability > 0.05, H0 will be accepted and if the probability < 0.05, H0 will be rejected. The probability can be seen from Sig. column in Coefficients SPSS Output table.
4. RESULT AND DISCUSSION
The data for this research is obtained from financial statement year 2014, 2015, and 2016 published by manufacturing company listed on Indonesia Stock Exchange and can be downloaded from official IDX website. For the share price, data can be viewed from Yahoo! Finance. Based on the predefined criteria, 109 samples have been chosen and use 327 data for this research.
14
tolerance value >0.1 and VIF value < 10, there is not heteroskedastic problem because the scatter plot shows that the dots spread randomly, there is not normality problem because the dots
spread around the diagonal line and follow the direction of the line, and there is not autocorrelation problem because D-W value is in between -2 and +2. Below is the SPSS output of t-test.
Table 4.1 t-test (Coefficients)
Model
Unstandardized Coefficients
Standardized
Coefficients T Sig. B Std. Error Beta
(Constant) -1.887 .166 -11.351 .000
INV .947 .055 .867 17.274 .000
FIN -.113 .066 -.086 -1.723 .088
DIV -.111 .056 -.100 -1.991 .049
Source: SPSS Output
To analyze above result, this test will focus on the sig. value. If the sig. value < 0.05, H0 is rejected and H1 is accepted. Based on above output, INV or investment decision has sig. value of 0.000 that means this value is below 0.05, so H1 is accepted. Investment decision influences firm value. Investment decision variable has beta value of 0.947 which means that if the investment decision variable increases one-unit, firm value will increase 0.947 units.
This research is in line with research by Wijaya et al.(2010)which state that investment decision has positive effect toward firm value. According to Myers; Myeong & Hyeon; Wright & Ferris (as cited in Wijaya et al., 2010), firm value which is created through share price indicator is affected by investment opportunity and discretionary expenditure in the future. Investment decision direct effect toward firm value is the result obtained from investment activity itself through project selection or other policies such as creating new
product, machine replacement that is more efficient, and research and development. According to Fama and French (as cited in Wijaya et al., 2010), capital expenditure is very important to increase firm value because that type of investment can provide signals about expected company earnings growth in
the future and can increase firm value proxied by share price.
Based on result on table 2, FIN or financing decision has sig. value of 0.088 that means this value is above 0.05, so H2 is rejected. Financing decision does not influence firm value. This research is in line with the research by Arieska & Gunawan (2011). According to Arieska & Gunawan (2011), financing decision does not influence firm value because there will be any worries from investor about debt increase that causes the company to debt default. Moreover, high level of debt can increase bankruptcy risk, although in theory, debt will help company to control manager not to do perquisites and the company becomes more efficient, so investor evaluation to the company increases.
This research is not in line with research by Wijaya et al.(2010). According toWijaya et al.(2010), financing decision has effect on firm value. If the company is funded by debt, there will be an increase in firm value because of tax savings. The company which has debt will pay interest expense and interest expense can reduce taxable income, then it will give some benefit to shareholders.
15 accepted. Dividend policy influences
firm value. Dividend policy variable has beta value of -0.111 which means that dividend policy variable increases one-unit, firm value will decrease 0.100 units.
According to Wardani & Siregar (2009), the company existence is related to various interests from shareholders, managers, and creditors. Shareholders tend to maximize share price and push the manager to do things that is in accordance with the interest of shareholders through supervision.
Managers tend to have the intention to pursue personal interests. Managers even tend to make investment decision which the result will not maximize shareholders value (Wu, 2004). On the other hand, creditors will try to protect the fund or money lent to the company by setting the collateral and doing strict supervision policy (Wardani & Siregar, 2009). Therefore, if the company declares dividend payment, the decision is considered as decision that is infavorable to some stakeholders. Below is the SPSS output of F-test:
Table 4.2 F-test (ANOVA)
Model Sum of
Squares Df
Mean
Square F Sig.
Regression 103.918 3 34.639 104.803 .000
Residual 34.705 105 .331
Total 138.623 108
Source: SPSS Output
F-test is used to determine the simultaneous effect of independent variables on the dependent variable. From the table 3, sig. value of this test is 0.000. This value is less than 0.05, so it can be concluded that investment
decisions, financing decisions, and dividend policy simultaneously influence firm value. Research by Wijaya et al.(2010) obtained the same result as this research.
Table 4.3 Determination Coefficient
Model R R Square Adjusted R Square
Std. Error of the Estimate
1 .866 .750 .742 .57491
Source: SPSS Output
From the table 4, adjusted R² value for this research is 0.742 or 74.2%. This result shows that 74.2% of firm value changes are affected by investment decisions, financing decisions, and dividend policy, while the rest, 25.8% of firm value changes are affected by other factors which are not included in this research.
5. CONCLUSIONS
This research shows that 74.2% of firm value changes are affected by investment decisions, financing decisions, and dividend policy, while the
16
financing decision does not affect firm value. Financing decision variable has sig. value of 0.088. Moreover, this research provides empirical evidence that dividend policy affects firm value. Dividend policy variable has sig. value of 0.049 and has beta value of -0.111 which means that dividend policy variable increases one-unit, firm value will decrease 0.100 units.
Investment decision is the most influential factor that affect firm value.
REFERENCES
Arieska, M., & Gunawan, B. (2011). Pengaruh Aliran Kas Bebas dan Keputusan Pendanaan Terhadap Nilai Pemegang Saham dengan Set Kesempatan Investasi dan Dividen Sebagai Variabel Moderasi. Jurnal Akuntansi Dan Keuangan, 13(1), 13–23.
Retrieved from
http://puslit2.petra.ac.id/ejournal /index.php/aku/article/view/182 35
Chowdhury, A., & Chowdhury, S. P. (2010). Impact of Capital Structure on Firm‘s Value: Evidence from Bangladesh. Business and Economic Horizons, 3(3), 111–122. http://doi.org/10.15208/beh.201 0.32
Ghozali, I. (2009). Ekonometrika, Teori, Konsep, dan Aplikasi dengan SPSS 17. Semarang: Program
Doktor Ilmu Ekonomi
Universitas Diponegoro.
Gumanti, T. A., & Puspitasari, N. (2008). Siklus Kehidupan Perusahaan dan Kaitannya dengan Investment Opportunity Set, Risiko, dan Kinerja Finansial. Jurnal Riset Ekonomi Dan Bisnis, 8(1), 37–49.
Hardiningsih, P. (2009). Determinan Nilai Perusahaan. Jurnal
Akuntansi Indonesia, 5(2), 231– 250.
Ikbal, M., Sutrisno, & Djamhuri, A. (2011). Pengaruh Profitabilitas dan Kepemilikan Insider terhadap Nilai Perusahaan dengan Kebijakan Utang dan Kebijakan Dividen sebagai Variabel Intervening. In Simposium Nasional Akuntansi XIV. Aceh.
Imanzadeh, P., Shoja, R. M., & Poursaleh, A. (2012). A Study of the Relationship between Free Cash Flow and Debt. Life Science Journal, 9(4), 2598– 2603.
Kallapur, S., & Trombley, M. A. (2001). The Investment Opportunity
Set: Determinants,
Consequences and
Measurement. Managerial
Finance, 27(3), 3–15. http://doi.org/10.1108/03074350 110767060
La Porta, R., Lopez-de-Silanes, F., Shleifer, A., & Vishny, R. (2002). Investor Protection and Corporate Valuation. The Journal of Finance, 57(3), 1147–1170.
http://doi.org/10.2307/2697775 La Porta, R., Lopez-De-Silanes, F.,
Shleifer, A., & Vishny, R. W. (2000). Agency Problems and Dividend Policies Around the World. The Journal of Finance,
55(1), 1–33.
http://doi.org/10.2307/222549 Prihantoro. (2003). Estimasi Pengaruh
Dividen Payout Ratio pada Perusahaan Publik di Indonesia. Jurnal Ekonomi & Bisnis, 1(8), 7–14.
Santoso, S. (2015). Menguasai Statistik Parametrik Konsep dan Aplikasi dengan SPSS. Jakarta: PT. Elex Media Komputindo.Sasongko, H., Achsani, N. A., S
17 Analisis Pengaruh Aliran Kas
Bebas Positif dan Negatif, Dividen, dan Leverage terhadap Nilai Pemegang Saham Studi
Kasus: Perusahaan Non
Keuangan yang Terdaftar di Bursa Efek Indonesia Periode 2003-2010. Jurnal Ilmiah Ranggagading, 12(1), 72–81. Sulong, Z., & Nor, F. M. (2008).
Dividends, Ownership
Structure, and Board
Governance on Firm Value: Empirical Evidence from Malaysian Listed Firms. Malaysian Accounting Review, 7(2), 55–94.
Wahyudi, U., & Pawestri, H. P. (2006). Implikasi Struktur Kepemilikan terhadap Nilai Perusahaan: dengan Keputusan Keuangan sebagai Variabel Intervening. In Simposium Nasional Akuntansi
IX. Padang.
http://doi.org/10.1017/CBO9781 107415324.004
Wardani, R. A. K., & Siregar, B. (2009). Pengaruh Aliran Kas Bebas terhadap Nilai Pemegang Saham
dengan Set Kesempatan
Investasi dan Dividen sebagai Variabel Moderator. Jurnal Akuntansi Dan Manajemen,
20(3), 157–174.
http://doi.org/10.1017/CBO9781 107415324.004
Wijaya, L. R. P., Bandi, & Wibawa, A. (2010). Pengaruh Keputusan
Investasi, Keputusan
Pendanaan, dan Kebijakan
Dividen terhadap Nilai
Perusahaan. In Simposium Nasional Akuntansi XIII. Purwokerto.
18
THE INFLUENCE OF EMPLOYEE TRAINING TOWARDS
THE DEVELOPMENT OF CAREER EMPLOYEES AT PT.
CORPORATE UNIVERSITY TELKOM BANDUNG
HestiSugesti
*), Vindy Yolan Yulianto Putri
Department of Business Management, Politeknik Pos Indonesia, Bandung *Email: [email protected]
ABSTRACT
The problem that is faced by PT. Telkom Corporate University Bandung is the ability of the employees to compete. It is indicated by the work performance of employees are insufficient. In this study, researchers want to find out an idea of Training, Career Development and the influence of Training towards Career Development.Training has 5 sub variables. rotational position, work instruction, internship, coaching and temporaryassignment. Whereas Career Development has 5 sub variables i.e. work achievement, exposure, resignation, organization loyality, also mentors and sponsors. The method used is descriptive verification with sampling a number of 40 respondents and data collection technique through the study of librarianship and the questionnaire. The data processed through the test validity and reliability, a descriptive analysis, regression, F test and coefficient of determination. Sugiyono (2012:119) argues that "data collection can be done in a variety of settings, a variety of sources and a variety of ways". Description of employees training arein good enough category, while the description employees career development are also in good enough category, the influence of employee training towardsemployee career development of 63.7%. Suggestions for PT. Telkom Corporate University Bandung are to do more intensive training by bringing more experienced instructors and also provide more interesting training material.
Key Words: Training, Career Development
1. INTRODUCTION
Human resources are considered an increasingly important role in achieving corporate goals but often the problems in human resources arise. The company will not achieve its objectives if the human resources do not meet the desired standards. The ability of human resources is a reason to the performance of an HR and it is very influential on the success of the company so every company should always pay attention to the quality and ability of human resources. Performance problems can be
overcome by providing HR training and self-development.
Training is an effective way to make employees better and they will be in accordance with what the company wants and needs. One of the companies that regularly conduct training for its employees is Telkom Corporate University Indonesia, Telkom Corporate University is a subsidiary of Telkom
Indonesia. Telkom Corporate
19 employees who work in Telkom Telkom
in Indonesia.TCU often do training for its employees which is training for idea business, so that employees master everything about wifi. From the background of the study it can be decided some questions. How Job Description Employees at PT. Telkom Corporate University? How Career Employee Development Overview conducted by PT. Telkom Corporate University? How the Effects of Employee Training on Employee Career Development PT. Telkom Corporate University?
2. LITERATUR REVIEW 2.1 Definition of Training
Training is any attempt to improve the worker's performance on a particular job that he or she is responsible for or a job-related job. According to William M. Thornton (in Sedarmayanti, 2011: 163) "Training is a deliberate act of providing a tool for learning to work". Meanwhile, according to Edwin B. Flippo (in Sedarmayanti, 2011: 164) "Training is the process of assisting employees to gain effectiveness in the present or future work through the development of habits, thoughts and actions, skills, knowledge and attitude".
2.2 Training Methods
Training as one type of learning process to obtain and improve skills outside the Education system that apply in a relatively short time can be implemented while the employee is working or out of work.
The following types of training according to Saefuddin (2017: 62), namely:
2.2.1 On-the-Job Training
On-the-Job Trainingis a type of exercise for employees in the form of practical exercises using the atmosphere and where the employee performs his
duties, as opposed to outside workplace exercises.
a. Internships
An internship is a process of learning from someone or a few more experienced people.
b. Job Rotation
Job rotation provides employees with knowledge of different parts of the organization and practices of various managerial skills.
c. Work Iinstruction
Work instructions are guidelines of work that are given directly to the job primarily used to train employees on how to carry out their work.
d. Coaching
Providing direction to employees in the implementation of their regular work. For example, the relationship of lecturers with students.
e. Temporary Aassignment
Placement of employees in
managerial positions or as members of certain committees for a certain period of time.
developing analysis wifi
2.2.2 Off-the-Job Training
In contrast to On-the-Job Training, off-the-job trainingis held outside of the workplace. It is include case studies, role playing, business games, vestibule training, laboratory exercises and executive development programs. a. Case study
Techniques in which employees are asked to identify problems, analyze and formulate problems so that decision-making ability increases. b. Role Playing
A technique that allows employees to play different roles.
c. Business Game
A small-scale decision-making simulation tailored to the real-life business situation
d. Vestibule Training
20
e. Laboratory Exercises
A group exercise technique that is primarily used to develop interpersonal skills, one form of this is the sensitivityexercise.
f. Executive Development Program This program is usually organized by educational institutions such as universities.
2.3 Definition of Career Development
Andrew E. Sikula (in Sedarmayanti, 2011: 164) argues that "Career development is a process of long-term education utilizing systematic and organized procedures, in which managerial personnel study conceptual and theoretical knowledge for general purposes". Meanwhile, according to Handoko (in mila, 2015: 195) "Career development is a personal improvement that a person does to achieve a career plan."
2.3.1 Individual Career Development
Establishing a well-designed career development system will help employees in determining their own career needs and adjusting between employees' needs and company goals.
Things related to the career development of an employee by Veitzal Rivai (2010: 291), namely:
1. Work Achievement
Work aachievements the most important factor for improving and developing an employee's career. Career advancement is largely dependent on good and ethical work performance. A good performance assumption underlies all career development activities.
2. Exposure
Exposure becomes familiar (and expected to be maintained as high as possible). Without exposure, good employees may not get the opportunities to achieve their career goals. Managers get their ultimate exposure through their performance and achievements, written reports,
oral presentations, committee work and hours spent.
3. Resignation
If a company in which an employee does not provide many career opportunities and outside of the company opens a considerable opportunity for a career, to fulfill their career goals the employee will resign. A number of professional
employees and managers in
particular turn to other companies as part of a deliberate career strategy to get a better job or get a promotion with a higher income and gain new work experience.
4. Loyalty to the organization
In some companies, people place loyalty on a career above corporate loyalty. Low corporate loyalty levels
are common among recent
collegegraduates (whose high
expectations often cause
disillusionment with the first company they work for) and professionals (whose first loyalty refers to professionals). A great career dedication at the same
company complements HR
department objectives in reducing employee turnover.
5. Mentors and Sponsors
Many employees immediately learn that mentors can help their career development. A coach is a person who provides advice or suggestions to employees in an effort to develop his career. The mentor comes from within the company itself, while the sponsor is someone inside the
company that can create
opportunities for employees to develop their careers.
3. RESEARCH METHODOLOGY
21 purpose and usefulness. Scientific means
that research activities are based on scientific traits, namely rational, empirical and systematic.
The method used in this research is quantitative method. According to Sugiyono (2012: 11) Quantitative method is a method of research that works with numbers, whose data are tangible numbers (scores or grades, ratings, or frequencies), analyzed by using statistics to answer statements or research hypotheses of a specific nature, and to do prediction that a particular variable affects another variable.
3.1Data Collection Techniques
According Sugiyono (2012: 187) "Data collection can be done in various settings, various sources and various ways". The following data collection techniques conducted in this study: 1. Library Studies
Literature study obtained from a number of literature books, journals and theses relevant to the research variables.
2. Questionnaire (questionnaire)
Questionnaire is a data collection technique that is done by giving a set of written statement to the respondent (employee of PT Telkom Corporate
University Bandung). Through various statements submitted to the respondent will be determined score of each answer so that it becomes quantitative data, to determine the scores the researchers using Likert scale.
According to Sugiyono (2012: 192) "Likert scale is used to measure attitudes, opinions and perceptions of a person or group of people about a phenomenon". In research, this phenomenon has been specified by the researchers‘ specifics, and referred to as research variables. With this scale the variable will be measured to be an indicator. Then this indicator will serve as a starting point to arrange the items of the instrument in the form of statement. An instrument response using a Likert scale has gradation from very positive to very negative, which can be words:
a. Strongly Agree (SS)
b. Agree (ST)
c. Hesitant (RG)
d. Disagree (TS)
e. Strongly Disagree (STS) Each alternative answer will be given a different score, for the purposes of quantitative analysis, then the answer
can be scored:
Tabel 3.1 Instrument LikertScale
No Question Score
1. Strongly Agree(SS) 5
2. Agree(ST) 4
3. Hesitant(RG) 3
4. Disagree(TS) 2
5. Strongly Disagree(STS) 1
Source: (Sugiyono, 2013:94)
3.2 Operational Definition of Variable
Variables are attributes of specific fields or activities. According to Kerlinger (in Sugiyono, 2012: 64) variables are constructs or traits to be studied e.g., aspiration level, income, education, social status, gender, salary and work productivity. Meanwhile,
according to Kidder (in Sugiyono, 2012: 64) variable is a quality in which researchers learn and draw conclusions from it.
According to the relationship between one variable with another variable then, the various variables in the study are divided into:
22
These variables are often referred to as stimulus, predictor, antecedent variables. The independent variable is the variable that influences or becomes the cause of change or the incidence of dependent variable.
In this report which becomes independent variable (X) is Employee Training in PT. Telkom Corporate University Bandung
2. Dependent Variables
These variables are often referred to as output variables, criteria, consequent. The dependent variable is a variable that is affected or becomes a result, because of the independent variables.
In this report the dependent variable (Y) is Employee Career Development in PT. Telkom Corporate