Applied Hierarchical Cluster Analysis with Average Linkage Algoritm
Cindy Cahyaning Astuti1, Rahmania Sri Untari1
1Muhammadiyah University of Sidoarjo, Sidoarjo, Indonesia
Email: [email protected], [email protected]
ABSTRACT
This research was conducted in Sidoarjo District where source of data used from secondary data contained in the book "Kabupaten Sidoarjo Dalam Angka 2016" .In this research the authors chose 12 variables that can represent district characteristics in Sidoarjo. The variable that represents the characteristics of the sub-district consists of four sectors namely geography, education, agriculture and industry. To determine the equitable geographical conditions, education, agriculture and industry each district, it would require an analysis to classify sub-districts based on the sub-district characteristics. Hierarchical cluster analysis is the analytical techniques used to classify or categorize the object of each case into a relatively homogeneous group expressed as a cluster. The results are expected to provide information about dominant sub-district characteristics and non-dominant sub-district characteristics in four sectors based on the results of the cluster is formed.
Keywords: hierarchical cluster analysis,sub-district
INTRODUCTION
the four sectors that represent sub-district characteristics, namely geography, education, agriculture and industry. The results are expected to provide information about dominant sub-district characteristics and non-dominant sub-district characteristics in four sectors based on the results of the cluster is formed.
METHODS
Cluster analysis is a technique used to classify objects into relatively homogeneous groups, called clusters. Objects in each group tend to resemble each other and differ greatly with objects from other clusters. Cluster analysis using the principal components analysis can use interval and ratio-scaled data. Cluster analysis is also called classification analysis or taxonomy numerical analysis because it deals with clustering procedure where each object is only fit into one cluster only, to avoid overlapping [1].
There are several terms used dapam cluster analysis. The terms include the following [2]: • Aglomeration Schedule, is to schedule that provides information about the object or the case will be
merged or entered in clusters on each stage, in a process of hierarchical cluster analysis. • Cluster Centroid, is the average value of all variable objects or cases in a particular cluster.
• Cluster centers, is the starting point of the start of the grouping in non-hierarchical cluster analysis. • Cluster Membership, Membership is showing the clusters, where each object or a case of being
members.
• Dendogram, is a graphical tool to present the results of cluster analysis, or upright vertical lines represent the merged cluster together. Line position on the scale indicates the distance which were merged cluster. Dendogram should be read from left to right.
Terms of normality, linearity, and homoscedasticity highly considered in the multivariate analysis, but not in the cluster analysis. In cluster analysis, researchers should be more concerned with how large a sample representative in population and the presence or absence of multicollinearity. The first step in formulating cluster analysis of the problem of defining the variables used for basic grouping. Then measure the exact distance should be selected. The distance measure determine similarity or dissimilarity of the object to be grouped. To determine the number of clusters requires subjective judgment of the researchers, in addition based on the calculation results objectively. Cluster obtained should be interpreted and expressed in the variables used for the basic formation of clusters. The equation commonly used for calculating the distance between the item X to item Y is a Euclidean distance. The equation used to calculate the Euclidean distance is as follows [3]:
𝑑(𝑥, 𝑦) = √(𝑥1− 𝑦1)2+ (𝑥2− 𝑦2)2+ ⋯ + (𝑥𝑝− 𝑦𝑝)2
= √(𝑋 − 𝑌)′(𝑋 − 𝑌) (1)
There are two types of cluster analysis is hierarchical cluster analysis and non-hierarchical cluster analysis. In the method of hierarchical cluster there are two basic types namely agglomerative (concentration) and divisive (the spread). In agglomerative method, any object or observation is considered as a separate cluster. In the next stage, the two clusters which has some similarities are combined into a new cluster and so on. Instead, the divisive methods, from a large cluster consisting of all objects or observation. Furthermore, the object or observation that the highest value does not resemble separated and so on [4].
Single linkage method defines the similarity between clusters based on the shortest distance from any object in one cluster to any other object. If there is a third object which has the closest distance to one of the objects in the group that has been formed, then the object can be merged into the group. This process continues to form a single group. This method is the most flexible method aglomeratif.
• Complete Linkage
This method is basically the same as the single linkage method. It's just the distance used is the maximum distance. Reasons have the maximum distance is that objects that have little in common can be connected.
• Average-Linkage
Average linkage method also has similarities with two single linkage method. Only the distance used is the average distance of all objects in a group with other objects outside the group. Grouping objects with one another based on the average minimum. Because using the average, then this method is considered more stable, and no bias.
• Centroid method
The distance used in this method is the distance between the center point of the two groups. Where is the center point of the group is the middle value of each variable object in one group. In this method each time a new group is formed, then the center point changes. The advantage of this method is the small effect of outliers in the formation of the group.
• Ward's Method
In the Ward method, distance calculations based on the sum of the squares between the two groups for all variables. This method can be used if the number of observations is not too large. In general, the distance used is a Euclidean distance squared.
The opposite of hierarchy cluster analysis method is non-hierarchy cluster analysis. In this method does not include the "treelike construction" but through the process by placing objects into the cluster at once, forming a particular cluster. The first step in the method is to choose a cluster nonhirarki as initial cluster centers, and all objects within a certain distance placed on cluster formation. Then select the next cluster and the placement of objects continued until all are placed. The objects can be placed again if the distance was closer to the other cluster than the cluster of origin.Non-hierarchy cluster analysis methods associated with the K-means cluster, and there are three approaches used to place each observation on a single cluster. Such approaches include the following [6]:
• Sequential Threshold, Threshold Sequential Method start by selecting one cluster and placing all the objects that are at a certain distance into it. If all objects that are at a certain distance has been entered, then the second cluster selected and put all objects within a certain thereto. Then the third cluster is selected and the process continues as before.
• Parallel Threshold, Threshold Parallel method is the opposite of the first approach by selecting a number of clusters simultaneously and placing objects into clusters that have the distance between the nearest face. In the process, the distance between the face can be specified to include some objects into clusters -cluster. Also some variation on this method, the rest of the objects are not grouped if it is outside a certain distance of a cluster.
• Optimization, the third method is similar to the previous method except that this method makes it possible to put objects back into the cluster closer.
In this research used secondary data sourced from “Kabupaten Sidoarjo Dalam Angka 2016”. Unit of observation in this research was 18 sub-district in Sidoarjo District. In this research the authors chose 12 variables that can represent sub-district characteristics. Operational definition of each variable will be described as
𝑋1: Surface area (km2)
𝑋2: Total population
𝑋3: The number of national and private elementary school
𝑋5: The number of national and private junior high school
𝑋6: The number of national and private junior high school student
𝑋7: The number of national and private high school
𝑋8: The number of national and private high school students
𝑋9: Harvest land area (Ha)
𝑋10: Paddy Production (Kw)
𝑋11: The number of large and small industries
𝑋12: The number of workers in large and small industries The method of analysis in this research is.
1. Standardization of data that have variability research unit
2. Correlation Analysis and Principal Component Analysis on Research Variables
2. Classify sub-district in Sidoarjo with Hierarchical cluster analysis with average linkage algorithm Processing of data by hierarchical cluster analysis with average linkage algorithm performed with SPSS 20, Before the cluster analysis, principal component analysis is done to overcome the correlation between variables, as well as the standardization of variables in order to obtain a variable with the same unit, making it eligible cluster analysis. The results of the cluster analysis then be concluded and interpreted.
RESULTS AND DISCUSSION
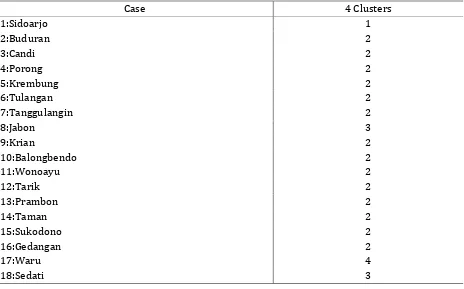
Sidoarjo District consists of 18 Sub-districts formed four clusters, details of four clusters with members that include within each cluster can be seen in Table 1. Grouping four clusters based on the data that provide a general overview of the sub-district characteristics in Sidoarjo, represented by the four sectors, geography, education, agriculture and industry.
Table 1. Clusters Membership
1. Members of Cluster 1: Sidoarjo Sub-district
2. Members of the Cluster 2: Buduran Sub-district, Candi Sub-district, Porong Sub-district, Krembung district, Tulangan district, Tanggulangin district, Krian district, Balongbendo Sub-district, Wonoayu Sub-Sub-district, Tarik Sub-Sub-district, Prambon Sub-Sub-district, Taman Sub-Sub-district, Gedangan Sub-district and Sukodono Sub-district.
3. Members of the Cluster 3: Jabon Sub-district and Sedati Sub-district 4. Members of Cluster 4: Waru Sub-district
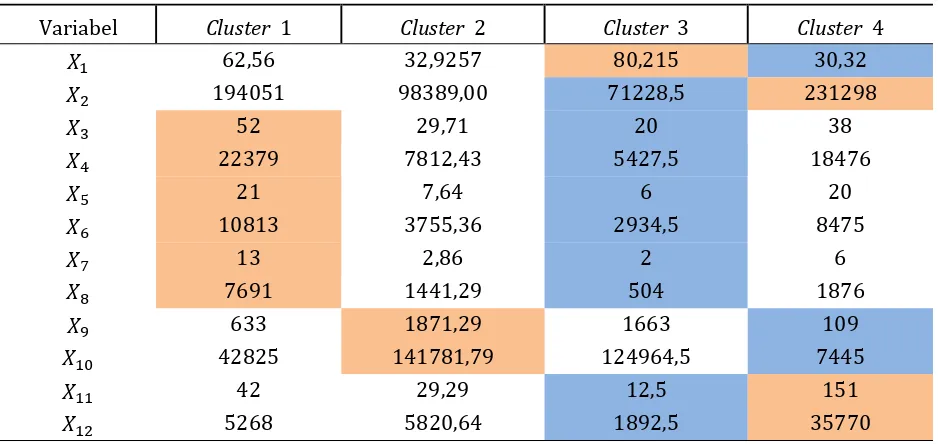
Once known the number of clusters formed and the members of each cluster then performed a descriptive analysis of each cluster. To search for characteristics which are most dominant in each cluster, then look for the highest average of the variables for each cluster. Summary of average value in each cluster can be seen in Table 2.
Table 2. Summary of Average Value in Each Custer
Variabel Cluster 1 Cluster 2 Cluster 3 Cluster 4
𝑋1 62,56 32,9257 80,215 30,32
𝑋2 194051 98389,00 71228,5 231298
𝑋3 52 29,71 20 38
𝑋4 22379 7812,43 5427,5 18476
𝑋5 21 7,64 6 20
𝑋6 10813 3755,36 2934,5 8475
𝑋7 13 2,86 2 6
𝑋8 7691 1441,29 504 1876
𝑋9 633 1871,29 1663 109
𝑋10 42825 141781,79 124964,5 7445
𝑋11 42 29,29 12,5 151
𝑋12 5268 5820,64 1892,5 35770
: Dominant Variable
: Non-Dominant Variable
Based on Table 3 can known dominant characteristics and non-dominant characteristics of the four clusters are formed with the following description :
1. Cluster 1 consist of Sidoarjo Sub-district has dominant variables are
2. Cluster 2 consist of Buduran Sub-district, Candi Sub-district, Porong Sub-district, Krembung Sub-district, Tulangan Sub-district, Tanggulangin Sub-district, Krian Sub-district, Balongbendo district, Wonoayu district, Tarik district, Prambon district, Taman Sub-district, Gedangan Sub-district and Sukodono Sub-district has dominant variable is 𝑋9 and 𝑋10, this indicates that 14 sub-district in cluster 2 have an the average number of harvest land area and the average number of Paddy Production more than four other sub-districts. Both the dominant variables are 𝑋9 and 𝑋10 represent agricultural condition, it indicates that the agricultural condition in 14 sub-districts incorporated in cluster 2 has the most good progress compared to four other sub-districts in Sidoarjo.
3. Cluster 3 consist of Jabon Sub-district and Sedati Sub-district has dominant variable is 𝑋1, this indicates Jabon Sub-district and Sedati Sub-district had an the number of average surface area (km2) which wider than the 16 other sub-districts. While non-dominant variables are
𝑋2, 𝑋3, 𝑋4, 𝑋5, 𝑋6, 𝑋7, 𝑋8, 𝑋11and 𝑋12. Six variables are non-dominant are 𝑋2, 𝑋3, 𝑋4, 𝑋5, 𝑋6, 𝑋7and
𝑋8represents education condition while the two others variables that are non-dominant are 𝑋11 and 𝑋12represents industry condition, this shows that education and industry condition in the two sub-districts has less well development compared to 16 other sub-districts.
4. Cluster 4 consist of Waru Sub-district has dominant variable are 𝑋2, 𝑋11 and 𝑋12, this indicates
that the average number of total population, the average number of large and small industries the average number of workers in large and small industries most are in Waru Sub-district. Both the dominant variables are 𝑋11 and 𝑋12 represent industry condition, it indicates that industry condition in Waru Sub-district has the most good progress compared to 17 other sub-districts in Sidoarjo. While non-dominant variables are 𝑋1, 𝑋9 and 𝑋10. Both the non-dominant variables are 𝑋9 and 𝑋10 represent agricultural condition this shows that agricultural condition in Waru sub-districts has less well development compared to 17 other sub-districts.
CONCLUSION
Based on the results of hierarchical cluster analysis with average linkage algorithm is known that there are four clusters were formed. In general, cluster 1 is a sub-district with good education condition, in cluster 2 is a sub-district with good agricultural condition are very good, in cluster 3 is necessary to the increase the education condition, utilizing dominant land area as well as in cluster 4 is a sub-district with good industrial condition. Based on the results of the analysis, the government may retain the dominant characteristics and increase non-dominant characteristics in each cluster to perform construction and development in their respective sub-districts. Besides equitable development must also consider the potential possessed by each sub-district, so that the education condition, the agricultural condition and the industrial condition has good development.
REFERENCES
[1] O. Yim dan K. T. Ramdeen, “Hierarchical Cluster Analysis: Comparison of Three Linkage Measures and Application to Psychological Data,” Journal of Tutorials in Quantitative Methods for Psychology, vol. 11, no. 1, pp. 1-4, 2015.
[2] J. Supranto, Analisis Multivariat : Arti & Interpretasi, Jakarta: Rineka Cipta, 2010.
[3] R. A. Johnson dan D. W. Winchern, Applied Multivariate Statistical Analysis, New Jersey: Prentice Hall International Inc., 2007.
[4] S. Saracli, N. Dogan dan I. Dogan, “Comparison of Hierarchical Cluster Analysis Methods by Cophenetic Correlation,” Journal of Inequalities and Applications 2013, vol. 1, pp. 203-210, 2013.