Evaluation of Pedestrian's Profile, Activity, and Environment in the
City of Kitakyushu, Japan
Fritz Akhmad Nuzir1, Bart Julien Dewancker2
1 Architecture Study Program, Universitas Bandar Lampung, Bandarlampung, Indonesia 2 Architecture Department, the University of Kitakyushu, Kitakyushu, Japan
* Corresponding authors: [email protected]
Abstract
Various attributes addressing the issues on walking environment and walking condition possibly has distracted the efforts of creating better planning and development to promote walking to the citizen. It will take an enormous effort and time for them to consider all the attributes that are available. Therefore authors assess the possibilities of the utilization of the Pedestrian PL.AC.E. (Profile, Activity, and Environment) and its key-attributes using a survey questionnaire in order to confirm that it can serve as a framework for urban planning or assessment in promoting a walking-friendly environment. The questionnaire was distributed to the case study area which is the city of Kitakyushu, Japan. After collecting and documenting all responses, the results were analyzed using descriptive type of statistical analysis with SPSS software.
Keywords: pedestrian; profile; activity; walking; environment; urban
I.
Introduction
The developments toward the promotion of walking in urban area that focused only on improving the walking environment often fail to encourage people to walk. Thus one needs also to elaborate all factors of walking condition. Many studies from various disciplines were already conducted to define the attributes of walking condition that could be improved. Tsukaguchi had concluded that pedestrian walking behavior is a combination of individual characteristics, infrastructure, and societal attributes [1]. Then Cervero and Kockelman proposed that in order to boost the intensity of non-auto transport modes, density, land-use diversity, and pedestrian-oriented designs could be offered in urban planning recommendations [2]. Prior to this study authors already conducted extensive literature reviews of scientific journals and papers as reported in author`s previous paper [3]. Authors concluded that in order to discuss and elaborate the walking phenomenon there are key-elements of Pedestrian Profile, Pedestrian Activity, and Pedestrian Environment which are being introduced as its abbreviation, PL.AC.E. (ProfiLe, ACtivity, Environment).
contextually defining and/or re-defining the PL.AC.E., authors suggest that an urban area could be assessed for its existing performances and/or be improved based on its potentials to become a walk-able area [4]. However it is necessary to examine and to find the best method to utilize this framework. Therefore in this paper, authors assess the possibilities of the utilization of the PL.AC.E. and its attributes using a survey questionnaire. The purpose is to confirm that it can be a measure for urban planning assessment in promoting a walking-friendly environment. The framework should be able to identify the propensity of each key-attribute in order to understand the characteristic of research subject.
II.
Methodology
The method of data collection using questionnaire was selected based on the finding that this is the most common method for data collection in the study of walking phenomenon. The questionnaire was designed to target different kind of respondents and areas so then the result could be representing different scenarios for the validation process. Mainly there were three methods of questionnaire distribution which were distribution in a group at certain time and place, in-directly through third parties, and on street survey. The questionnaire was prepared based on the elements of Pedestrian PL.AC.E. and its key-attributes. Authors generated 3 parts with total of 68 questions. Part 1 was consisted of 15 questions reflecting key-attributes to understand Pedestrian Profile. The questions were designed as categorical type questions. Several key-attributes related to respondent’s identities were asked separately prior to this part. Part 2 was consisted of 25 categorical type questions reflecting key-attributes of Pedestrian Activity. And part 3 was consisted of 20 ordinal type questions reflecting key-attributes of Pedestrian Environment.
1.
Dataset I: The Students
The respondents were the first year students of the Department of Architecture, the University of Kitakyushu, Japan. The distribution was conducted on April 28th, 2015. 61 sets of questionnaire print-out were prepared and distributed to the students. Authors gave brief explanation about the research purposes prior to distribution. Afterward only 58 questionnaires were returned.
2.
Dataset I: The Typical Families
After the distribution of the questionnaire to the students, authors tried to collect the research dataset from another group of respondents. The typical young nuclear Japanese families were targeted as the respondents which are families generally consisting of working husband/father as head of the household, housewife/mother, and children (mostly at early age) living together in one household.
Therefore the data collection was conducted in collaboration with the local kindergarten which is Asakawa Youchien. This kindergarten is located within the ward of Yahatanishi, Kitakyushu as the case study area. The questionnaire was agreed to be distributed to the parents of the kindergarten pupils of the last (third) grade. 200 sets of the questionnaire were distributed through the teachers. The distribution was conducted on May 25th, 2015. After one week, 43.5% (89 sets) of the questionnaire were returned.
3.
Dataset III: The Urban Commuters
They are the elderly or senior aged people, the joggers or people who walk with their pet, and then the public transport users. There were 2 methods of distribution, firstly by distributing to their mailboxes and secondly by on-street distribution. For type A, the senior aged people, self-administered questionnaire sets
with return envelope were distributed into the respondent’s mailboxes in a residential area located at
Kifunedai and Honjohigashi in Yahatanishi. Meanwhile for type B and type C, the joggers and the people on street, the questionnaires were distributed the questionnaire first hand or directly along the jogging track in Hibikino and along the sidewalk at Gakuen Odori towards the Orio Station. The respondents were given one week to answer and return the questionnaire by post. The deadline was June, 15th 2015. In total there ere 120 sets of questionnaire distributed and 43 sets were returned.
III.
Analysis and Results
In order to comprehend and discuss the result of the data collection, series of statistical analysis were conducted. After inputting the responses, authors started a descriptive analysis using frequency procedure. The purpose was to identify the propensity of each key-attribute and to understand the characteristic of research subject. Because of the limitation of paper space, authors would only provide diagrams of the most stand-out result of the key-attribute.
1.
Pedestrian Profile
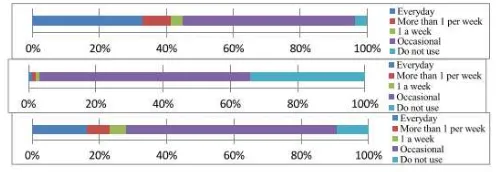
From the analysis using frequency procedure it can be concluded that the common attributes from all 3 datasets are that they are not daily-based public transportation users, as seen from Figure 2, they are/were studying and/or working in the city of Kitakyushu, their level of knowledge towards environmental terms were very low, they lives in Kitakyushu currently especially in the case study area which is in Yahatanishi.
Figure 1. Percentage of public transportation usage of: Dataset I (top), Dataset II (middle), and Dataset III (bottom).
2.
Pedestrian Activity
Figure 2. Percentage of frequent walking location of: Dataset I (top), Dataset II (middle), and Dataset III (bottom).
3.
Pedestrian Environment
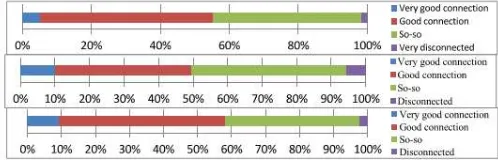
Based on the frequency analysis of the pedestrian environment, there are indications of uncertainty or dissatisfaction for factor such as seating places or rest areas, safety (from traffic), quality of noise environment, population/neighborhood density, accessibility for disable person, general weather condition, aesthetic, and land-use diversity. However these are only possibilities since the dissatisfaction was never mentioned clearly instead represent uncertainty as the result of inexperience profile. On the contrary only the route network or connectivity was appreciated.
Figure 3. Percentage of network or connectivity of: Dataset I (top), Dataset II (middle), and Dataset III (bottom).
4.
Total Result
The propensity of each key-attribute for each dataset was assessed. The answer reaching a percentage of 50% or higher was considered to likely represent a trend or propensity since it showed the homogenous of the answers. Yet the answer with a percentage lower than 50% was considered to fairly represent a trend or propensity since it showed more various answers. However for this assumption, the missing responses could not be over 5% for each question.
For the key-attributes of Pedestrian Profile, most of the answers showed the propensity of each dataset since the dataset was representing a group of people such as students and parents (mostly the mothers). Only Dataset 3 had rather slightly more answers with a percentage lower than 50% since it was more random group compared to the other two. For the key-attributes of Pedestrian Activity, Dataset 1 had rather more responses with a percentage lower than 50% compare to the other datasets presumably because their active and various living style. Based on the propensity reading of the pedestrian environment, there are indications of uncertainty or dissatisfaction for factor such as seating places or rest areas, safety (from traffic), quality of noise environment, population/neighborhood density, accessibility for disable person, general weather condition, aesthetic, and land-use diversity. However these are only possibilities since the
IV.
Conclusion
The data analysis using frequency procedure towards the key-attributes of Pedestrian Profile was proven to be able to identify whether one group represents the profile of pedestrian or not and of which kind. From the datasets we could understand that the students do walk indeed yet it is the second choice after cycling and less related to the environmentally friendliness. Meanwhile the housewives are highly dependent on the use of cars. The urban commuters showed an indication that they indeed use public transportation for daily purpose. Furthermore they combine it with walking. This study was focused toward walking experience within the ward of Yahatanishi of Kitakyushu city. However authors identified that most of the respondents lived in Yahatanishi. The propensity of the frequent walking location from all 3 datasets indicated that people are walking around their neighborhood. Thus the respondents profile represented the people who experience walking in Yahatanishi. Based on this finding, it is recommended that the focus of developing a walkable area should be given towards the residential area especially within the homogenous land-use development. However Dataset 3 had rather slightly more answers with a percentage lower than 50% since it was more random group compared to the other two meaning that we hardly could understand the profile. Therefore this tool requires a designated group of people rather than random sample. It could be based on the neighborhood (the environment) or the social cultural setting (the activities). General sampling will result general reading of which could not assess specific issue on specific area within specific people.
V.
Acknowledgment
This study was supported by the University of Kitakyushu, the Ministry of Research, Technology, and Higher Education, Republic of Indonesia, and Bandar Lampung University (UBL).
REFERENCES
[1] H. Tsukaguchi, K.-Y. Yeh, H.-Y. Jung, U. Vandebona, H. Hsia, and Y. Tajima, “Effect of the Stage
of Life and Lifestyle on Pedestrian Behavior in East Asian Countries,” J. East. Asia Soc. Transp. Stud., vol. 9, pp. 943–955, 2011.
[2] R. Cervero and K. Kockelman, “Travel Demand And The 3ds : Density , Design And Diversity,”
Transp. Res. Part D Transp. Environ., vol. 2, no. 3, pp. 199–219, 1997.
[3] F. A. Nuzir and B. J. Dewancker, “Redefining PLACE for walking: A literature review and
key-elements conception,” Theor. Empir. Res. Urban Manag., vol. 11, no. 1, pp. 59–76, 2016.
[4] F. A. Nuzir and B. Dewancker, “Re-Finding PL . AC . E . for Walking : Assessment of Key