commit to user
i
(Study on Smartphone Blackberry)
SKRIPSI
Compiled to complete the requirements to achieve Bachelor of Economics Degree in Sebelas
Maret University
By :
Dewantika Noor Hidayati Kusmono
F1210018
FACULTY OF ECONOMICS
SEBELAS MARET UNIVERSITY
SURAKARTA
commit to user
ii
CONSUMER ATTITUDES TOWARD HIGH TECHNOLOGY PRODUCT
(Study on Smartphone Blackberry)
Dewantika Noor Hidayati Kusmono
NIM F1210018
The objective of this research is to examine the relationship between quality,
perceive usefulness, easy to usefullness, and prestige as atecendents of consumer attitudes.
This research also examine the relationship between consumer attitudes and intention to buy
Blackberry.
The survey toward 200 samples were conducted in Sebelas Maret University by
using a purposive sampling method. The construct in the model were measured using five
point likert scale.
The results are consumer attitudes toward Blackberry is influenced by perceived
quality, prestige, usefulness, and ease to use. Specifically, perceived quality and prestige play
important role in forming consumer attitudes.
In the relationship between perceived quality, prestige, usefulness, ease to use, and
intention to buy, consumer attitudes play a mediation role fully. It means, there is no direct
effect of perceived quality, prestige, usefulness, ease to use on intention to buy before going
through the mediation variable, consumer attitudes
commit to user
commit to user
commit to user
v
“PMA, Positive Mental Attitude.”
PAARSBAT
“Simplicity is the keynote of all true elegance.”
Coco Chanel
“Yesterday is history, tomorrow is a mystery, today is a gift of God, which is why we call it
the present.”
Bil Keane
“A respectable appearance is sufficient to make people more interested in your soul”
Karl Lagerfeld
“The most beautiful makeup of a woman is passion. But cosmetics are easier to buy.”
commit to user
vi
Along with prayer, love and support I dedicate this thesis to :
Dear my parents, My beloved Mom Dra Kustinah and My Great father Drs Sumono,MSi. I hope this can make you proud, I dedicated special for you, my hearts.
My supervisor, my inspiration, and my guruu Mr Dr Budhi Haryanto, MM.
My little brother, Muhammad Rahardian Kusmono, you are a great barometer for chalenge me to be the best sister.
My Beloved sister, Wardani, you are a nice and kind big sister, I love you.
Paarsbat and Paars, my own brand, what I've been striving and will always being part of my life.
M. Adhitya Farkhan Zamzami, you are the best partner, friends, and teamworks.
My addicted junior friends :
Anisa Febrina, Anita Selviana, Desi Nursita Ratnasari, Unin Retriana Suparno, Surya Adi
Putra, Ulfa Wachidiyah Zuqri.
My adorable high school friends :
Cinandhi Nur Mega, Septiara Silvany Putri, Immas Anggun Cahaya, Twins Anisa and Anita
Kesuma Arum, Ikke Novi Asnia Putri, Faradhiba Zeena Buamona, Anindya Mutiara,
Kharisma.
My Happy friends :
Lolita Ayu Wulansari, Gandess Praseptasari, Fatimatuz Zahra, Fitri Puspaningrum, Andrew
commit to user
vii Solo Young Designers :
Rory Wardhana, Dea Ardyanda, Robby Dion (Pendopo Indonesia), Gunung Dewantara
(Elmer), Suci Utami (Eclair), Made Ayu (De'Ar), Fenny (Lady Tjotjo), Clara Chamichi, Dian
Setyo, Natasha Windura, Shofia Kanza (dinggo).
And everyone around who always colouring every single day. Thank you so much,
commit to user
viii
Praise be to Allah, The cherisher and sustainer of the worlds; God who has been giving
His blessing and mercy to the writer to complete the thesis entitled "Consumer Attitudes
Toward Smartphone Product ( Study on Smartphone Blackberry)."
This thesis is submitted to fulfill one of the requirements to gain college degree of
Economical Faculty in Sebelas Maret University Surakarta.
In finishing this thesis, the writer really gives his regards and thanks for people who has
given guidance and help, they are :
1. Dr. Budhi Haryanto, MM who has given his best guidance to write a quality content of
the thesis. You are Rock, Sir.
2. Drs Sumono, MSi, you are a great father and inspiration, I just try to be as great as you
are.
3. Dra Kustinah, this thesis is the best I can do, I hope it make you proud, mom.
4. My little brother, M. Rahardian Kusmono, you are my barometer for being the best
person I could be.
5. My Sister, Wardhani, thank you for your kindness and patient.
6. My best partner, M Adhitya Farkhan Zamzami, you are great, Man !
7. All My best friends, thanks you so much for your huge supporting. You are all the best
friends I ever had.
Finally, the writer realizes there are unintended errors in writing this thesis. He really
allows all readers to give their suggestion to improve its content in order to be made as one of
the good examples for the next thesis.
Surakarta, October 13, 2012
Author
commit to user
1.5 Research Justification ……...………...……... 7
CHAPTER II THEORITICAL BACKGROUND AND HYPOTHESIS 2.1 Study Position ………... ……….…... ... 8
2.2 Discussion of Observed Variables ... ... 12
2.3 Framework ………. ... 24
CHAPTER III RESEARCH METHODOLOGY 3.1 Study scope ………...…... 26
3.2 Sampling and data collecting ... 27
commit to user
x CHAPTER IV FINDINGS AND DISCUSSIONS
4.1. descriptive analysis ... 37
4.2. research instrument analysis ... ... 39
4.3. structural equation modeling analysis ... ... 44
4.4. hypotheses analysis and discussion ... ... 48
4.5. mediation analysis ... ... 53
CHAPTER V CONCLUSION AND IMPLICATION 5.1 Conclusion .………...………..…... 56
5.2 Implication .………..……... ... 57
5.3 Limitation ….……….... ... 58
References ……..…………...………...… ... 60
commit to user
xi
2.1 Study Position ... 9
3.1. Goodness of Fit Indices ... 31
4.1. Sample Distribution ... 38
4.2. Validity Test Result ... 40
4.3. Reliability Test Result ... 41
4.4. Normality Test Result ... 43
4.5. Outliers Test ... 45
4.6. Goodness of Fit Measurement Result ... 46
4.7. Goodness of Fit Test Result After Modifying ... 48
4.8. Regression Weights Toward Consumer Attitudes ... 49
4.9. Mediation Analysis ... 54
Attachment Appendix 4 Normality Test ... 64
Appendix 5 Outlier Test ... 65
Appendix 6 Validy Test ... 68
Appendix 7 Reliability Test ... 69
Appendix 8 Goodness of Fit Model Before Modified ... 70
Appendix 11 Goodness of Fit Model After Modified ... 74
Appendix 12 Goodness of Fit Model After Modified ... 77
Appendix 13 Hypothesis test ... 78
commit to user
xii
1.1. Theoretical Framework ... 24
Attachment
Appendix 3 Research Path Diagram before Modified ... 63
commit to user
xi
CONSUMER ATTITUDES TOWARD HIGH TECHNOLOGY PRODUCT
(Study on Smartphone Blackberry)
Dewantika Noor Hidayati Kusmono
NIM F1210018
The objective of this research is to examine the relationship between quality,
perceive usefulness, easy to usefullness, and prestige as atecendents of consumer attitudes.
This research also examine the relationship between consumer attitudes and intention to buy
Blackberry.
The survey toward 200 samples were conducted in Sebelas Maret University by
using a purposive sampling method. The construct in the model were measured using five
point likert scale.
The results are consumer attitudes toward Blackberry is influenced by perceived
quality, prestige, usefulness, and ease to use. Specifically, perceived quality and prestige play
important role in forming consumer attitudes.
In the relationship between perceived quality, prestige, usefulness, ease to use, and
intention to buy, consumer attitudes play a mediation role fully. It means, there is no direct
effect of perceived quality, prestige, usefulness, ease to use on intention to buy before going
through the mediation variable, consumer attitudes
commit to user
CHAPTER I
INTRODUCTION
1.1. Background
Consumer attitudes toward Blackberry are interesting to be studied because it
can be used to improve the insights about decision variables that influence consumers to
buy Blackberry. This research also can be used as reference in discussing the theory on
marketing area, especially on consumer behaviour. Unfortunately preview studies
indicated some limitation related to the sampling method, so it impacted on the
limitation of generalitation (Guilabert, 2005). This situation gives an opportunity in this
research in order to design an alternative model which can explain the phenomenon
according to the observed setting.
This model consists of six variables. Namely quality, prestige, usefulness, easy
to use, consumer attitude, and intention to buy Blackberry. Quality, prestige,
usefulness, ease of usefullness are antacedents variables of attitude, it means in order to
increase attitude marketer must stimulate the antacedents variables which express on
marketing strategy to be done (Bloch et.al, 1993; Ang et.al, 2001; Matos et.al, 2007;
Phau and Teah; 2009). Next in this context attitude toward Blackberry is contructed as
mediation variable in the model. It means that attitude mediates between antacedent
variables and intention to buy (Ang et.al, 2001; Huang et.al, 2003; Matos et.al, 2007).
commit to user
done in order to predict how big the actual behaviour toward Blackberry throught this
variables (Zheitaml et.al, 1996; Matos et.al, 2007).
Follow is the explanation of each variable in the model. The first variable is
quality. It is important considered by consumer in influencing consumer attitudes
toward Blackberry. The preview study indicated that the paradigm of branded products
being perceived as a straight forward guarantee of quality and consistency is no longer
valid (Zajas and Crowley, 1995; Yelkur, 2000; Temporal and Lee, 2000). So consumers
started to perceive the quality and features offered by non-branded products similar to
those of branded ones. It means that Blackberry as a branded product having a high
quality has an positive influence to customer attitudes toward Blackberry.
The second variable is Prestige. This variable can be influencing consumer
attitudes toward Blackberry. The consumers develop prestige meanings for brands
based on interactions with people, object properties, and hedonic values. Such
interactions occur at personal and societal levels. Thus, a brand's prestige is from a
multitude of interactions between the consumer and elements within the environment.
Based on the explanation above consumers have a prestige sense when using
Blackberry.
The next variable is Usefulness, it is also important variable which can
influencing consumer attitudes toward Blackberry. Perceived usefulness is defined as
the degree to a person who believes that using a particular system would enhance job
performance. So, it can influence customer attitudes toward Smartphone product by its
The fourth variable is ease to use. It has some differences with usefullness.
These two instruments contained semantic differential scales of usefulness (relevance,
perceived utility, and job effects) and ease of use (flexibility of system, understanding
of system, feeling of control, and error recovery). According to Davis (1986) from the
previous findings in the literature, he established well-recognized definitions and
measures for perceived ease of use and perceived usefulness in the context of using
particular systems. Perceived ease of use refers to the degree to which a person believes
that using a particular system would be free of effort. So it can be as another variable on
which has a positive influence customer attitudes toward Blackberry.
The dependent variable of this research is Intention to buy Blackberry. Based
on the the preview study literature, Lavidge and Steiner introduced The Stair-Step
model that explained consumer behavior toward intention to purchase. The rationale
behind this model is beliefs are formed about a brand or a product, influenced by those
beliefs, attitudes toward the brand or the product are consequently formed, and finally,
from these attitudes individuals will develop an intention to buy or not buy the
particular brand or product (Guilabert, 2005).
The independent variable of this research is consumer attitudes toward
Blackberry. This variable is predicted in influencing the intention to buy Blackberry.
Build upon Allport’s definition (1935), attitudes are typically defined as learned
predispositions to respond to an object or class of objects in a consistently favorable or
unfavorable way. In classical attitudinal theory, the importance of studying attitudes
commit to user
consequent behavior toward the object that this attitude will produce (Allport, 1935;
Rosenberg, Hovland, Abelson, McGuire & Brehm, 1960; Fishbein & Ajzen, 1975;
Staw & Ross, 1985; Eagly & Chaiken, 1993). If attitudes and behavior are highly
correlated, then the behavior of a person can be predicted once her/his attitude has been
established (Ajzen & Fishbein, 1977).
Based on the variable relation, it can be defined the research problems related
to the variable proposition on the models. Following are the formulated problem of this
research.
1.2. Research Problems
Prior study indicate quality has positive relationship to the consumer attitudes
(Tellis and Geath, 1990; Gelb, 2010). It means the higher of the quality equivalent to
the higher of consumer attitudes. Hence, the first problem of this research is :
Does quality influence on consumer attitudes toward Blackberry ?
Prestige is also influencing the consumer attitude. Consumers will have a sense
of prestige when using Blackberry. So, the second problem of this research is :
Does prestige influence on consumer attitudes toward Blackberry ?
Perceived usefulness is defined as the degree to which a person believes that
using a particular system would enhance his or her job performance. People assume
that by using Blackberry their job performance incerasing. So it can be influence the
Does perceived usefulness influece on consumer attitudes toward
Blackberry ?
Perceived ease of use can be influence to the costumer attitude in many
aspects, there are : flexibility of system, understanding of system, feeling of control, and
error recovery. So, it can be included in the next problem of this research is :
Does perceived ease of use influence on consumer attitudes toward
Blackberry?
Based on Allport’s definition (1935), attitudes are typically defined as learned
predispositions to respond to an object or class of objects in a consistently favorable or
unfavorable way. If attitudes and behavior are highly correlated, then the behavior of a
person can be predicted once her attitude has been established (Ajzen & Fishbein,
1977). Based on those explanation the fifth problem of this research is :
Does Consumer attitude influence on Intention to Buy toward
Blackberry?
1.3. Research Purpose
This study aims to design an alternative model that suitable to consumer
attitudes toward Blackberry phenomenon because the model in preview study has a
limitation related to the sampling method, so it impacted on the limit of generalitation
commit to user
Specificaly, this study aims to explain the correlation among of the observed
variables. First, the influence of quality, prestige, usefulness, and ease of usefulness on
consumer attitudes. Second, the influence of consumer attitudes on intention to buy.
Third, the mediation analysis of consumer attitudes in this reaserch.
1.4. Research Implication
Implication of this study are devided into theoritical implication, practical
implication, and continous study implication.
· Theoretical Implication
This research can be used as reference in discussing the theory on marketing
area, especially on consumer attitudes toward Blackberry. Moreover, this study
is hoped could enrich theoritical understanding in marketing study.
· Practical Implication
This research is expected to give insight about Indonesian consumer attitudes
toward Blackberry. Therefore, it can be used in understanding the attitudes and
set a strategy to increase sales in Indonesia.
· Future Study Implication
This study is expected to give an insight for continous study. Specially, in
order to increase the external validity of the theory that is conceptualized. It is
important because this study has limited application. Therefore, it needed
continous study, esspecially on development the measurement in another
1.5. Research Justification
To understanding the research importance and relevance. There are thtree topics on
research issue, research object and model generalization principle.
· Research issue
The main issue of this research is consumer attitudes toward Blackberry
product. The result of this research is expected to give an important insight
about the decision variables that influence consumers to buy Blackberry.
· Research object
The object of this research is Blackberry. This selection is considerated on the
homogeneity of the sample that will be tested, in order to explain the
phenomenon precisely.
· Model generalization principle
This research is based on the conditional scope setting and it impacts on the
limitation in generalization. Hence, to generalize the models to different
setting, it needs to understand the external factors that may potentially
influence the model. In the end it will affect the appropriate of tailoring
commit to user
8
CHAPTER II
THEORITICAL BACKGROUND AND HYPOTHESIS
This chapter describe 3 aspects, there are : (1) study position (2) variable
describtion and hypotheses development (3) theoritical model. It is important in giving
the theoritical basis that is used to explain the formulated hypothesis that will be tested.
Hence, this study can be thrustworthy from theoritical aspect. The explanation of each
topic will be explained below.
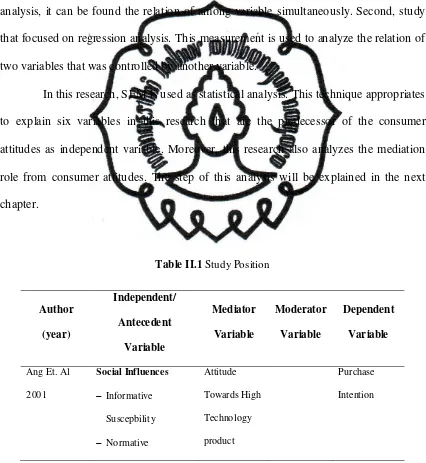
2.1Study Position
This study can be explained by a comparison between the variables in previous
studies (see Table II.1). In this context, the dependent variable is conceptualized into the
construction of some, there is a willingness to purchase the product (Albers - Miller,
1999), purchase intention (Ang et.al, 2001; Huang et.al, 2005; Maldonado et.al, 2005,
Phau and Yeah, 2009) states the option to buy the High Technology product, evaluation
of product attributes (Bloch et.al, 1993), and behavioral intentions (Matos et.al, 2007).
Moreover, independent variable is conceptualized into divergences
construct,perceive quality(Ang et.al, 2001; Bloch, 1993, Cheung and Prendergast,
2006), product type (Albers-Miller, 1999), perceived usefulness (Albers-Miller, 1999;
use (Albers-Miller, 1999; Bloch, 1993; Huang et.al, 2005; Matos et.al, 2007), and
social factor (Ang et.al, 2001; Matos et.al, 2007; Phau and Teah 2009).
There are two statistical analysis tools that are used in previous research. First,
the study that used Structural Equation Modeling (SEM) as analytical tools. This
technique is used to analyze the structural analysis among of variable. Through this
analysis, it can be found the relation of among variable simultaneously. Second, study
that focused on regression analysis. This measurement is used to analyze the relation of
two variables that was controlled by another variable.
In this research, SEM is used as statistical analysis. This technique appropriates
to explain six variables in this research that are the predecessor of the consumer
attitudes as independent variable. Moreover, this research also analyzes the mediation
- Ease to use
commit to user
2.2Discussion of Observed Variables and Hypothesis Formula
The explanation in this sub chapter is focused on definition and relationship
includes favorable or unfavorable evaluation, emotional feeling, and behavioral
tendency (Kotler and Keller, 2008). Brand attitude is the continuous preference or
loathing tendency of the consumer towards a certain brand (Fishbein and Ajzen, 1980)
and the overall evaluation the consumer has towards the brand. The evaluation base is
prominent benefit or image is beneficial and then forms an overall brand attitude
(Wilkie, 1986), which is the comprehensive evaluation result of the consumer attitude
towards the brand attribute (MacKenzie and Spreng, 1992). Apositive individual
attitude towards a brandmay increase the chance of using the brand (Kotler and Keller,
2008).
Following Allport’s definition (1935), attitudes are typically defined as learned
predispositions to respond to an object or class of objects in a consistently favorable or
unfavorable way. In classical attitudinal theory, the importance of studying attitudes
rests on the connection between the attitude toward the particular object and the
consequent behavior toward the object that this attitude will produce (Allport, 1935;
Eagly & Chaiken, 1993; Fishbein & Ajzen, 1975; Rosenberg, Hovland, Abelson,
McGuire & Brehm, 1960; Staw & Ross, 1985). If attitudes and behavior are highly
correlated, then the behavior of a person can be predicted once her attitude has been
established (Ajzen & Fishbein, 1977).
Several previous1studies have suggested three components of attitudes :
1. Cognitive component – the knowledge or cognition of the product formed after
integrating direct experience or information obtained.
1
Consumer attitude is supported by study from (Rosenberg and Hanland, 1960; Lutz et al., 1986;
commit to user
2. Affective component – the emotion or affective reaction of the consumer towards
a product or brand, representing the direct or overall evaluation of the consumer
towards the product.
3. Conation component – the possibility or tendency of an individual act or behave
with regard to the product.
Preview studies have treated only cognitive/utilitarian and affective/hedonic
components as perceptual attitude factors (Syvia and Chan-Olmsted, 2005; MacKenzie
and Spreng, 1992; Muray and Vogel, 1997; Voss et al., 2003), while few studies have
treated product/brand attitude as one dimension, i.e. affective component (Osgood et al.,
1957). Because belief, affection, and intentions are components in most accepted
hierarchical conceptualizations of the communication process (Engel et al., 2006;
McGuire, 1976), this study adopted the theory of the three components of attitude. This
research interpreted cognition as brand trust (Delgado-Ballester, 2004), affection as
brand affection (Vakratsas and Ambler, 1999; Howard and Gengler, 2001), and
conation as purchase intention (Bennett and Rundle-Thiele, 2000). Based on the
literature, the antecedents of consumer attitudes toward Blackberry will be explained
below.
2.2.1.1 Perceive Quality
The terms perceived quality and satisfaction have been used interchangeably,
perceived quality and satisfaction differ in two ways: perceived quality is a more
specific concept based on product and service features, whilst satisfaction can result
from any dimension (e.g. loyalty, expectations). In addition, perceived quality can be
controlled to a certain degree by a company whilst satisfaction can not. Thus, it is
suggested that when perceived quality and satisfaction are regarded as overall
assessments, perceived quality is understood as an antecedent of satisfaction and
therefore precedes it (Llusar, Zornoza & Tena 2001, p.721).
Quality is a multidimensional concept that cannot be easily defined or
measured, a distinction can be made between objective quality and perceived quality.
Objective quality refers to the actual technical excellence of the product that can be
verified and measured (Monroe & Krishman, 1985). In contrast, perceived quality is the
consumer’s judgment about a product’s overall excellence or superiority (Zeithaml,
1988). Perceived product quality is a global assessment ranging from bad to good,
characterized by a high abstraction level and refers to a specific consumption setting.
Blackberry is a high quality Smartphone that is characterized by a good global
assessment. In addition to the Blackberry has many advantages for its users. This
phenomenon leads to formulated hypothesis as follow :
H1: Perceive quality has positive influence on consumer attitudes towards
commit to user 2.2.1.2 Prestige
This interpretation recognizes that the definition of prestige may vary for
different people, depending on their socioeconomic background. Translated into
marketing terms, consumers develop prestige meanings for brands based upon
interactions with people (e.g., aspired and/or peer reference group), object properties
(e.g., best quality), and hedonic values (e.g., sensory beauty). Such interactions occur
at personal and societal levels. Thus, a brand's prestige is created Academy of
Marketing Science Review from a multitude of interactions between the consumer and
elements within the environment. Prestige-seeking behavior is the results of multiple
motivations, but in particular the motives of sociability and self-expression. In sum we
define five values of prestige combined with five relevant motivations, as follows.
A review and attempt to reconcile the accounts from the literature of
economics, marketing and psychology, show a general lack of consensus relating to the
definition of prestige. Prestige in different areas leads to different definitions, and each
discipline may have its specific definition concerning the concept of prestige.
· Economists have used luxury instead of prestige in comparisons between luxuries and
· Marketing textbooks suggest the concept of prestige, when an organization is planning
to position a product as high quality or exclusive, prestige pricing is setting a rather
high price to suggest high quality or high status (McCarthy and Perreault 1987, 506).
· Finally, social psychologists have long been using the concept of prestige to study the
effect of group forces on the formation and change of opinions and attitudes (e.g.,
Lorge 1936 and Asch 1948), or to assign prestige scores to social occupations (see,
Wegener 1992, for review).
Horiuchi (1984) observed that it made intuitive sense to classify luxury
products as high involvement rather than low involvement. However, his work
contributed to demonstrate that "the consumer decision-making process in the luxury
goods market does not follow the high-involvement decision-making process of
consumer behavior, although the high-involvement model is generally assumed to be
applicable to both luxury goods and mass-produced high quality goods" (Horiuchi
1984, 165). On the other hand, when a product is very good but has not quite achieved
the status of a luxury good, consumers seem to consider it as one of the mass-market,
high-quality brands. In such a case, the high-involvement decision-making process does
seem to apply (Horiuchi 1984, 171). However, Horiuchi (1984) identified a third model
that he called M4-P, which indicated a decision-making process almost irrational,
casual, having an impulsive-purchase nature. This latter result supports the argument
that luxury products are often bought for non-functional reasons and perhaps only serve
commit to user
Hence, the decision-making process for prestige brands was interpreted from
different models such as models of conspicuous consumption (e.g., Bearden and Etzel
1982; Mason 1981 and 1992), models of involvement (e.g., Horiuchi 1984; Rossiter,
Percy, and Donovan 1991), the materialism model (e.g., Belk 1985; Richins 1994a and
1994b), and research directly related to prestige (e.g., Veblen 1899; Leibenstein 1950;
Dubois and Laurent 1994 and 1996; and Pantzalis 1995). This table provides examples
of research which were used to identify a set of perceived values of prestige.
Leibenstein (1950 and 1976) used the original typology from Veblen (1899)
with the Veblen effect, and included two other derivatives, the snob and bandwagon
effects. More recently, Pantzalis (1995) studied the effects of price, limited availability,
and social value of prestige brands. His study revealed the dynamics between the three
typologies and the relative acceptance of prestige brands in terms of time.
As a general rule, prestige products have been used as an example of
extreme-end high-involvement decision making. The assumption is that prestige products are
infrequently purchased, require a higher level of interest and knowledge, and strongly
relate to the person self-concept. For instance, Rossiter, Percy, and Donovan (1991)
stated that the distinction between high and low involvement was dichotomous rather
than continuous, and presented a second dimension operationalized as
informational-transformational. Their framework reasonably assumes that prestige products are
high-involvement products, and that transformational brand choices (i.e., sensory
gratification, intellectual stimulation, and particularly social approval) are the primary
distinguish prestige products from normal products, it does not significantly
differentiate the level of prestige among prestige brands (Horiuchi 1984). In this
research three types of brands were categorized as prestigious; upmarket brands,
premium brands, and luxury brands, respectively in an increasing order of prestige.
Therefore, in this paper, we refer to prestige brands when discussing the brand category
whereas we used luxury when relating to the extreme-end of the prestige-brand
category. Hence, it was expected that people would have different perceptions of the
level of prestige for the same brands, and that the overall prestige level of a brand
would consider the prestige perceptions from different people.
Related to explanation above, Prestige is considered as a variable that have
positive correlation on consumer Attitude toward Blackberry (Delgado, 2002; Thurau
et.al., 2002). This condition underlie the following hypothesis :
H2: Prestige has positive influence on consumer attitudes towards Blackberry
2.2.1.3 Usefulness
To discuss how people use high technology and what they intend to use it for
(www.wordnet.princeton.edu), it is necessary to reflect on the development of the high-
technology industry. During the industrial age, inventions such as the light bulb or the
motor car provided products, created to satisfy real needs of real people (Tomkins,
2005). However, as life gets busier and more stressful, people are forced to adapt the
commit to user
lives, even though they might not have fully understood what it can do to help them
(Kallaman and Grillo, 1996). This adaptation process is based on the evaluation of
meaningful attributes that support a consumer’s beliefs, whereas, the consumer’s frame
of reference and evaluation criteria shifts due to the constantly changing environment,
which again, makes it impossible to define a general pattern of buying behaviour
(Saunders et al., 2003; Hill, 2003; The Economist, 2005; Jiang, 2004). Solomon et al.
(2002) argue that people are poor in their estimation of attribute co-variation, not only
that they tend to see what they are looking for and ignore everything that says anything
different, but also to the extent that consumers regularly overstate the numbers of
attributes they use in a product.
Nevertheless, nowadays consumers expect convenience, quality and service of a
product to be available at anytime and at any place (Yelkur, 2000; Winkler, 1999;
Silverhart, 2004), and furthermore adopt high-technology in order to continue in a
particular social group or to enter one they want to belong to (Kim et al., 2001;
Haughey, 2004).
Recalling the development of this particular market segment and its massive
impact on consumer’s buying behaviour, it has been said that the satisfaction of needs
during the industrial age was adequate to the demand created by the consumer
(Tomkins, 2005). Offered benefits were usually easy to see and clearly understood.
While consumers in the past were usually driven by market share when making a
buying decision, in present-day markets even brands lose their status of providing a
and Train, 1996; Jiang, 2004; Keller, 2003; Temporal and Lee, 2000). Also clearly
stated in the literature review, consumers are increasingly satisfied with the performance
and quality of industry-standard products (Kapur et al., 2003). In this context, it has
already been mentioned that people use a combination of attributes to evaluate their
decision, whereas, consumers are very poor in their personal evaluation of choosing
those attributes (Snoj et al., 2004; Riquelme, 2001; Solomon et al., 2002). Considering
these facts plus people’s compulsion of adapting to the changing environment on a
continuous basis, a close-by interpretation of the development is that consumers follow
a trend set by other people and companies, i.e. the environment, used by consumers as
references and for information gathering. Supporting the assumption of people
following their desires by adapting to environmental changes, it was mentioned in the
literature that consumers nowadays try to attain social belonging through buying
particular products (Jiang, 2004; Haughey, 2004). This phenomenon lead to formulated
hypothesis as follow :
H3 : Usefulness has positive influence on consumer attitudes towards Blackberry
2.2.1.4 Ease to Use
The importance of the perceived usefulness and perceived ease of use of
different types of systems has been well documented and studied. Different items have
been used to capture the nature of these constructs or similar ones. For instance, Schultz
commit to user
perceived usefulness. Later on, Bailey and Pearson (1983) introduced two instruments
to measure computer user satisfaction closely related to perceived usefulness and
perceived ease of use. These two instruments contained semantic differential scales of
usefulness (relevance, perceived utility, and job effects) and ease of use (flexibility of
system, understanding of system, feeling of control, and error recovery). It was Davis
(1986) who, from the previous findings in the literature, established well-recognized
definitions and measures for perceived ease of use and perceived usefulness in the
context of using particular systems. In Davis’s (1989) words, perceived ease of use
refers to “the degree to which a person believes that using a particular system would be
free of effort”. Perceived usefulness is defined as “the degree to which a person
believes that using a particular system would enhance his or her job performance”.
Based on the explanation, eease tp use is considered as a variable that have positive
correlation on consumer Attitude toward Blackberry. This condition underlie the
following hypothesis :
H4 : Ease to use has positive influence on consumer attitudes towards Blackberry
2.2.2 Intention to Buy Blackberry
One theory that refers to this correlation and has been relevant in the consumer
behavior field is the hierarchy of effects model. In 1961, Lavidge and Steiner introduced
what they called the stair-step model that explained consumer behavior toward
about a brand or a product; secondly, influenced by those beliefs, attitudes toward the
brand or the product are consequently formed; and finally, from these attitudes
individuals will develop an intention to buy or not buy the particular brand or product.
This theory is important because it provides a basis for defining key elements
that influence consumer behavior (Assael, 1998). For this research, the key part of this
theory lies in the idea that attitudes are formed first and those will influence how
consumers act consequently with regard to the particular brand or product.
The Intentions to buy variable is in terms of its direct wording, a measure of
intention or likelihood or propensity to buy in the future. The question therefore arises
how the Intentions-to-buy ratings do actually tie in with future purchasing or-as a
rough equivalent-with future "Use". For example, is a change in Usage preceded
by a change in Intentions-to-buy? As already mentioned in Section 3, there is no
empirical evidence that changes in the percentage of claimed Users tend to lag
behind corresponding changes in the percentage of informants who have expressed
an Intention-to-buy. These negative results are, of course, in terms of the overall
percentages U and I. Additional, and possibly more sensitive, information on the
relation between Intention-to-buy and future Use can be obtained on an individual
informant basis, if initial informants are reassessed concerning their (claimed) Usage
habit. Hence, the last hypothesis is formulated as follow :
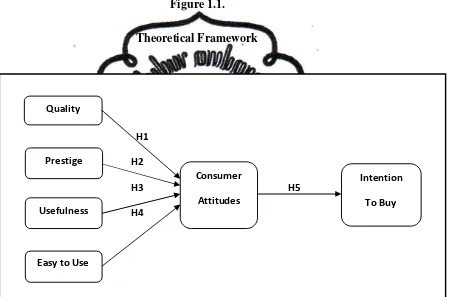
commit to user 2.3Theoritical Model
Based on five formulated hypothesis, the conceptual variables relationship is
showed in model below (see figure1.1).
Figure 1.1.
Theoretical Framework
Figure 1.1 explained the relationship of six variables: First, the positive relation
between perceive quality and consumer attitude. It is based on H1, which explains the
H1
H2
H3 H5
H4 Quality
Prestige
Usefulness
Easy to Use
Consumer
Attitudes
Intention
higher quality, the higher consumer attitude toward Blackberry. Second hypothesis
explains the positive relation of prestige on consumer attitude. This relation is signed on
H2 which explains that the higher prestige, the higher consumer attitude toward
Blackberry. Third, explanation of relation usefulness on consumer attitude. This is
based on H3 that supposes the positive correlation between usefulness and consumer
attitude, it means the higher usefulness, the higher consumer attitude toward
Blackberry. The next explanation of relation ease to use Blackberry on consumer
attitude. This is based on H4 that supposes the positive correlation between ease to use
and consumer attitude. Finally, the last explanation is the relationship between
consumer attitude on intention to buy Blackberry. This proposition is based on H5,
commit to user
26
CHAPTER III
RESEARCH METHODOLOGY
This chapter aims to give a valid and reliable basic in processing the data. It is
important to be explained, because the data refer to respondent’s perception that is probably
impacted on bias information because of their condition when they are surveyed. Therefore, this
data must be tested to make an assurance on the validity and n reliability aspect. Hence, the
information can be trustworthy on methodological aspects. In supporting this effort there are
four topics explained i.e. (1) study scope, (2) sampling and data collection method, (3)
operational definition and research instrumental measurement, and (4) analysis method.
3.1 Study Scope
This study is categorized as applied research. It is aimed to give an insights about
decision variables that influence consumers to buy Blackberry. Therefore, this study is expected
to give an understanding about the consumer attitudes toward Blackberry.
The data in this study is cross sectional. It means that the data is collected through
direct interview on one point in time event. Consequently, the constructed model cannot
accommodate the change of the phenomenon in the future because of the time progression.
Therefore, to generalize this study into different context, it is important to redesign the model
In this study, the data is collected through survey method that is guided by
sample must understand about the research problems.
These requirements are needed in this study to avoid the respond biases that may caused
by respondent misunderstanding related to the questionnaire that must be answered.
The data are collected through direct meeting that is guided by questionnaire toward
200 respondents. This quota size is considered to represent of Blackberry users. Furthermore, it
also fulfilled the minimum criteria of statistical tool that was used in this study.
3.3 Operational definition and research instrumental measurement
3.3.1 Consumer attitude
Attitude is an overall persistent evaluation towards people, things, or goods. It is a
consistent positive or negative reaction towards certain things through learning, which includes
favorable or unfavorable evaluation, emotional feeling, and behavioral tendency (Kotler and
Keller, 2008). The indicators is measured by likert scale that ranged from 1= strongly disagree
until 5= strongly agree. The indicators of this variable are :
- Benefit of Blackberry
1
commit to user - Blackberry is a better choice
- Like
- Enthusiastic
3.3.2 Quality
Perceived quality is a specific concept based on product and service features (Rust and
Oliver, 1994). it can be controlled to a certain degree by a company whilst satisfaction can not.
Thus, perceived quality is understood as an antecedent of customer attitude (Llusar, Zornoza &
Tena, 2001). The indicators is measured by likert scale that ranged from 1= strongly disagree
until 5= strongly agree. Following is the indicators of this variable :
- Blackberry has a good design
- Blackberry is a reliable
- Durability of the Blackberry
- Blackberry is not easily damaged
3.3.3 Prestige
The concept of Prestige product is infrequently purchased, require a higher level of interest and
knowledge, and strongly relate to the person self-concept. The indicators is measured by likert
scale that ranged from 1= strongly disagree until 5= strongly agree. The indicators of this
variable are :
- Blackberry as the exclusive product
- Blackberry is a luxury product
- Increasing confidence
3.3.4 Usefulness
Usefulness is the expectation of consumer about convenience, quality and service of a product
to be available at anytime and at any place (Yelkur, 2000; Silverhart, 2004), and furthermore
adopt high-technology in order to continue in a particular social group or to enter one they want
to belong to (Kim et al., 2001; Haughey, 2004). This variable consists of three indicators. This
indicators is measured by likert scale that ranged from 1= strongly disagree until 5= strongly
agree. The indicators of this variable are :
- Useful in work
- Convenience in use
- Good product performance
- Necessary in dealing with others
3.3.5 Easy to use
Ease to use is the degree to which a person believes that using a particular system
would be free of effort. This variable consists of three indicators. This indicators is measured by
likert scale that ranged from 1= strongly disagree until 5= strongly agree.
- Flexibility of system
- Blackberry is simple to use
- Easy on error recovery
3.3.6 Intention to buy
Intention to buy is used to a measure of intention or likelihood or propensity to buy in
commit to user that ranged from 1= strongly disagree until 5= strongly agree.
- Probability to buy Blackberry
- Probability to say favorable things about Blackberry
- Preference to buy Blackberry
3.4 Analysis Method
3.4.1 Descriptive Analysis
Descriptive analysis of sample is aimed to make a profile of respondents that is used as
background factor in this study. It used to generalize the result on population contact. So, to
apply this study into different background factor, it is needed to look on the demographic factor
that can influence the model.
3.4.2 Statistical Analysis
Statistical test are first step to make assertion of the data. It is contained of three tests
there are; (1) validity test, (2) reliability test, (3) outliers test. The explanations of each
paragraph are stated as follow.
a. Validity Test
Validity test aimed to know the accuracy and precision of measurement tool in
measuring the variable. In this test each item will be tested related to the relationship to the
variable. If the items have small loading, it will be eliminated to data result because it
cannot represent the construct. In this study, validity test will be processed by AMOS
version 18 by using confirmatory factor analysis technique. If the factor loading score is
higher than 0.40 it means the item is valid (see Hair et.al., 1998)
In reliability test, the consistency of each item will be tested. So, the higher the
correlation, the higher the consistency of each item. Reliability is measured by Cronbach
Alpha. The item is reliable if the score is higher than 0.7 (Ferdinand, 2002).
Therefore, it is expected that reliability procedure could make assurance of data
accuracy and feasibility when it is being tested by another statistical analysis.
c. Normality Test
SEM has conditioning normal data distribution. If data distributed is abnormal,
maybe it will influence the data analyze result leaning to high bias data. There are two
steps to examining data normality in this research: (1) normality examination for each
variable (univariate normality) and (2) normality examination collective variables
(multivariate normality). It examined twice because if each variable normally partial
distributed, the collective variables must have normally distributed too. In this research,
normality examination counted with computerize program, AMOS 18.
The postulate used in this research to examine data normality is critical ratio (cr)
value. Data distribution said normal if cr skewness value or curtosis cr value is between
-2,58 to +-2,58 (Ghozali, 2008). Besides, Curran et al. In Ghozali and Fuad (2005) divides
data distributed into three parts, there are:
i. Normal, if z statistic value (Critical Ratio or C.R.) skewness < 2 and C.R. curtosis value
is < 7.
ii. Moderately non-normal, if C.R skewness is between 2 to 3 and C.R curtosis value is
between 7 to 21.
commit to user 3.4.3 Structural Equation Modeling Analysis
Structural Equation Model Analysis aims to estimate the multiple regression
equation separately, but each has ties simultaneously or concurrently. In this analysis it is
possible there is more than one dependent variable, and this variable becomes possible
independent variables for the other dependent variables.
In principle, the structural model aims to test the causative relationship between
variables, so if one of the variables changed will be changes in other variables as well. In this
study, data are processed using Analysis of Moment Stucture Software or AMOS version 18.
The evaluation of SEM assumption will be explained below.
a. Evaluation of SEM Assumption
1. Sample Adequacy
This research will use Maximum Likelihood Estimation (MLE). Hence,
100-200 questionnaires are required to fulfill the criteria (Ghozali, 2008;
Wijaya, 2009)
2. Outliers Test
Outlier is observation that appears with extremely values which
has unique different characteristic from others observation and it appears
on extreme value whether it on one variable or combination variables
(Hair et al in Ferdinand, 2006). Outlier can be handled with eliminating
one or some data which far from the criterion.
In this study, outlier test will use AMOS version 18. Multivariate
<0,050 and the value of Mahalanobis d-squared will be evaluated using c2 at
degree of freedom as much as number of variables which is used in research
(Ferdinand, 2006). If the value result of the observation is below the criteria, the
observation should be eliminated as necessary.
b. Evaluation toward Goodness of Fit
In this study, the approach used to test the structural model is Structural
Equation Model (SEM) considered by previous study measurement (Byrne, 2001;
Matos et.al, 2007). This approach is used to test the structural model to different groups
simultaneously. The difference between groups can be evaluated based on the
goodness-of-fit model suggested on the following criteria:
· Chi Square:
The purpose of this analysis is to develop and test a model that fits the
data. x2 data test with low value and generate a greater level of significance than
0.05 would indicate no significant difference between the estimated covariance
matrix. Chi square test is highly sensitive to the very small sample or very big
sample. Therefore, these tests need to be equipped with the test equipment.
· Goodness of Fit Index (GFI)
This index reflects the level of overall model fit, calculated from the
residual squares of the model that predicted compared to actual data. The value
result that approaching 1 implies that the model tested had goodness of fit.
commit to user
RMSEA is an index used to measure the model fit chi square statistic to
replace the large number of samples. RMSEA values ≤ 0.08 indicate a good
index to receive the fitness of a model.
· Adjusted Goodness of Fit Index (AGFI)
This index is a development of GFI that adjusted for the ratio of the
degree of freedom model proposed by degree of freedom from the null model
(single construct model with all indicators of construct measurement.) The
recommended value is AGFI ≥ 0.90. The greater the value of AGFI, the better
fitness owned by the model.
· Trucker Lewis Index (TLI)
TLI is an incremental fit index that compares the tested model with the
null model. Recommended acceptance of the value is the value of TLI ≥ 0.95.
· Comparative Fit Index (CFI)
CFI is also an incremental fit index. The size of this index is in range 0
to 1, and values result that approaching 1 indicates the model has a good level
of fitness models. This index is highly recommended to be used for this index is
relatively insensitive to sample size and less influenced by the complexity of the
model. The recommended value of receipts is CFI ≥ 0.90.
· Normed chi square (CMIN/DF)
Cmin / DF is a measurement of the value of chi square divided by
degree of freedom. This index is a parsimonious fit index that measures the
are expected to reach the level of fitness. Value result that recommended to
receive the suitability model is CMIN/ DF <2.0 / 3.0.
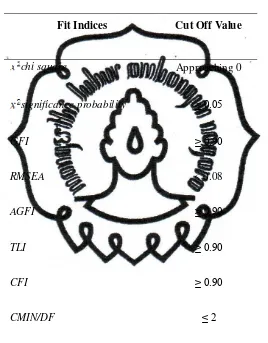
Table 3.1. Goodness of Fit Indices
Fit Indices Cut Off Value
chi square Approaching 0
significance probability ≥ 0.05
GFI ≥ 0.90
RMSEA < 0.08
AGFI ≥ 0.90
TLI ≥ 0.90
CFI ≥ 0.90
CMIN/DF ≤ 2
commit to user
36
CHAPTER IV
FINDINGS AND DISCUSSIONS
This chapter describes five aspects, there are: (1) descriptive analysis (2) research
instrument analysis (3) structural equation modeling analysis (4) hypotheses analysis and
discussion (5) mediation analysis. These processes will explain the phenomenon based on the
hypotheses of this research. Hence, the data that has been analyzed can be trustworthy in
scientific aspect. The explanation of each topic will be explained below.
4.1. Descriptive Analysis
In total, 200 questionnaires were collected. The remaining 200 usable questionnaires
were analyzed with SPSS version 16 and AMOS version 18. The sample distribution was
presented on Table IV.1.
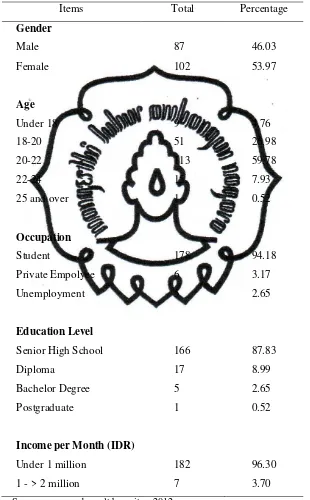
According to Table IV.1., most of the respondents were female (53.97%) and the others
were male (46.03%). Based on the age of respondents, most of the respondents were 20-22
years old. It could be seen on the highest percentage score (59.73%). Furthermore, most of
respondents were student (94.18%). The majority of respondents were reported to earn below
IDR 1 million per month. It could be seen on the percentage score (96.30%). The others were
Tabel IV.1. Sample Distribution
Items Total Percentage
Gender
Male 87 46.03
Female 102 53.97
Age
Under 18 9 4.76
18-20 51 26.98
20-22 113 59.78
22-24 15 7.93
25 and over 1 0.52
Occupation
Student 178 94.18
Private Empolyee 6 3.17
Unemployment 5 2.65
Education Level
Senior High School 166 87.83
Diploma 17 8.99
Bachelor Degree 5 2.65
Postgraduate 1 0.52
Income per Month (IDR)
Under 1 million 182 96.30
1 - > 2 million 7 3.70
commit to user
Based on education level, most of the respondents were graduated in senior high school
(87.83%).
4.2. Research Instrument Analysis
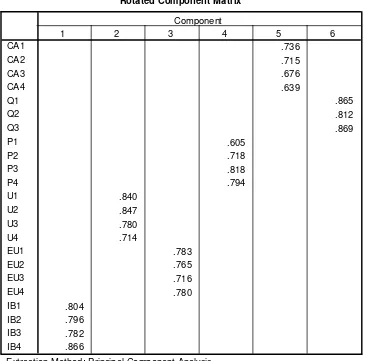
4.2.1. Validity Test
Validity test is used to determine whether valid or not questionnaires. (Ghozali, 2006).
The questionnaire is valid if the indicator can reveal the observed variable (Ghozali, 2006). This
test was conducted by using the validity of confirmatory factor analysis (CFA) using Amos
version 18. In this test every item must have item factor loading > 0.50 (Ghozali, 2006).
Table IV.2 showed the result of validity test that the items of the questionneaire had
Rotated Component Matrixa
Reliability test aims to measure the internal consistency of a research instrument. Based
on Sekaran (2006), the degree of reliability is divided into the following three criteria:
commit to user b. 0.6 to 0.799 = moderate
c. less than 0.6 = acceptable
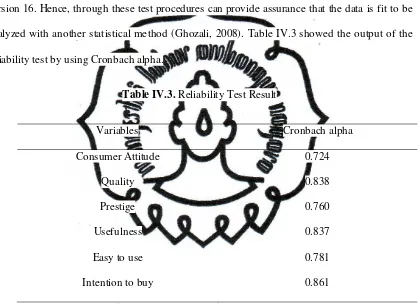
This test was conducted by using Cronbach Alpha. The data were analyzed by using SPSS
version 16. Hence, through these test procedures can provide assurance that the data is fit to be
analyzed with another statistical method (Ghozali, 2008). Table IV.3 showed the output of the
reliability test by using Cronbach alpha.
Table IV.3. Reliability Test Result
Variables Cronbach alpha
Consumer Attitude 0.724
Quality 0.838
Prestige 0.760
Usefulness 0.837
Easy to use 0.781
Intention to buy 0.861
Source: processed result by writer, 2012
According to Table IV.3. all of the variables were fulfilled the criteria of the reliability
test. Quality, Usefulness, and intention to buy (≥ 0.8-1.0). Consumer attitude, prestige, and easy
to use had moderate reliability (0.6 to 0.799). Hence, this test showed the variables had high
internal consistency and also showed all variables were fulfilled the criterion for acceptable
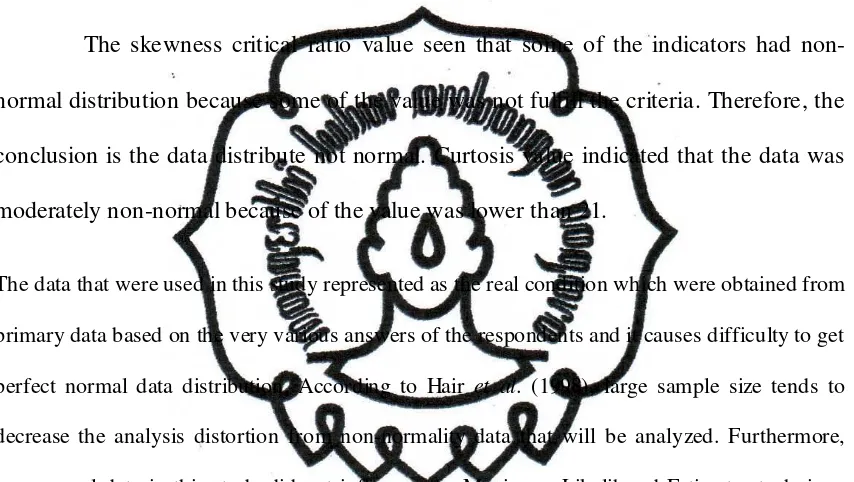
4.3.3. Normality Test
Normality is a data distribution in single matrix of variables that produce a normal
distribution (Hair et al., in Ferdinand, 2002). This test aims to determine normality of data
distribution pattern to follow or close to normal distribution. Table IV.4. showed the result of
normality test
The skewness critical ratio value seen that some of the indicators had
non-normal distribution because some of the value was not fulfill the criteria. Therefore, the
conclusion is the data distribute not normal. Curtosis value indicated that the data was
moderately non-normal because of the value was lower than 21.
The data that were used in this study represented as the real condition which were obtained from
primary data based on the very various answers of the respondents and it causes difficulty to get
perfect normal data distribution. According to Hair et al. (1998), large sample size tends to
decrease the analysis distortion from non-normality data that will be analyzed. Furthermore,
non-normal data in this study did not influence the Maximum Likelihood Estimates technique
(Ghozali and Fuad, 2005).
Table IV.4. Normality Test Result
Assessment of normality (Group number 1)
Variable min max skew c.r. kurtosis c.r.
ib4 2.000 5.000 -.401 -2.314 -.292 -.843
ib3 2.000 5.000 -.403 -2.329 -.280 -.810
commit to user
Variable min max skew c.r. kurtosis c.r.
ib1 2.000 5.000 -.431 -2.491 .452 1.305
ca1 3.000 5.000 -.046 -.267 -.772 -2.229
ca2 3.000 5.000 -.051 -.292 -.746 -2.154
ca3 3.000 5.000 -.035 -.200 -.643 -1.857
ca4 3.000 5.000 .031 .178 -.672 -1.939
eu1 2.000 5.000 -.252 -1.456 -.277 -.800
eu2 2.000 5.000 -.329 -1.900 -.488 -1.409
eu3 2.000 5.000 -.171 -.987 -.433 -1.250
eu4 2.000 5.000 -.281 -1.624 .588 1.697
u1 2.000 5.000 -.305 -1.762 .687 1.984
u2 2.000 5.000 -.308 -1.778 1.039 2.999
u3 2.000 5.000 -.315 -1.816 .204 .590
u4 2.000 5.000 -.317 -1.832 -.155 -.449
p1 2.000 5.000 -.281 -1.624 -.075 -.216
p2 2.000 5.000 -.250 -1.443 -.662 -1.911
p3 3.000 5.000 .026 .149 -.465 -1.344
p4 2.000 5.000 -.110 -.636 -.279 -.805
q3 2.000 5.000 -.326 -1.884 -.241 -.696
q2 2.000 5.000 -.383 -2.210 .110 .318
q1 2.000 5.000 -.328 -1.896 -.318 -.917
Multivariate 33.120 6.906
4.3. Structural Equation Modeling Analysis
This research uses Structural Equation Modeling (SEM) technique to analyze the
model. In principle, structural models aim to test the causality of the relationship variables so
that if one variable is changed, then there is a change in other variables. Furthermore, SEM
analysis aims to estimate the number of separate regression equations but each has a
simultaneous relationship (Ferdinand, 2002).
In this study, data were processed using AMOS version 18. There were several
assumptions that must be fulfilled before performing the test with the SEM approach. SEM
assumptions include the assumption of the adequacy of the sample, normality, and outliers
(Ferdinand, 2002).
4.3.1. The Sample Adequacy
The number of respondents in this research was 200 respondents. And 200
questionnaires had been completely filled and could be used in this research. The number of
samples met the requirement of Maximum Likelihood Estimation procedure of sampling
between 100-200 samples (Ghozali, 2008).
4.3.2. Outliers
Outliers are observations that appear with extreme values that have unique
characteristics that are very different from other observations and appears either in the form of
commit to user
Generally the treatment of outliers is by removing it from the data and not included in
subsequent calculations. If there is no particular reason to eliminated outliers, the observations
can be included in subsequent analysis. In this research, there was particular reason to eliminate
the values of outliers. The reason was to get the better value on Goodness of Fit before doing
modification model.
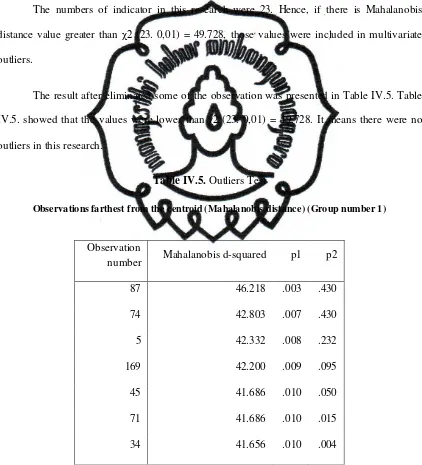
The numbers of indicator in this research were 23. Hence, if there is Mahalanobis
distance value greater than χ2 (23. 0,01) = 49.728, those values were included in multivariate
outliers.
The result after eliminated some of the observation was presented in Table IV.5. Table
IV.5. showed that the values were lower than χ2 (23. 0,01) = 49.728. It means there were no
outliers in this research.
Table IV.5. Outliers Test
Observations farthest from the centroid (Mahalanobis distance) (Group number 1)
Observation
number Mahalanobis d-squared p1 p2
87 46.218 .003 .430
74 42.803 .007 .430
5 42.332 .008 .232
169 42.200 .009 .095
45 41.686 .010 .050
71 41.686 .010 .015
Observation
number Mahalanobis d-squared p1 p2
15 40.413 .014 .007
53 39.655 .017 .007
….. ………. …... …...
19 22.728 .477 .327
123 22.671 .480 .311
Source: processed result by writer, 2012
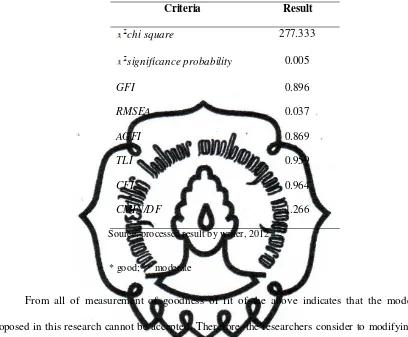
4.3.4. Goodness of Fit Analysis
Measuring the suitability of goodness of fit is needed before testing the hypotheses. The
results of goodness of fit measurement were showed in Table IV.6.
According to Table IV.6. chi-square value of 277.333 with 219 degree of freedom was
statistically significant at significance level of 0.000. Probability value 0,005 less than 0.05, it
was a bad indication.
It means there was a difference between the sample covariance matrix with the
observed population covariance matrix. GFI value of 0.896 indicated of a moderate value.
Meanwhile, AGFI value of 0.869 was indicative of a moderate as well. Moreover, TLI value of
0.959 was a good indication. CFI value of 0.964 was a good indication as well. RMSEA value
of .037 is a good indication. While the parsimony fit index measures the value gained Cmin /