Abstract—VAR is multivariate time series method that can be used to analyze the dynamic effects of disturbance factors contained in the system. VAR is a method that used linear pattern in modeling. Sometimes if the data was supposedly not linear, the linear method such as VAR will not suffice. Another approach that suffice nonlinierity is neural network (NN). Feed forward neural network (NN) is the most commonly used archi-tecture in NN. In this paper, there are two methods conducted. They are VAR and the combination of VAR and NN, called VAR-NN. There are three variables involved in this study. They are rice production, rice procurement, and rice price. The comparison result by using the rice procurement shows that VAR-NN yields better forecast than VAR. But, The comparison result by using the rice price data and rice procurement data show that VAR-NN yields worse forecast than VAR. Since this study focused on predicting rice procurement, so the best model achieved in this research comes from the class of VAR.
Keywords—Multivariate Time Series, VAR, VAR-NN, Neu-ral Network, Rice Procurement.
I. INTRODUCTION
ice is important needs for Indonesian people. Rice con-sumption of Indonesian people reaches 139 kg per person per year, that was higher compared to rice consumption of Malaysia and China [6]. Therefore, the issue about rice become sensitive and difficult to deal with. Since the Dutch
reign, the problem about rice can’t be separated from
government interference. The background of the government interference in rice problem, is due to the fluctuation of the rice price which had fallen sharply in 1919 to 1930 and made farmer had difficulties paying the taxes [3]. That history, eventually becoming the forerunner of the establishment of a food institute that is currently named Bureau of Logistics (BULOG). BULOG, had a fundamental duty controlling and managing the price and inventory of rice and other foodstuffs in order to maintain the stability of price and quality for producers and consumers. To achieve these objectives, one of the operational function of BULOG is domestic procuring or domestic purchasing.
The basic principal in domestic procuring was the gover-ment do the procuring if the price of rice was the same or
lower than base price which is established by BULOG. This implies that rice procurement is an important component in stabilisation of rice price [2]. As a province which has highest number of rice procurement, reaching 738.303 tons or about 31 percent of national rice procurement, East Java has great
role in rice price stabilisation. So that it’s necessary to predict
the number of rice procurement. If BULOG can know the approximation of rice procurement, BULOG will be able to calculate lack or excess of inventory that was needed. Thus, BULOG can prepare the necessary step early. The result of predicting can also be used to construct prognosis of rice procurement in the future.
There was research about rice procurement which is made by Atmodiwiryo [2]. In his research, Atmodiwiryo examined the relationship between the national rice production, rice production deviations from its trend, the difference in the retail price of rice with a base price set by BULOG and rice procurement held by BULOG. Another research about rice was conducted by Alberto, Koo and Kim [1]. In their research they used Vector Autoregressive (VAR) method to obtain the model of rice market and its connection with oil price shocks.
VAR Analysis is also a very useful analytical tool, both in understanding the reciprocal relationship (interrelationship) between the variables, as well as in the structured modeling [5]. VAR is a method that used linear pattern in modeling.
Sometimes, the pattern of real data can’t be seen easily.
Therefore it was difficult to see the pattern of the data whether it was linearly distributed or not. However, if the data was supposedly not linear, the linear method such as VAR will not suffice. Another researches, like the one which conducted by Cameron and Moshiri [4] and Suhartono [8] imply that method with nonlinear pattern such as Neural Network (NN) have better accuration
II. LITERATURE A. Vector Autoregressive (VAR) Model
The vector autoregression (VAR) model is one of the most successful, flexible, and easy to use models for the analysis of multivariate time series when compared to other methods. general model of VAR(p) process can be written as
fo-Forecasting Rice Procurement in Regional
Divisions of East Java Using Vector
Autoregressive(Var) and Var-Nn Method
Eva Laylatus S., Suhartono
Statistics Department, Faculty of Mathematics and Science, Sepuluh Nopember Institute of
Technology (ITS)
Jl. Arief Rahman Hakim, Surabaya 60111 Indonesia
: [email protected]
llows[10]
rameter for seasonal term.atism1vector of residuals at time
t, Yt is m1Vector of variables at time t. Equation (1) can be
written as matrix, with three variables included. 11 12 13 theses of this test is linearity in mean. Suhartono [8] explains the procedure of getting the test statistics for terasvirta test which is introduceed by Terasvirta and Lin [9] These procedures explain the steps to get F-statistic and X2-statistic for terasvirta test.
tional variables, then compute coefficient
determi-nation (R
2).
3.
Compute
2 2 ,X nR n
is the amount of data used.
b.
Procedure to get F-statistic.
1.
Regress
Y
twith
1, ,...,
Y
tY
t pand
compute
the
residuals
u
ˆ
t
Y
tY
ˆ
t.
2.
Compute first sum square error (SSE
0) as
uˆt23.
Regress the residuals
u
ˆ
twith 1, ,...,
Y
tY
t pand
m
additional variables, then compute another residual
ˆˆˆ
t t vtv
u
.
4.
Compute second sum square error (SSE
1) as
vˆt25.
Compute F-statistic using formula as follow
0 1
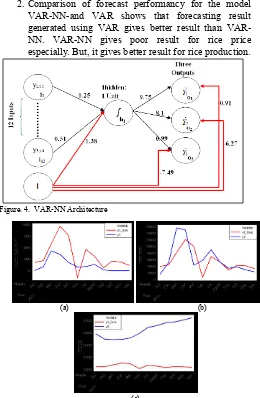
C. Vector Autoregressive-Neural Network (VAR-NN) Model VAR-NN model is a Neural Network modeling based on the order of the VAR model input. The number of neurons in output layer of this architecture are the same with the number of series to be used in VAR model. The architecture of VAR-NN model with order p or VAR (p)-VAR-NN can be seen in Figu-re 1. FiguFigu-re 1 displays an example of architectuFigu-re of the mo-dels VAR-NN with three neurons in the input layer, four units in the hidden layer, and three neurons in the output layer.
Suppose the weight of ithneuron in the input layer to
While the weight of of the jthneuron in the hidden layer to
thekthneuron in the output layer denoted asjk, then the m h weight matrix for the output layer become
1,1 1,2 1, of residual for hidden layer and output layer, so that the output of VAR-NN model can be defined as[11]
( )
Equation (6) is the activation function which can be written as
The selection of best model was based on the out-sample criteria. The criteria used is root mean square error (RMSE). RMSE is a good measure of accuracy, but only to compare forecasting errors of different models for a particular variable and not between variables, as it is scale-dependent [7]. The formula to compute RMSE is as follows
Figure. 1. Architecture of VAR( p)-NN with three variables and single hidden layer
(1)
(2)
Input layer Hidden layer
Output layer (3)
(4)
2
The data used in this research are secondary data. All of the data were obtained from internal sources of BULOG Regional Divisions of East Java. There are three variables which will be used in this research. They are rice pro-curement(y1t), production equivalently to rice (y2t), and rice price at the producer level (y3t).
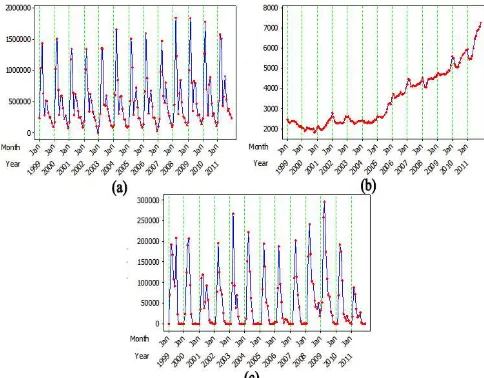
This research used in-sample and out-sample scenarios. Each data was divided into training data and testing data. In-sample forecast was get from training data. And out-sampel forecast was tested using testing data. The training data which are used here was the data from January 1999 until December 2010, with the amount of data is 144. While testing data was from January 2011 to December 2011, with the amount of data as much as 12. Rice procurement data and rice production data are in hundreds of tons, and rice price data is in rupiah.
The analysis was begin by computing the descriptive statis-tics for each variables. Then the modeling using VAR method conducted. But, before doing that, model identification for time series was applied. Then, the nonlinierity test was conducted. VAR-NN was done after that. After getting all of
the model and residuals, RMSE was computed then it’s being
compared to determine the most appropriate model.
IV. RESULTANDDISCUSSION A. Descriptive Statistics
The majority of rice procurement occurred in April for all the year, except for 1999, 2000, 2007, and 2011. While the lowest procurement happens at the beginning and the end of the year. This phenomenon happens because at the beginning and at the end of the year, are actually the beginning of planting season. When in February until June the farmers are busy for harvesting because of panen raya. Therefore, the supply at those times is high. And that makes the price go down below the base price (Harga Pembelian Pemerintah-HPP). The basic principal in domestic procuring was the goverment do the procuring if the price of rice was the same or lower than base price. Hence, for that purpose, BULOG do some procurement. That action make the number of rice procurement was high especially during active harvest season like panen raya.
The rice price tend to increase every year. But, in 2011, the increasing of the rice price is higher than the increasing of rice price in other year. This happened because of the long dry season. Long dry season make the amount of supply decreased. The price of rice in 2011 increased significantly, mainly from the season panen raya to panen gadu. Apart from long dry season, the increasing of rice price also caused by
people’s purchasing pattern. People tend to do “panic buying”
when ramadhan is coming. Panic buying is the act of people buying unusually large amounts of a product in anticipation of large price increase or shortage. Because ramadhan 2011 is in august, the increasing of rice price is detected since June and July. The increasing of rice price in 2011 also give impact to
the rice procurement. Because the increasing of the rice price is higher than the increasing of rice price in other year, the rice procurement in 2011 is lower than the years before.
The majority of rice production occurred in March for all the year. Among all harvest season, panen raya provides highest rice production. Panen raya happens from February until June.
B. VAR modeling.
Model identification indicates that all of the data were not stationary. There is seasonality in rice production data and rice procurement. By seasonality, we mean periodic fluctu-ations. And there is trend components in rice price data because of its tendency being upwards. Since all of the data were not stationary, the differencing was conducted. The order of non-seasonal differences are 1 and the order of non-seasonal differences are 12.
Based on MPACF and minimum information criterion, there are two models proposed. They are VARIMA (2,1,0)(0,1,0)12 and VARIMA (4,1,0)(0,1,0)12 . Parame-ters estimation are done for the model VARIMA (2,1,0)(0,1,0)12 and VARIMA (4,1,0)(0,1,0)12. After the parameters for the model were estimated, then the signi-ficancy of the parameter estimation will be tested. Signifi-cancy test of these parameters was using the null hypo-theses that states the parameters are not significant, a-
gainst the alternative
hypotheses that states the parame-ters are significant. Inferences can be made by comparing the p-value of the test results with signifi-cance value ( ) which is determined by researcher at 5% or 0.05. If the obtained p-value wereFigure. 2. Time Series Plot Of All Variables; a)Rice Production(ton), b)Rice Price(Rp), c)Rice Procurement(ton)
smaller than then the null hypotheses would be rejected and vice versa. Since not all of the parameters estimated is significant, the restriction command was applied to overcome any unsignificancy
.
After the estimation of the model parameters is obtained, the next step is checking the residuals wether they are white noise and normal or not. Based on the AIC value for residuals, the smallest value of AIC lies in the lag AR (4) for VARIMA (2,1,0)(1,1,0)12 and AR (0) for (4,1,0)(2,1, 0)12. These results indicate that the residuals of VARIMA (2,1,0) (0,1,0)12 models does not meet the assumption of white noise residuals. The multivariate normality test conducted indicate that both models have multivariate normal residuals, since p-values for both model exceed 0.05. The p-values for VARIMA (2,1,0) (1,1,0)12 and VARIMA (4,1,0)(2,1, 0)12 are 0.627 and 0.629 respectively. After doing the diagnostic checking, the forecasting was conducted. The forecasting result can be seen using Time Series plot in Figure 3.
After getting the forecasts, the root mean square error was computed. This value was used as the base of best model selection.
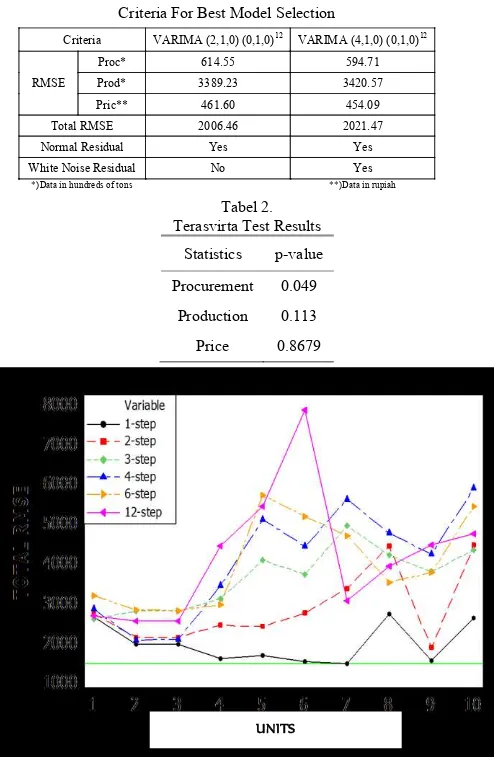
The comparison results of out-sample RMSE values in Table 1 show that RMSE of the model VARIMA (4,1,0) (0,1,0)12 at procurement variable is smaller than the one from VARIMA (2,1,0)(0,1,0)12 model. As well as for price variable. Yet the RMSE of the model VARIMA (4,1,0) (0,1,0)12 at production variable is larger than the RMSE values of the model (2,1,0) (0,1,0)12. So it can be decided that the best VAR model for the analysis of rice data is VARIMA (4,1,0)(0,1,0)12. Since it has the smaller RMSE for two variables and fulfilled the assumption of normal and white noise residuals.
C. Terasvirta Test
The null is the hypotheses of linearity in “mean”. The null
hypotheses would be accepted if p- value is more than 0.05. The results of nonlinierity test for each variables are displayed in table 2.
The table shows that p- value for rice procurement is less than 0.05. Therefore the null hypotheses is rejected. Since, ri-ce procurement was nonlinier, VAR-NN method should be conducted though the other variables seems follow linierity. D. VAR-NN modeling
VAR-NN model is conducted using several units in one hidden layer. The selection of the best models done by looking at the smallest RMSE value of the results from out-sample fore-casts. There are six out-sample forecasts scenario for each architecture. The scenarios using one-step ahead forecast and multiple-step ahead forecast. The one with smallest RMSE value is the best architecture. There are ten architecture conducted, twelve input and three output included for each architecture. The smallest total RMSE was get by using seven units in one hidden. Fluctuations in total RMSE score by the number of units in the hidden layer for the six scenarios can be seen clearly using line plot. Line plot is displayed in Figure 3.
Straight horizontal green line shows that seven units gives the smallest total RMSE among all architectures. Based on Figure 3, the smallest movement of the total RMSE value indicated by the black line, which is the total RMSE for forecasting the movement of 1-step ahead forecasts. While the largest RMSE value for the six scenarios obtained from 12-
Figure 4. Line Plot of Total RMSE Tabel2. Terasvirta Test Results
Statistics p-value
Procurement 0.049
Production 0.113 Price 0.8679
Tabel1.
Criteria For Best Model Selection
Criteria VARIMA (2,1,0) (0,1,0)12 VARIMA (4,1,0) (0,1,0)12
RMSE
Proc* 614.55 594.71 Prod* 3389.23 3420.57 Pric** 461.60 454.09 Total RMSE 2006.46 2021.47 Normal Residual Yes Yes White Noise Residual No Yes
*)Data in hundreds of tons **)Data in rupiah
(a) (b)
(c)
Figure. 3. Time Series Plots VAR for;a)Procurement, b)Production, c)Price
step ahead forecasts with six units in the hidden layer. Although total RMSE give a hint that seven units provide smallest total RMSE, the RMSE for rice procurement is unbelievably bad (930.61). Since this research focused to forecast rice procurement, the best models for VAR-NN is to do forecasting for 1-step ahead forecast with one unit in the hidden layer. The architecture for this model is displayed in Figure 4.
The equation models of VAR-NN architectures for each variables based on figure 4 are as follows,
a. Rice Procurement
with f ( )h is the sigmoid activation function as follows
1 variables are shown in the form of time series plot in Figure 5. The red line in Figure 5 represents the forecasting result of VAR-NNwhile the blue one represents the actual testing data. E. Comparison Result for VAR and VAR-NN Model
Forcasting using VAR and VAR-NN methods conducted to forecast data for one year ahead, where the value of the best forecasts for VAR-NN method is obtained with one neuron in hidden layer and using one-step ahead scenario. Furthermore, RMSE values of each model are compared to determine a While the smaller RMSE for rice production was get by using VAR-NN model. The ratios score also explained that for procurement and price, VAR method is more appropiate than VAR-NN method.
V. CONCLUSIONANDRECOMMENDATION
The conclusions for this research are as follows:
1.RMSE value for forecasting rice procurement is 594.71 using VARIMA (4,1,0)(2,1,0)12 While using VARIMA (2,1,0)(2,1,0)12 the RMSE is 614.55RMSE value for forecasting rice procurement is 610.17 using VAR-NN (1-unit). While using VAR-NN (7-unit)the RMSE is
930.61, and the SMAPE is 79%.
2.Comparison of forecast performancy for the model VAR-NN-and VAR shows that forecasting result generated using VAR gives better result than VAR-NN. VAR-NN gives poor result for rice price especially. But, it gives better result for rice production.
So the most appropiate model for rice procurement is using VARIMA (4,1,0)(0,1,0)12 with the equation as follows:
1, 1, 1 1, 2 1, 3 1, 4 that the model obtained is not optimal. For further research, it is recommended that researchers using other methods that can
Tabel3.
RMSE of Out-sample for Both Methods
Model RMSE Total RMSE Procurement Production Price
VAR 594.71 3420.57 454.09 2021.47 VAR-NN 610.17 3366.66 3053.37 2647.63
Ratio to VAR 1.02 0.98 6.72 1.309
(a) (b)
(c)
better represent the data. Besides, adding a variable that is presumed to help in forecasting rice procurement may also be performed. And for BULOG, Considering that rice procurement is an important policy done by BULOG, there are many factors that affects the determination of rice procurement. Although rice price and rice production are statistically significant, the forecasting result are still bad. It means that, rice price and rice production are not the main factor in determining the rice procurement policy. So other factor such as sum of import or rice price at consumer level can be used in determining the rice procurement. But these two variables (rice price and rice production) may also considered in determination of rice procurement.
REFERENCES
[1] Alberto, M., Koo, C.M. and Kim, W.J, “Oil Shocks and the World Rice Market Puzzle: a Structural VAR analysis”, Kangwon: Kangwon National University (2010)
[2] Atmodiwiryo, M. S., “Analisis Faktor-Faktor yang Mempengaruhi Jumlah Pengadaan Beras Dalam Negeri Badan Urusan Logistik”, Bogor: Institut Pertanian Bogor (1997)
[3] BULOG.(2010),Sejarah Perum BULOG [Online]. Available: http://www.bulog.co.id/ sejarah_v2.php.
[4] Cameron, N. and Moshiri, S, “Neural network versus econometric models in forecasting inflation”. Journal of Forecasting (2010)
[5] Hadi, Y. S., “Analisis Vector Auto Regression (VAR) Terhadap Korelasi Antara Pendapatan Nasional dan Investasi Pemerintah di
Indonesia”, Jurnal Keuangan dan Moneter (2003)
[6] Hariyanto, B, “Difersivikasi Pangan Menjadi Keharusan”. Sebuah Ringkasan (2012)
[7] Hyndman, R. J. K and Anne, B, “Another look at measures of forecast
accuracy”. International Journal of Forecasting (2006) 679–688.
[8] Suhartono, “Feedforward neural Network untuk Pemodelan Runtun
Waktu”, Disertasi, Universitas Gajah Mada Yogyakarta (2007)
[9] Terasvirta, T., Lin, C.F. and Granger, C.W.J, “Power of The Neural
Network Linearity Test”, Journal of Time Series Analysis, 14, (1993)
159-171.
[10] Wei, W.W.S. ,Time series Analysis Univariate and Multivariate Methods, New York: Pearson education, Inc (2006)